

Article Figures & Data
Figures
- Fig. 1.
mGluR5 alternates between states of fast and slow diffusion. A, Principle of single-particle tracking. A 0.5 μm latex bead coated with anti-myc antibodies is manipulated with laser tweezers and held in contact with a live cell transfected with mGluR5-myc or mGluR5-myc-GFP. Contact is maintained 5 sec to allow antibody–receptor interactions. On release of the tweezers, the movement of the bead, and thus of the underlying receptors, is followed in real time by video microscopy. B, Typical trajectory of a bead coupled to mGluR5-myc expressed in a neuron at 7 DIV. The movement alternates between fast (blue) and slow (red) diffusion as detected from the curve inD. The trajectory is superimposed on the DIC image of the neurite. C, Dual plot of the percentage of bead binding to cells (solid line) and the mean diffusion coefficient (dashed line) for mGluR5-bound beads at different dilutions of the anti-myc antibody coupled to the bead. The anti-myc antibody was diluted with an anti-HA antibody. Data ± SEM are given in this and subsequent figures; 6–36 beads per data point. At 1% dilution, bead binding is within background nonspecific binding levels; thus diffusion was not computed. D, Plot of the diffusion coefficient versus time, calculated for the trajectory in B, exhibiting periods of slow and fast diffusion.E, Plot of the confinement index versus time, evaluated by the L function, calculated for the same trajectory. Confined events characterized by an L > 3.16 are indicated above the plot by red boxes and correspond to the red stretches inB. This convention is kept throughout the figures.F, Plot of the mean diffusion coefficient versus time (n = 36 trajectories). G, H, Plots of the mean of the MSD functions versus time calculated on diffusive (G; n = 106) and confined (H; n = 104) events. Error bars indicate SEM. Note that MSD curves are almost linear on diffusive events and negatively curved on confined events. I, Histogram of mean instantaneous (ins) and asymptotic (asym) diffusion coefficients, calculated from the slope at the origin or the end of each MSD curve. Values are of the same order of magnitude for diffuse events and differ by one order of magnitude for confined events.
- Fig. 2.
DHPG increases mGluR5 diffusion.A–D, Trajectories (A, B) and corresponding confinement index-versus-time plots (C, D) of two mGluR5-myc-bound particles recorded in the absence (A, C) or presence (B, D) of 10 μmDHPG. E, Histograms of the mean dwell times for diffusive and confined events detected on trajectories recorded in the absence (gray bars) or presence (black bars) of DHPG. F, Histograms of the mean instantaneous diffusion coefficients for diffusive and confined events in the absence or presence of DHPG. Note that diffusion is always higher in the presence of DHPG.
- Fig. 3.
Comparison of endogenous and transfected levels of Homer1b and mGluR5. A–D, Immunocytochemical staining of endogenous Homer proteins revealed with a pan-Homer antibody (red) in cultured hippocampal neurons (A) and Ptk2 cells (C) transfected or not with Homer1b-GFP (green, arrow) and phase contrast pictures of the same cells (B, D). Homer1b is endogenously expressed in some cultured hippocampal neurons (red, arrowhead) but not in other neurons or nontransfected Ptk2 cells (asterisk).E, Western blots revealed by anti-Homer1b (left blot) and anti-mGluR5 (middle, right blots). Each line contained, from left toright, extracts of control Ptk2 cells, Ptk2 cells transfected with Homer1b-GFP plus mGluR5-myc, cultured hippocampal neurons, and dissected hippocampi. Arrows on theleft indicate the molecular weights of 45 and 71 kDa, corresponding, respectively, to Homer1b and Homer1b-GFP.Arrows on the right indicate the molecular weights of 150 and 300 kDa, corresponding, respectively, to monomeric and dimeric mGluR5. Control Ptk2 cells express no Homer1b or mGluR5, whereas cultured neurons express Homer1b and low levels of mGluR5, as revealed on the right-most line, which is the same as that for the middle blot but exposed for a longer time.
- Fig. 4.
mGluR5 is coaggregated with Homer1b in surface clusters. Surface expression of myc-tagged mGluR5 variants (red) in neuronal (A, C, E, G) or Ptk2 (B, D, F, H) cells cotransfected or not with GFP-tagged Homer variants (green) is shown. Diffuse distribution at the cell surface of full-length mGluR5-myc expressed alone (A, B) or coexpressed with Homer1a-GFP (E, F) and of mGluR5-DelC-myc coexpressed with Homer1b-GFP (G, H) is shown. Only coexpression of full-length mGluR5-myc plus Homer1b-GFP promotes the formation of clusters in which both proteins colocalize (C, D). Scale bar, 10 μm. Insets, 5× magnifications of the subregions indicated in each panel. Arrows point to examples of clustered receptors. I, Quantification of the relative density of full-length or truncated mGluR5-myc in Ptk2 cells ± SEM, in the presence or absence of short (H1a-GFP) or long (H1b-GFP) forms of Homer. J, Measure of the mean number of mGluR5-myc-containing clusters ± SEM in the same conditions.
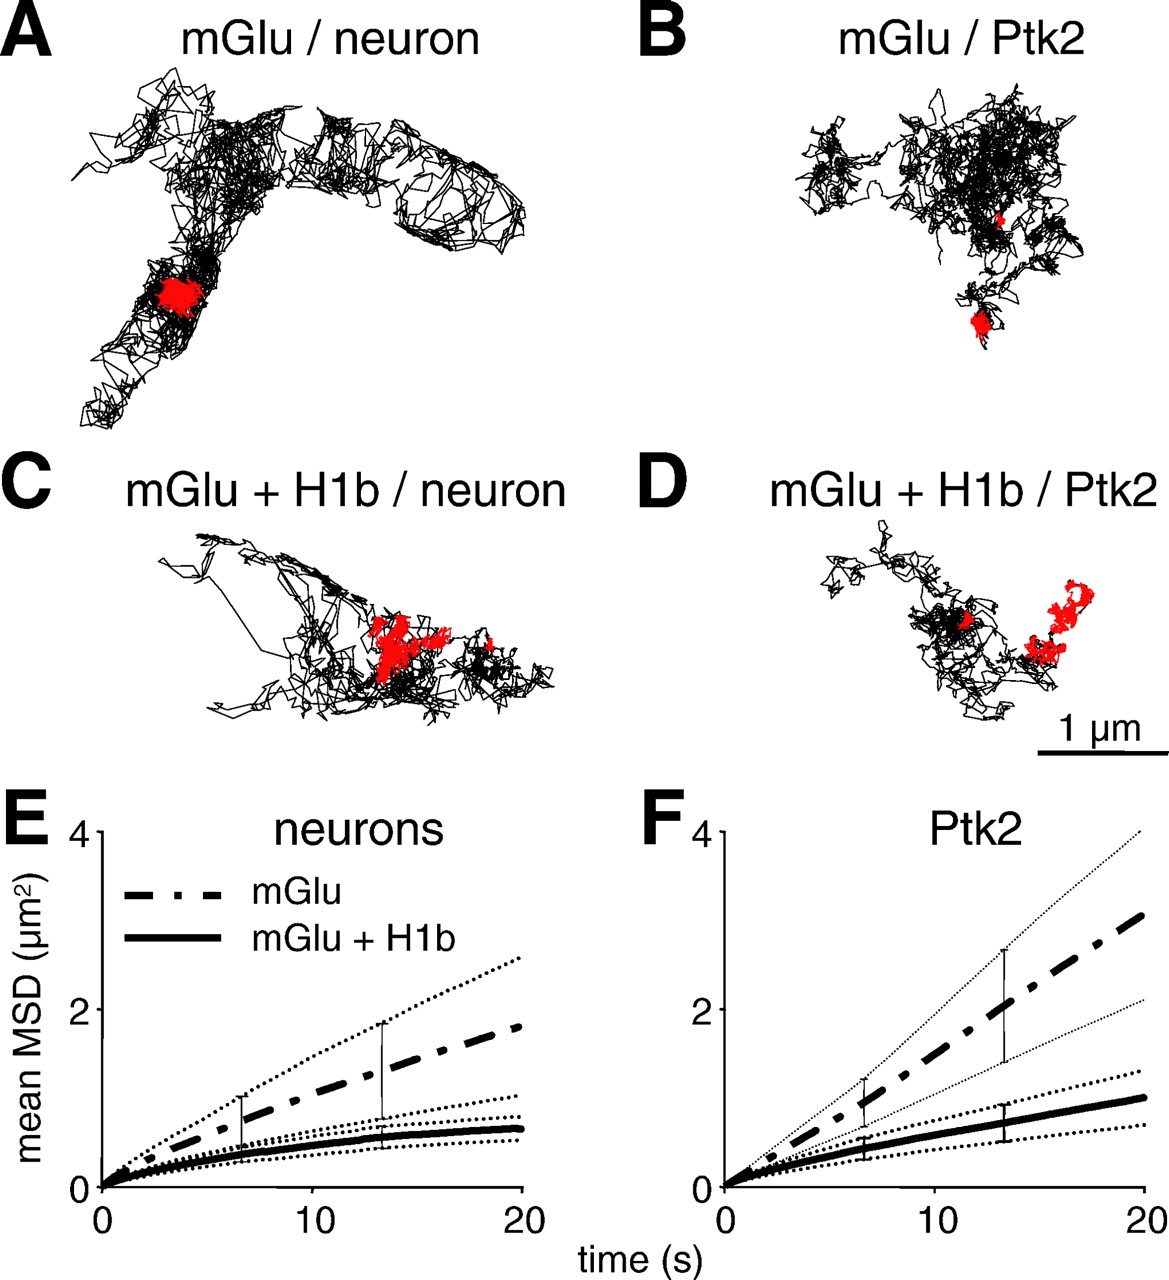
- Fig. 5.
Movements of mGluR5-myc are more confined in the presence of Homer1b. A, F, Typical trajectories of latex beads coupled to mGluR5-myc in the presence or absence of Homer proteins expressed in neurons (A, C) or Ptk2 epithelial cells (B, D). Bead positions are shown for 200 sec (sampling at 25 Hz). Note that in the presence of Homer1b (C, D), particularly in neurons (C), beads remained for long times confined in subdomains (red). Calibration is identical for all plots. E, F, Plots of the means of the mean square displacement-versus-time function for trajectories recorded in neurons (left) or in Ptk2 cells (right) expressing mGluR5-myc alone (dotted line) or together with Homer1b-GFP (solid line). The number of trajectories lies between 30 and 43 for each curve. Error bars indicate SEM. Note that in both cell types the slope of the MSD curve is smaller in the presence of Homer1b (p < 0.05, Student's t test on last values).
- Fig. 6.
Kinetic properties of the equilibrium between the confined (Conf) and diffusive (Diff) states of mGluR5-myc. A, B, Plots of the cumulative distribution versus time of diffusive (A) and confined (B) dwell times in Ptk2 cells expressing mGluR5-myc alone (circles) or together with Homer1b (crosses). Curves were fitted with the sum of two exponential functions with time constants as indicated.C, Histograms of the mean values of the dwell times in the diffusive and confined states in Ptk2 cells expressing mGluR5 alone or mGluR5 plus Homer1b. D, E, Histograms of the mean values of the probability to be in a confined state ± SEM in neurons pooled at all ages (D) or as specified (E) and in Ptk2 cells (D) expressing the indicated variants of mGluR5-myc and Homer. Note that this probability is highest for full-length mGluR5-myc plus Homer1b and that this value increases with neuronal maturation for mGluR5 alone but remains high in the presence of Homer1b. Each value was compared with that in the presence of mGluR5 plus Homer1b with Student'st test: *p < 0.05; **p < 0.01; ***p < 0.001.
- Fig. 7.
Receptors in a confined state are associated with Homer and mGluR5 clusters. A, B, Simultaneous visualization of mGluR5-myc trajectories and fluorescence of Homer1b-GFP (A) or mGluR5-myc-GFP (B) in two hippocampal neurons cotransfected with mGluR5-myc and Homer1b-GFP (A) or mGluR5-myc-GFP and Homer1b-myc (B). The initial (ti = 0 sec) and final (tf = 200 sec) positions of the receptors are indicated by arrows. The differential interference contrast image (gray level) of the cells is combined with the binarized fluorescence image of GFP. In B, the GFP cluster moved in parallel with the confined trajectory, and its initial and final positions are represented in dark and light green, respectively. C, D, Corresponding plot of confinement index versus time for the trajectories represented in Aand B, respectively. Note that beads can bind and unbind repetitively from the same cluster (A, C) or follow cluster movements (B). E, F, Plots of the mean distance between confinement domain and nearest GFP cluster versus mean intercluster distance for experiments as inA and B, respectively. Eachpoint corresponds to the mean measures on one trajectory. The line draws the border below which the distance between confinement periods and nearest GFP cluster is below that expected for a random distribution.
- Fig. 8.
mGluR5-GFP clusters diffuse in the plasma membrane. A, Time-lapse images of epifluorescence of a neuron cotransfected with mGluR5-GFP and Homer1b. Sample time, 25 sec. The movement of a diffusing cluster is highlighted by thearrows, with the corresponding trajectory inB. C, Plot of the distribution of the cluster diffusion coefficients computed from tracks of images as inA. D, Plot of the distribution of the asymptotic diffusion coefficients measured on MSD plots during confined events in SPT experiments performed on neurons coexpressing mGluR5-myc and Homer1b. E, F, Analysis of the minimum force required to drag receptors in the plane of the membrane in the confined and diffusive states. Note that diffusive receptors require a minimal force to be dragged, whereas confined receptors can be either immobilized or dragged by an intermediate force.
- Fig. 9.
Reversibility of cluster composition visualized by FRAP. A, B, Plots of the normalized fluorescence intensity of mGluR5-GFP versus time before and after photobleaching (vertical arrow), recorded in a region containing scattered (A) or clustered (B) receptors. The fluorescence intensity is monitored on neurons cotransfected with mGluR5-GFP and Homer1b on a 2.1-μm-diameter region, as depicted by the white arrowin the inset. Spots of clustered receptors are identified as peaks on line scans of fluorescence intensity (insets). The recoveries are fitted with single exponentials to measure the half-recovery times, as indicated. C, Histogram of mean half-recovery times for regions containing scattered or clustered receptors. Note that recovery is slower for clusters. D, Histogram of mean recovery fractions for regions containing scattered or clustered receptors. Note that clusters recover to the same extent as scattered receptors. ***p < 0.001.


