

Abstract
We used homologous recombination in the mouse to knock-out RC3, a postsynaptic, calmodulin-binding PKC substrate. Mutant brains exhibited lower immunoreactivity to phospho-Ca2+/calmodulin-dependent protein kinase II (CaMKII) but had the same synaptic density as wild type and did not exhibit a gross neuroanatomical phenotype. Basal excitatory synaptic transmission in CA1 was depressed, long-term potentiation (LTP) was enhanced, and the depressant effects of the metabotropic glutamate receptor (mGluR) agonist (RS)-3,5-dihydroxyphenylglycine was occluded compared with littermate controls. The frequency–response curve was displaced to the left, and long-term depression (LTD) could not be induced unless low-frequency stimuli were preceded by high-frequency tetani. Depotentiation was much more robust in the mutant, and only one stimulus was required to saturate LTD in primed mutant hippocampi, whereas multiple low-frequency stimuli were required in wild-type slices. Thus, ablation of RC3 appears to render the postsynaptic neuron hypersensitive to Ca2+, decreasing its LTD and LTP thresholds and accentuating the effects of priming stimuli. We propose an mGluR-dependent CaM-based sliding threshold mechanism for metaplasticity that is governed by the phosphorylation states of RC3 and CaMKII.
- neurogranin
- PKCγ
- CaMKII
- metaplasticity
- mGluR
- neuroplasticity
- LTP
- LTD
- depotentiation
- priming
- molecular switch
- postsynaptic
- frequency response
- calcium
- dendrite
- dendritic spine
Long-lasting modifications of synaptic strength underlie important brain functions and are thought to represent basic mechanisms of long-term memory. Bienenstock et al. (1982) formulated a theory of developmental neuroplasticity to explain activity-dependent synaptic changes within the visual cortex of the kitten: persistent synaptic activity that falls below the modification threshold, θm, causes synaptic weakening [long-term depression (LTD)], whereas that which falls above leads to synaptic strengthening [long-term potentiation (LTP)]. Bienenstock et al. theorized that θm changes as a function of time-averaged postsynaptic activity, such that a lack of persistent activity increases the ease with which LTP can be induced, whereas continuous activity biases the synapse toward LTD. In a closely related model formulated by Artola et al. (1990) to explain heterosynaptic shifts of the frequency–response function in hippocampal slice preparations, two thresholds were defined: θ− and θ+. The former is the threshold above which LTD is induced, whereas the latter is the LTD–LTP threshold, corresponding to θm in the theory of Bienenstock et al. Abraham and Bear (1996) later coined the term “metaplasticity” to describe all phenomena in which previous synaptic activity modifies the degree or direction of long-term changes in synaptic strength caused by subsequent stimuli.
The frequency–response function is displaced toward LTD in transgenic mice that express a pseudo-phosphorylated sequence variant of Ca2+/calmodulin-dependent protein kinase II (CaMKII) (Thr286Asp) (Mayford et al., 1995). Autophosphorylated CaMKII sequesters CaM (Meyer et al., 1992), so θm and θ+ are probably influenced by the availability of CaM. CaMKII has also been implicated in metaplastic phenomena, as has the metabotropic glutamate receptors (mGluRs) and the NMDA receptor (for review, see Abraham and Tate, 1997).
RC3/neurogranin is a forebrain-enriched, postsynaptic member of the calpacitin protein family, a family that includes GAP-43 (growth-associated protein 43; also known as neuromodulin and B-50), PEP-19 (peptide protein 19), Igloo, and SP17 (sperm protein17) (for review, see Gerendasy and Sutcliffe, 1997; Gerendasy, 1999). Members of this family are highly abundant, contain homologous CaM-binding domains, and interact with CaM in the absence of Ca2+ with equal or greater affinity than when Ca2+ is present, characteristics consistent with our proposal that the calpacitins regulate CaM availability. RC3 is a specific substrate of the γ isoform of protein kinase C (PKCγ) (Ramakers et al., 1999), and its phosphorylation can be induced with mGluR agonists in hippocampal slice preparations. Phospho-RC3 does not interact with CaM, regardless of Ca2+ levels (Huang et al., 1993; Gerendasy et al., 1994a; Gerendasy et al., 1995).
Previously, we proposed a model wherein the phosphorylation states of both RC3 and CaMKII dictate the LTD–LTP threshold θm (Gerendasy and Sutcliffe, 1997). To test this hypothesis, we used homologous recombination in the mouse to disrupt RC3. The phenotype generated in the homozygous null mutant should be equivalent to that which would occur were RC3 constitutively phosphorylated and, therefore, unable to interact with CaM. Here we show that the frequency–response functions θ− and θ+ are displaced to the left in the RC3 mutant [RC3 knock-out (KO)], as predicted by our model, and we propose that RC3 is an important component of mGluR-mediated metaplasticity. A previous study by Pak et al. (2000) reports the independent generation of an RC3 KO mouse line and its preliminary analyses particularly with respect to behavioral parameters.
MATERIALS AND METHODS
The RC3 KO mouse
We isolated a genomic clone containing exon 2 and contiguous sequences from a λ-Dash (Stratagene, La Jolla, CA) library containing a partial Sau3A digest of C57BL/6J mouse genomic DNA cloned into the BamHI site. A synthetic linker containingBamHI and NotI sites was then inserted betweenApaI and XmaI sites within the open reading frame of exon 2 (see Fig. 1A). We cloned lacZ(Amersham Biosciences, Arlington Heights, IL) in frame with 5′ encoding region of RC3, between a natural PstI site and the synthetic BamHI site. A neomycin expression cassette (neo) was cloned into the synthetic NotI site. We later replaced the left arm of the KO construct with a homologous fragment from a partial HindIII digest of a genomic clone isolated from a 129SvJae library (Stratagene). The right arm was replaced with a homologous XmaI/EcoRI fragment from the same library, and a diphtheria toxin expression cassette was cloned into the EcoRI site. We then linearized the construct with SalI and electroporated it into 129/SvJae (J1) embryonic stem cells (Joyner, 1993).
We identified homologous recombinants by Southern blot analysis and implanted them into C57BL/6J blastocysts (Hogan, 1994). Resultant chimeras were mated to Black Swiss mice, and germ line transmission was assessed by PCR using neo-specific primers (5′CTTGGGTGGAGAGGCTATTC and 5′-AGGTGAGATGACAGGAGATC). Only one chimera produced recombinant offspring, and these were crossed with C57BL/6J backgrounds for multiple generations. We genotyped them by PCR using the neo-specific primers, which generate a 280 bp PCR product from heterozygous or homozygous tail DNA and a second primer set (5′-AGAGCGGAGAGTGTGGCCGGAAG and 5′-CCTGGAAGATGAGAACCTCCCGC) that hybridizes to native RC3 sequences on either side of thelacZ-neo disruption, generating a 150 bp PCR product from wild-type (WT) or heterozygous tail DNA.
Western blot
RC3 expression in RC3 KO and WT brains. We homogenized forebrains from a homozygous RC3 KO, a heterozygote, and a WT mouse in 3 ml of PBS and 0.6 mm PMSF and added SDS to a final concentration of 1%. The protein concentration of each homogenate was determined with a NanoOrange Protein quantification kit (Molecular Probes, Eugene, OR) according to the instructions of the manufacturer. We then resolved 2.5, 5.0, 10, and 20 μg of protein from each of the three homogenates on a 4–12% SDS-polyacrylamide gel under reducing conditions using the NuPage Bis-Tris electrophoresis system (Novex, Wadsworth, OH) and transferred the protein onto a polyvinylidene difluoride (PVDF) membrane (all according to the NuPage instruction booklet). The membrane was blocked in PBS containing BSA (1%) and Tween 20 (0.1%) for 1 hr. We then added rabbit RC3 antisera (1:500), which had been raised against recombinant RC3 as described previously (Gerendasy et al., 1994b). The blot was incubated overnight, washed three times for 10 min in PBS containing 0.1% Tween 20, incubated with alkaline phosphatase anti-rabbit IgG (1:1000) (Vector Laboratories, Burlingame, CA) for 1 hr, and washed five times in PBS–Tween 20. We developed the membrane with the fluorogenic phosphatase substrate dimethylacridinone phosphate (1.25 μg/ml in 10 mm Tris, pH 9.5, and 1 mm MgCl2) (Molecular Probes) and scanned it in a Storm fluorescence scanner (Molecular Dynamics, Sunnyvale, CA) in red fluorescence mode.
Phospho-CaMKII immunoreactivity and Ca2+/CaM-independent CaMKII activity in RC3 KO and WT slices. Slices from RC3 KO and WT mice were homogenized individually and split into two equal portions. One portion of each homogenate was resolved by SDS-PAGE, blotted onto PVDF membrane, and reacted with antibodies against CaMKII (Chemicon, Temecula, CA) as described above. The other half was electrophoresed, blotted, and probed with antibodies specific for phospho- (Thr286Asp) CaMKII (Promega, Madison, WI). Ca2+/CaM-independent CaMKII activity was assayed with a kit according to instructions provided by the manufacturer (Promega).
Histology
Methods for staining β-galactosidase (β-gal), Nissl, and Timm's stain were described in detail previously (McNamara et al., 1996). We performed in situ hybridization with a 1.0 kb antisense riboprobe transcribed from a murine RC3 cDNA. The specificity of this probe and a detailed in situ hybridization procedure have been described previously (Watson et al., 1990; McNamara and Lenox, 1997).
Synaptophysin staining
For immunohistochemistry, hippocampal slices were prepared the same as for electrophysiology. After 45 min, slices were fixed for 24 hr in 3.7% paraformaldehyde. Slices were then cryoprotected with increasing concentrations of sucrose in PBS (12, 16, and 20%), snap frozen, and cut into 30 μm sections. Free-floating sections were blocked in 2% normal horse serum, rinsed in PBS, and then incubated with anti-synaptophysin mouse monoclonal primary antibody (1:1000;Chemicon) at 4°C in PBS for 24 hr. Sections were again rinsed in PBS and labeled with the secondary monoclonal antibody (horse anti-mouse Texas Red, 1:300; Vector Laboratories) for 3 hr at room temperature.
Sections were analyzed by immunofluorescence on a Bio-Rad (Hercules, CA) MRC 1024 laser scanning confocal microscope, mounted on a Zeiss(Oberkochen, Germany) Axiovert TV-100 using the 63× objective. A z-stack was then made of each sample, using 1 μm steps through the entire sample. Each z-stack was captured using the same iris, gain, and black level setting. The images were then saved as tagged image file format and imported into SoftWoRx 2.5 (Applied Precision, Issaquah, WA). Using a point spread function measured on the MRC 1024, the image stacks were deconvolved using an inverse matrix algorithm. A projection was then made of each z-stack, and the integrated intensity of the entire stack was determined.
Electrophysiology
Our detailed methods have been described previously (Krucker et al., 1998, 2000) and were slightly modified. We coded RC3 KO and age-matched littermate control animals and revealed the genotype only after experiments and data analysis. Animals were anesthetized with halothane (3%) and decapitated, and their hippocampal formations were rapidly removed. We cut transverse slices of 400 μm thickness on a McIlwain brain slicer in slightly modified artificial CSF (ACSF) with MgSO4·7H2O (10 mm) and CaCl2·2H2O (0.5 mm). For experiments with “mini” slices, the CA3 region was surgically removed.
All experiments were done at 32 ± 0.2°C in a submerged-type slice chamber (flow rate, 2–4 ml/min) with ACSF (saturated with 95% O2–5% CO2) of the following composition (in mm): 130 NaCl, 3.5 KCl, 1.25 NaH2PO4, 1.5 MgSO4·7H2O, 2 CaCl2·2H2O, 24 NaHCO3, and 10 glucose. We delivered orthodromic stimuli of 0.05 msec duration through a bipolar tungsten electrode, placed in the stratum radiatum to activate the Schaffer collateral pathway. Glass microelectrodes with 1–4 MΩ resistance (containing 3m NaCl) were positioned in the stratum radiatum to record presynaptic fiber volleys (PVs), followed by population EPSPs (pEPSPs). The polarity of the stimulus current was adjusted so that the stimulus artifact would not obscure the PV. We isolated the NMDA-pEPSP by adding 6-cyano-7-nitroquinoxaline-2, 3-dione (CNQX) (10 μm) and bicuculline (20 μm) to the ACSF with 0 mMg2+. We generated input–output (I–O) curves using stimulation intensities evoking threshold, 30–50%, 50%, and maximal pEPSP amplitudes. Concomitantly to baseline recordings (≥20 min), we ran a paired-pulse protocol consisting of 20, 50, 100, and 200 msec intervals, at 30–50% of stimulus intensities that evoked maximal pEPSP amplitudes. We elicited LTP by applying two tetani of 100 pulses at 100 Hz, 20 sec apart, at the same stimulus intensity as for the baseline values. In addition, we used either 900 pulses at 0.2, 0.5, 1, or 5 Hz or 900 paired pulses (interval 50 msec) at 1 Hz to induce LTD and depotentiation. Population EPSPs were recorded with an Axoclamp-2A or -2B head stage interfaced with a personal computer and were acquired, digitized, stored, and analyzed using pClamp software (Axon Instruments, Foster City, CA). We measured pEPSP and PV amplitudes as the y-axis difference between the highest peaks and the baseline value determined 1 msec preceding the stimulation (see Fig. 2A), and we calculated the initial slopes (between the 10 and 60% points on the rising phase) of the pEPSP using least-square regression. If not indicated otherwise, LTP and LTD was determined as an average of the last 10 min of the plateau recorded.
All values are expressed as mean ± SEM. n indicates the number of slices per number of animals. We tested for statistically significant differences at each stimulation intensity and/or time point, for each I–O, LTP, LTD, and paired-pulse study, using Student's t test or the Mann–Whitney U test. We considered p < 0.05 statistically significant. Data in Figure 2E were fitted with least-square regression, and significance was tested with a t test. Significance of Pearson's correlation coefficients and slopes in Figure 4Cwere determined using a one-tailed Students' ttest.
(1S,3R)-1-Aminocyclopentane-1,3-dicarboxylic acid (ACPD), (RS)-3,5-dihydroxyphenylglycine (DHPG), CNQX, bicuculline, and APV were obtained from Tocris Cookson (Ballwin, MO) and added at known concentrations from stock solutions. All other chemicals were from Sigma (St. Louis, MO).
RESULTS
Mutant mice
The targeting construct contained lacZ in frame with the second exon of RC3 (Fig.1A). Consequently, recombinant mice express a fusion protein consisting of the first 30 residues of RC3, followed by β-gal sequence. The fusion protein does not contain the target of PKC phosphorylation (Ser36) or residues required for binding to CaM. Heterozygous F2 mice express ∼25% of the RC3 expressed by WT siblings and 50% of the RC3-β-gal fusion protein expressed by homozygous null siblings (Fig.1B). The level of RC3 expression in heterozygotes is independent of the parental origin of the WT allele (data not shown). Thus, the RC3 locus is not imprinted. Comparison of RC3 mRNA expression in a WT brain with RC3-β-gal activity in an RC3 KO brain indicates that lacZ is expressed in the same anatomical regions as RC3 (Fig. 1C). However, unlike RC3, it is not restricted to dendrites.

Creation, histology, and Western analyses of the RC3 KO mouse. A, Top, The RC3 KO construct. Exons 1–4 are numbered. The indicated PstI (P), ApaI (A), and XmaI (X) sites within exon 2 were used to create the KO construct (middle). Other restriction sites mentioned in the text are as follows: H, HindIII;S, SalI; N,NotI; B, BamHI;E, EcoRI (not drawn to scale). A neomycin expression cassette (neo) was used to select for recombinants, and a diphtheria toxin expression cassette (DT) was used to select against random insertion events. lacZ was placed in frame with RC3 so that an RC3-β-galactosidase (RC3-β-Gal) fusion protein (bottom) was expressed from the natural RC3 promoter in recombinant mice. B, Western blot showing RC3 and RC3-β-gal expression in WT, heterozygous RC3 KO, and homozygous RC3 KO mice. Twenty, 10, 5.0, and 2.5 μg of total forebrain homogenates were resolved by SDS-PAGE and blotted onto a PVDF membrane. A polyclonal antibody generated against RC3 was used to detect both native RC3 and the RC3-β-gal fusion protein. C, β-Galactosidase activity in a sagittal section from a homozygous RC3 KO mouse brain (top) and, for comparison, a dark-field view of a WT sagittal brain section that was probed in situ with RC3 antisense RNA (bottom). Nissl (D) (magnification, 4×; scale bar, 50 μm) and Timm's stain (E) (magnification, 10×; scale bar, 150 μm) of coronal sections from RC3 KO (top) and WT (bottom) mouse brains.gc, Granule cell layer; Th, thalamus;h, hilus; IP, infrapyramidal mossy fiber layer; SP, suprapyramidal mossy fiber layer.F, Comparison of Ca2+/CaM-independent CaMKII levels in WT and mutant hippocampal slices before and after LTP. CaMKII and phospho-CaMKII immunoreactivities were assayed (left), as was Ca2+/CaM-independent CaMKII activity before and 20 min after inducing LTP. Eachbar is the mean activity in five or six slices (indicated in bar graph) from three mice. G, Synaptophysin density in hippocampal area CA1 of RC3 KO and littermate controls is the same. Synaptophysin binding was determined as a z-stack of 1 μm sections throughout a 15 μm slice, and the integrated intensity of the entire stack was determined.
Homozygous brains did not exhibit any obvious pathology when stained with Nissl or Timm's stain (Fig.1D,E). We used the latter to examine possible, although unobserved, compensatory changes in mossy fiber density caused by postsynaptic deficits in the CA3 region. Homozygous KO mice did not display overt behavioral abnormalities, and N1 homozygotes were fertile.
Ablation of RC3 alters Ca2+/CaM-independent CaMKII activity
We probed Western blots of RC3 KO and WT littermate homogenates with antibodies against CaMKII or phospho-CaMKII (Fig.1F, left) and found that both mouse strains expressed the same levels of total CaMKII but that phospho-CaMKII levels were ∼50% lower in RC3 KO slices. We also assayed Ca2+/CaM-independent CaMKII activity before and 20 min after administering a high-frequency tetanus (Fig. 1F, right). Before high-frequency stimulation (HFS), CA2+/CaM-independent CaMKII activity was 43% lower in mutant slices then in WT slices (p = 0.0004). Twenty minutes after HFS, CA2+/CaM-independent CaMKII levels rose 19% in WT slices (p = 0.38) and 47% in RC3 KO slices (p = 0.036), but final levels in RC3 KO slices were still 30% lower then in WT (p = 0.12). The general trend is that Ca2+/CaM-independent CaMKII levels are lower in RC3 KO slices then in WT slices before and after stimulation, but HFS results in a larger relative increase in RC3 KO slices compared with WT.
Excitatory synapses in CA1 of RC3 KO hippocampi are depressed
We generated I–O curves of pEPSPs from hippocampal slices derived from RC3 KO and WT littermate controls. Population EPSP amplitudes were indistinguishable at stimulation intensities evoking threshold, 30–50% maximal, 50%, and maximal pEPSP amplitudes (Fig.2A,B). However, corresponding PV amplitudes were significantly larger in RC3 KO mice (Fig. 2C). For a more accurate assessment of synaptic strength, we constructed I–O curves from normalized values of the pEPSP amplitude, expressed as a percentage of the amplitude of the PV (Fig. 2A–D). The latter is proportional to the number of presynaptic afferents recruited by stimulation. Mean normalized pEPSP amplitudes for slices from littermate controls compared with slices from RC3 KO mice were 280 ± 30 versus 209 ± 22% at threshold, 343 ± 41 versus 180 ± 24% at 30–50% of maximal, 325 ± 42 versus 183 ± 26% at 50%, and 271 ± 31% versus 148 ± 18% at maximal stimulation intensities. Thus, the mean normalized pEPSP slopes and amplitudes were significantly smaller in RC3 KO mice than in age-matched littermate controls at all tested stimulation intensities (p < 0.03).

Comparison of excitatory synaptic strength and PPF in hippocampal slices of RC3 KO and age-matched littermate controls.A, Raw measures. All traces are an average of two successive pEPSPs evoked at 0.02 Hz; truncated stimulus artifacts indicated by arrowhead. Top trace shows the normalization procedure. We measured PVs (y) and pEPSP amplitudes (z) as the y-axis difference between the negative peaks and the baseline values (dotted line) determined preceding the stimulation (x). Bottom traces represent typical I–O curves in littermate control animals and RC3 KO animals.B, I–O curves for mean amplitudes of pEPSPs. Population EPSP amplitudes are similar in slices from age-matched littermate control animals and RC3 KO mice. C, Mean PV amplitudes at stimulation intensities evoking threshold, 30–50% maximal, 50%, and maximal pEPSP amplitude. D, Significantly larger mean values of the PV indicate that more fibers must be stimulated to obtain equivalent pEPSPs in RC3 KO animals. Normalization of the pEPSP amplitudes to PV size shifts the I–O curve down significantly, suggesting that synaptic transmission in RC3 KO animals is chronically depressed (*p < 0.05 indicates significant differences). E, Comparison of the correlation between PV amplitude and stimulation intensity. There was no difference between the linear regression lines (t test;p > 0.05). F, PPF of pEPSPs measured at 20, 50, 100, and 200 msec interstimulus intervals. There is no difference between slices of RC3 KO and littermate control animals. Each point is the mean ± SEM; nindicates number of slices per number of animals.
Because RC3 is a postsynaptic protein, the decreased synaptic response observed in mutant slices should be caused by a postsynaptic deficit. To confirm the locus of the phenotype in slices from RC3 KO mice, we correlated the PV amplitude to the absolute stimulation intensity and found no significant difference between the regression lines for each data set (p > 0.5) (Fig.2E). Thus, the same stimulus evokes the same PV in both mouse strains. We also examined paired-pulse facilitation (PPF) (Fig. 2F). Again, we observed no differences between mutant or WT slices at any of the interstimulus intervals, suggesting that the attenuated synaptic transmission observed in the mutant slices was attributable to a change in postsynaptic gain.
To test whether NMDA receptor responses are changed in slices from RC3 KO mice, we recorded I–O curves under normal conditions and then repeated the procedure after pharmacologically isolating the NMDA component (Fig. 3A) (see Materials and Methods). We found that AMPA/NMDA synaptic ratios were the same in slices from WT and RC3 KO mice (Fig. 3B). We further established that the I–O curve of the NMDA pEPSP shifted down significantly when normalized to the PV (p < 0.02) (Fig. 3C). Thus, the AMPA and NMDA components are equally depressed in mutant slices compared with WT.

NMDA-mediated excitability is depressed in RC3 KO mice. NMDA-mediated pEPSPs were isolated as described in Materials and Methods. A, Representative single tracesfrom pharmacologically isolated NMDA pEPSP. B, Mean NMDA–compound–pEPSP ratios in mutant slices are not different from those in WT slices. C, The I–O curve for NMDA-pEPSPs was shifted down in RC3 KO slices to the same degree as were compound-EPSPs (see Fig. 2D). The mean NMDA-pEPSP was normalized to the PV.
Reduced AMPA and NMDA components of the pEPSP in RC3 KO slices could imply reduced number of synapses. However, we found that, within CA1, synaptophysin density (Fig. 1G) was not significantly different between RC3 KO (n = 40) and littermate controls (n = 40; p > 0.5).
LTP is enhanced in RC3 KO mice
Slices from RC3 KO animals showed both larger short-term post-tetanic potentiation (PTP) and enhanced LTP for the duration of the experiment (Fig.4A). At 60 min, LTP was significantly larger in slices from RC3 KO mice (225 ± 19%) than in littermate controls (163 ± 21%; p = 0.04). Two additional tetani were required to potentiate WT slices to the same degree as mutant slices, and neither could be potentiated any further (Fig. 4B). To rule out a change in action potential threshold as a cause for the pronounced increase in LTP, we analyzed corresponding PV amplitudes. No changes in the mean PVs were observed after induction of LTP in WT or RC3 KO slices (Fig.4A, bottom).

Increased LTP in RC3 KO mice.A, Mean data. Two trains of high-frequency stimulation (100 pulses at 100 Hz) induced significantly larger post-tetanic potentiation and LTP in slices from RC3 KO animals than in slices from age-matched littermate controls. B, In slices from RC3 KO mice, LTP saturation was essentially established after the first tetanus. Although additional tetani are able to induce further potentiation, the mean pEPSP slopes were not significantly higher than after the first. In slices from littermate control animals, consecutive tetani progressively potentiated the pEPSP until reaching a similar plateau as the RC3 KO mice. C, Mean pEPSP slopes (after tetanus) and mean normalized pEPSP30–50% amplitudes (before tetanus) are inversely correlated in RC3 KO animals but not in control slices, suggesting that enhanced LTP in slices from RC3 KO mice is caused by a depressed baseline. D, LTP was induced in WT or RC3 KO slices and compared with LTP induced in WT slices after conditioning with either one or three low-frequency stimuli. After a single LFS, WT PTP (gray diamonds) was similar to RC3 KO PPT (black squares), but, by 40 min, LTP in conditioned (gray diamonds) and naı̈ve (white diamonds) WT slices was not significantly different (p > 0.2). However, three consecutive low-frequency stimuli enhanced LTP in WT slices to the point that there was no significant difference between preconditioned WT slices (gray circles) and naı̈ve RC3 KO slices (black squares;p > 0.4). Before LTP induction, a complete I–O curve was constructed, and baseline was adjusted to the new 30–50% of the maximal pEPSP.
To determine whether LTP was truly enhanced in RC3 KO slices or, alternatively, whether the change was attributable to a lower pEPSP baseline, we combined data from Figure 4A with that of all other experiments in which LTP was monitored for at least 30 min. The magnitude of LTP in RC3 KO slices was 135 ± 19% greater than in WT slices. At 30–50% maximal stimulation, the mean normalized pEPSP amplitude of RC3 KO mice was 121 ± 13% lower than for WT slices (Fig. 2D). Thus, enhancement of LTP in the RC3 KO mice is associated with the initial decrement in their baseline values, suggesting that excitatory synapses in the mutant slices start out depressed. If true, a negative correlation should be observed in RC3 KO slices when the pEPSP slope (after LTP induction) is plotted against the normalized pEPSP30–50% amplitude (before LTP induction) for each slice (Fig. 4C). In control slices, neither the correlation coefficient nor the slope of the regression line is significantly different from zero (r= 0.14; slope, 0.051; p = 0.31). However, in RC3 KO slices, the correlation coefficient and slope of the regression line are significantly different from zero, and the slope is decidedly negative (r = 0.45; slope, −0.32; p = 0.034). This indicates that the magnitude of LTP is negatively correlated with the magnitude of normalized pEPSP30–50% in RC3 KO but not control slices.
If LTP is enhanced in RC3 KO slices because synaptic transmission is initially depressed, then LTP should be augmented to the same extent in WT slices if they are first depressed with a low-frequency train. We found that LTP is enhanced to the same degree as in naı̈ve RC3 KO slices if robust LTD is first induced by three consecutive low-frequency trains but not after one low-frequency stimulation (LFS) (Fig. 4D).
Stimulation protocols that normally induce LTD generate LTP in RC3 KO mice
We attempted to induce LTD using an LFS paradigm (900 pulses at 1 Hz). This protocol induced little or no synaptic reduction in whole slice preparations from littermate controls (85 ± 15% at 60 min after LTD induction) (Fig.5A,B). In contrast, the same protocol induced a short-lasting depression, followed by a slow but significant potentiation in slices from RC3 KO animals. Slow onset potentiation in RC3 KO slices and LTD in WT slices could be blocked by APV, indicating that both are NMDA dependent (data not shown). Forty minutes after the end of the LTD induction protocol, the mean potentiation plateaued at 178 ± 39%. This LFS protocol induces long-lasting depression only in the hippocampal CA1 region of very young animals (Dudek and Bear, 1993). However, LTD can be induced in slices from adult animals (for review, see Bear and Abraham, 1996) by using slight modifications of the stimulation protocol (see Materials and Methods). Using the double-pulse protocol, we observed a slight reduction in pEPSP slopes in control slices (91 ± 3.7%) but potentiation in RC3 KO slices (115 ± 6.0%) (Fig.5A,B) after 70 min. When similar experiments were performed on mini slices, we obtained comparable results: single-pulse and double-pulse induction protocols induced depression in mini slices from littermate controls (single pulse, 99 ± 17%, p = 0.09; double pulse, 74 ± 14%, p = 0.04) but significant potentiation in those from RC3 KO mice (single pulse, 135 ± 12%, p = 0.02; double pulse, 138 ± 19%, p = 0.03). The PV remained constant for the duration of the experiment (data not shown).
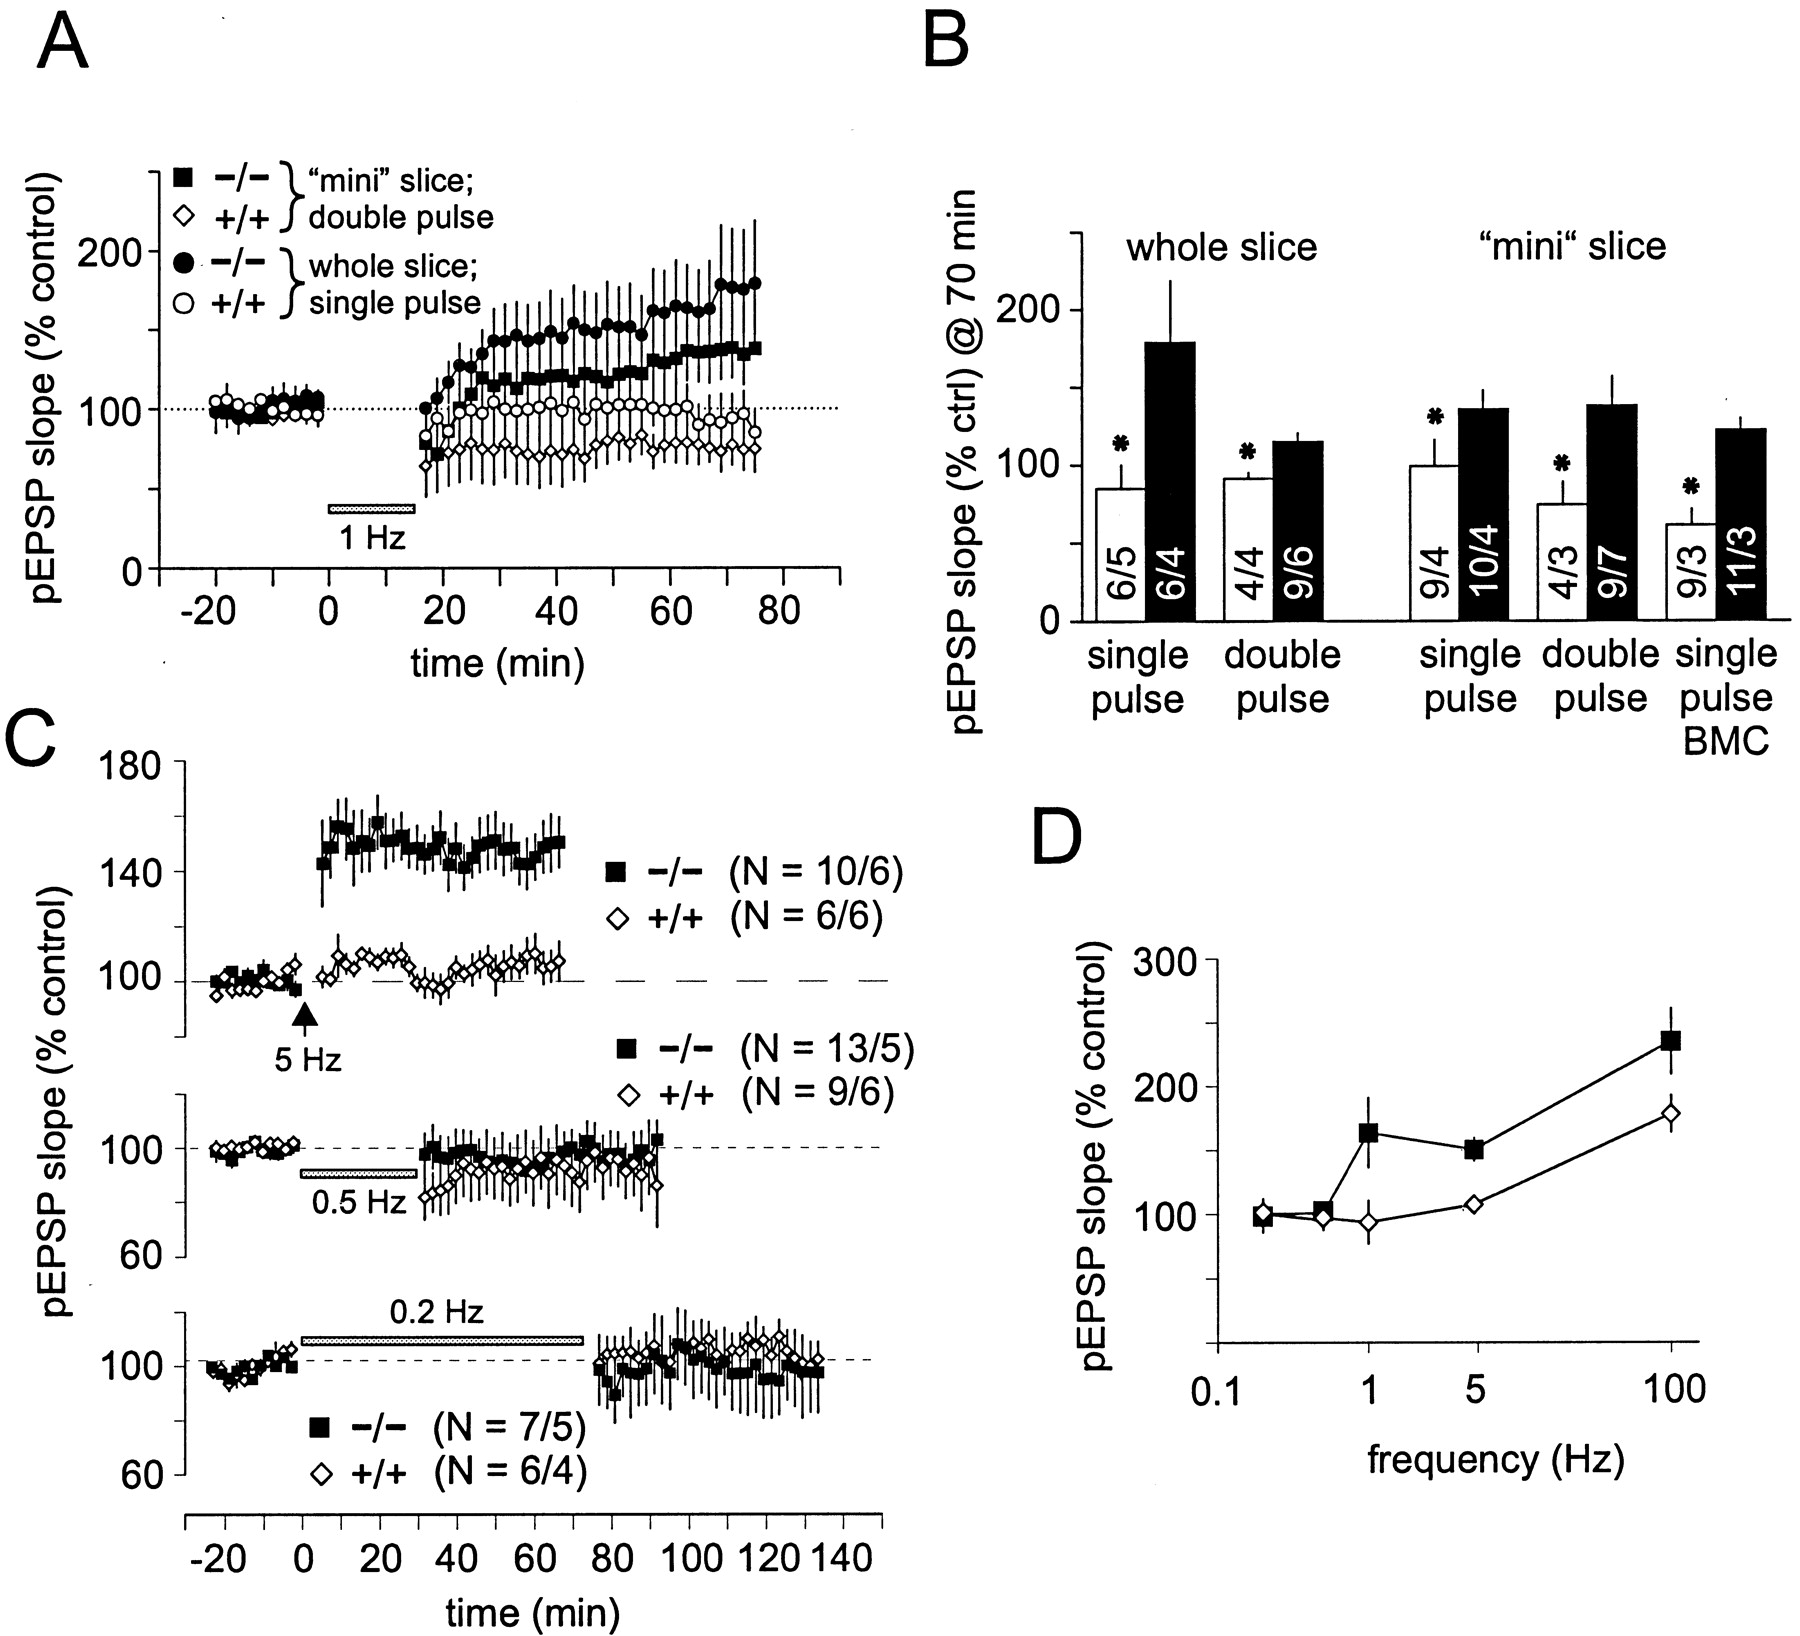
Comparison of long-term plasticity in RC3 KO mice.A, Two different low-frequency stimulation protocols (either 900 single pulses or 900 double pulses at 50 msec interval, both at 1 Hz) induced LTD in slices from littermate control animals (mean data). However, the same stimulation protocols induced slow-onset potentiation in slices from RC3 KO animals. In mini slices, CA3 was removed to reduce feedback excitation, and, in some experiments, bicuculline (BMC) was added to the bath to reduce GABAergic inhibition.B, Pooled data from all 1 Hz LTD experiments. Under all conditions tested, LFS consistently induced depression in slices from control mice but potentiation in slices from RC3 KO animals (*p ≤ 0.04 indicates statistical significance).C, Nine hundred pulses at 5 Hz induced a significant potentiation in slices from RC3 KO animals but not in slices from littermate control animals. Lower frequencies (0.5 and 0.2 Hz, 900 pulses) induced neither short-term nor long-term changes of pEPSP slopes in RC3 KO or control slices. D, Consistent with our model, the frequency–response curve of RC3 KO is shifted. However, at 0.2 and 0.5 Hz, there were no apparent changes, suggesting that RC3 KO slices were maximally depressed.
The frequency–response curve is shifted in RC3 KO mice
We also tested 0.2, 0.5, and 5 Hz stimulation frequencies (900 pulses) (Fig. 5C). In slices from WT mice, 5 Hz stimulation induced a slight but insignificant potentiation (107.3 ± 7.34%). However, in mutant slices, 5 Hz stimulation potentiated the mean pEPSP significantly, plateauing at ∼150% (p = 0.0002) (Fig. 5C,D). Neither 0.2 nor 0.5 Hz significantly altered mean pEPSP amplitude in WT or mutant slices (p > 0.22) (Fig. 5C). We could not find a frequency that induced LTD in RC3 KO mice (Fig. 5D), perhaps because the mutant slices were already maximally depressed.
High-frequency priming permits depotentiation below baseline in the RC3 KO mouse
LTP is easily reversed in older animals, suggesting that such depotentiation does not use the same biochemical pathway(s) as LTD (Wagner and Alger, 1996; Holland and Wagner, 1998; Zhuo et al., 1999) We tested the integrity of the depotentiation pathway in RC3 KO mice by inducing LTP (two tetani of 100 pulses at 100 Hz, 20 sec apart) and then applying an LFS of 900 single pulses at 1 Hz (Fig.6A). The magnitude of LTP in control slices was ∼200% of baseline. Subsequent LFS decreased the slope of the mean pEPSPs ∼120% (not significantly different from baseline; p = 0.97). Surprisingly, depotentiation resulted in mean pEPSP slopes that were significantly lower than baseline (p = 0.017) in slices from RC3 KO mice. High-frequency priming resulted in LTP that plateaued at ∼250%, and subsequent LFS reduced pEPSP slopes to ∼50% of baseline values. Thus, RC3 does not appear to be required for depotentiation. However, maximum depotentiation required multiple low-frequency stimuli in WT slices, whereas one stimulus was sufficient in mutant slices (Fig. 6B). After depotentiation, one additional 1 Hz train induced further depression in WT slices and slow onset potentiation in RC3 KO slices, bringing the pEPSP slopes in both strains back to baseline (Fig. 6C). A subsequent HFS again induced more robust LTP (∼180%) in mutant compared with WT slices (∼145%; p = 0.006).

Depotentiation and saturation of pEPSP slopes after repeated LFS with and without priming. A, Depotentiation is much larger in RC3 KO animals than in control animals. Twenty-two minutes after a priming stimulus (2 trains of 100 pulses at 100 Hz), we induced depotentiation with 900 stimuli at 1 Hz. In WT mice, pEPSP slope values return to control levels (before LTP), whereas RC3 KO animals were depotentiated much more so (50%) and stayed significantly depressed for over 60 min. Parallel analysis of the PVs (bottom) did not show any changes.B, After high-frequency priming, five consecutive low-frequency tetani (900 pulses at 1 Hz) were needed to saturate depotentiation in slices from WT animals (50% of baseline, similar to depotentiation after 4 sets of LFS without priming) (see Fig. 5D).C, Even after two low-frequency tetani, depotentiated slices from RC3 KO slices still expressed a higher LTP magnitude. Whereas a second LFS induced a slight potentiation in slices from RC3 KO animals, mean pEPSPs in WT slices were further depotentiated. A consecutive HFS induced pronounced LTP in both. After 40 min, LTP magnitude was significantly higher in slices from RC3 KO compared with WT (p = 0.006). D, In slices from RC3 KO animals, consecutive tetani of LFS caused increasing degrees of slow-onset LTP (plateaus at 140–150% of control). The same LFS induced increasingly robust LTD in slices from littermate control animals. E, Superfusion of the NMDA receptor antagonist APV during the priming stimulus inhibited initial potentiation. However, in slices from both RC3 KO and control animals, a subsequent LFS (without APV) depotentiated the slices to the same extent as inA. There were no changes in the PV (bottom).
We next determined whether RC3 KO slices that had been potentiated with a low-frequency train could then be depotentiated by a subsequent LFS (Fig. 6D). We found that consecutive applications of LFS caused increasing degrees of slow-onset LTP that was saturated at 137 ± 16% of baseline, whereas similar treatment of control slices caused LTD that was saturated at 63 ± 11% (both are means of the last 10 data points).
A significant priming effect was observed in mutant slices but not in WT slices when the NMDA receptor antagonist APV was present during high-frequency priming tetanus and then washed out before LFS (Fig.6E). A high-frequency stimulus in the presence of APV caused slight potentiation in control slices (110 ± 4%;p = 0.007) and no significant potentiation in RC3 KO slices (105 ± 3%; p = 0.18). No significant depotentiation was observed in control slices when APV was washed out and a single low-frequency train was applied (96 ± 3.6%;p = 0.52). However, similar treatment of mutant slices resulted in pronounced depotentiation (57 ± 16%;p ≤ 0.001) that was not significantly different from the depotentiation observed when APV was not included during high-frequency priming (p = 0.36). Thus, priming in the RC3 KO slice requires neither potentiation nor Ca2+ influx through NMDA receptors. This experiment also confirms that the stimulation protocols used here induce an NMDA-dependent form of LTP.
Reduced sensitivity to mGluR agonists in RC3 KO mice
To determine whether a group 1 mGluR-mediated pathway is involved, we recorded baseline levels for 20 min at stimulation intensities that evoked 30–50% of maximal pEPSPs and then superfused the slices with the broad-spectrum mGluR agonist ACPD (100 μm) or the group 1-specific mGluR agonist DHPG (100 μm). Both agonists reduced synaptic transmission in WT slices. The effects of ACPD were partially occluded in RC3 KO slices. Initially, the difference in pEPSP was significant (p ≤ 0.04); however, the difference disappeared after the 10 min application (p > 0.15) (Fig.7A). DHPG caused a significant and persistent reduction in WT pEPSPs that plateaued at 60% of baseline versus control (p < 0.0001) after 10 min (Fig. 7B). However, in mutant slices, the reduction was insignificant (85% after 60 min; p > 0.17). The difference between the KO and the WT was also highly significant (p < 0.0008). Thus, the effects of DHPG were almost completely occluded in mutant slices.

Slices from RC3 KO mice are less sensitive to group 1 mGluR agonists. A, Although 100 μmACPD for 20 min initially reduced the mean pEPSP in slices from RC3 KO mice less than in slices from WTs, after 20 min, the differences were not statistically significant. A full recovery was established after 40 min of washout. B, DHPG, the group 1-specific mGluR agonist, induced a significantly larger and nonreversible reduction of mean pEPSPs in slices from WT animals compared with those from RC3 KOs. The slight but insignificant reduction compared with baseline suggests that mGluR5 maybe involved in mediating the phosphorylation of RC3.
DISCUSSION
We showed that LTP was enhanced in RC3 KO slices, in part because neurotransmission was depressed. LFS failed to induce additional depression, suggesting that the initial state of synaptic transmission is qualitatively similar to LTD. Nevertheless, mutant slices could be depotentiated with LFS if LTP was induced first. Depotentiation was much more robust in mutant than in control slices and could be induced even if the induction of LTP was prevented with APV. Thus, we believe that ablation of RC3 constitutively activates the biochemical pathways associated with LTD and accentuates those associated with depotentiation.
The locus of the RC3 KO phenotype
PV amplitudes and PPF were not significantly different in mutant slices compared with controls, and PV amplitudes remained steady in both RC3 KO and WT slices during activity-dependent changes in neurotransmission. Thus, changes in fiber excitability are not responsible for the mutant phenotype. NMDA and non-NMDA receptor-mediated synaptic components were equally depressed in mutant slices, arguing against a larger fraction of silent synapses in RC3 KO slices attributable to a selective downregulation of AMPA receptors (Liao et al., 1995). Equal depression of the NMDA and non-NMDA receptor components would be compatible with smaller numbers of synapses in the mutant, yet comparison of synaptophysin-immunoreactive puncta in WT and RC3 KO slices does not reveal significant differences in density. Also, the magnitudes of the pEPSPs over a broad range of stimulation intensities were indistinguishable in mutant and WT slices, and LTP was enhanced rather than diminished in RC3 KO slices. These observations indicate a change in synaptic quality rather than quantity. Thus, depressed synaptic transmission in mutant slices is probably caused by postsynaptic changes at individual synapses, and, based on the nature of the mutation, is most likely attributable to a greater availability of postsynaptic CaM.

A model of the postulated mechanism governing metaplasticity in the CA1 region of the mouse hippocampus.Top, A sliding threshold model of metaplasticity in the hippocampus. The phosphorylation states of RC3 and CaMKII determine the LTD threshold (θ−), the LTP threshold (θ+), and the ceiling at which LTP is saturated. NMDA receptor-mediated events predominate during HFS, causing dephosphorylation of RC3 and phosphorylation of CaMKII, thereby shifting θ− and θ+ to the right. Type I mGluR-mediated events predominate during LFS, leading to phosphorylation of RC3 and dephosphorylation CaMKII, shifting θ− and θ+ to the left. LTP is saturated when RC3 is minimally and CaMKII maximally phosphorylated, placing θ+ at its rightmost limit. When RC3 is maximally phosphorylated and CaMKII minimally so, θ− and θ+ are situated to the far left, and LTD is induced by small levels of basal activity. Bottom, Circuit diagram of pathways governing CaM availability, the frequency–response threshold, and metaplasticity. Blue arrows denote pathways involved in the induction of LTP (high Ca2+). Red arrows denote pathways involved in LTD (medium Ca2+), and green arrows signify steady-state conditions in the resting synapse. Based on mechanistic insights gleaned from in vitroobservations concerning the dissociation kinetics of RC3 and CaM, we mapped a hypothetical network of commonly accepted biochemical pathways that could explain various metaplastic phenomena. Unphosphorylated RC3 acts as a CaM sink when Ca2+ levels are low (green arrows), releases CaM slowly during medium Ca2+ fluxes (red arrows), and releases Ca2+ rapidly during large NMDA-dependent Ca2+ fluxes (blue arrows). In the latter instance, both high- and low-affinity CaM-binding enzymes are activated. High-affinity enzymes include the Ca2+/CaM-dependent phosphatase calcineurin (PP2B) and the CaM-dependent phosphodiesterase (PDE). Low-affinity enzymes comprise CaMKII and adenylyl cyclase (AC). When high levels of Ca2+ are present and CaM is freely available, cAMP is synthesized by adenylyl cyclase faster than it can be hydrolyzed by PDE, resulting in the activation of PKA. Inhibitor 1 (I1) is phosphorylated by PKA faster than it isdephosphorylated by PP2B, resulting in the inhibition of protein phosphatase 1 (PP1). Thus, the accumulation of phosphorylated CaMKII and the activation of PKA are favored, resulting in LTP. As CaM is sequestered by phospho-CaMKII, activation of the high-affinity binders becomes favored over the low-affinity binders, placing an upper limit on LTP. The activities of high-affinity binders are also favored during smaller Ca2+ fluxes (red arrows). In this case, PDE hydrolyzes cAMP faster than adenylyl cyclase creates it, decreasing the rate of inhibitor 1 phosphorylation by PKA. This, along with increased PP2B activity, decreases the phosphorylation state of inhibitor 1, which disinhibits protein phosphatase 1, decreases the phosphorylation state of CaMKII, and results in LTD. When Ca2+ levels are very low, neither low-affinity nor high-affinity binders are favored, and the final equilibrium concentrations of phosphorylated and dephosphorylated CaMKII at resting Ca2+ levels will depend on the CaM-buffering capacity of RC3. Thus, the phosphorylation state of RC3 would determine the degree of potentiation or depotentiation in the resting synapse by setting baseline levels of phospho-CaMKII and PKA activities. The amount of available CaM, which is governed by the phosphorylation states of both RC3 and CaMKII, would determine the kinetics, direction, and magnitude of synaptic responses to subsequent Ca2+ fluxes. The dotted green linesemphasize the notion that significant CaMKII and PKA activities exist in the resting synapse. Phosphorylation of RC3 increases sensitivity to Ca2+ such that the red pathwaysbecome more dominant at basal Ca2+ concentrations and the blue pathways become favored at medium Ca2+ concentrations. Thus, ablation or phosphorylation of RC3 would shift the resting synapse into a state of LTD and displace θ+ to the left. At modest levels of Ca2+, RC3 and CaM dissociate rather slowly, so we would expect RC3 to constrain the speed and magnitude of CaM-dependent reactions. Thus, ablation or phosphorylation of RC3 would tend to amplify Ca2+/CaM-induced shifts in θ+.
Depressed synaptic pEPSPs are correlated with lower Ca2+/CaM-independent CaMKII activity
Synaptic transmission is not depressed when the phosphorylation site of αCaMKII (Thr286) is knocked out (Giese et al., 1998), suggesting that lower levels of phospho-CaMKII are not necessarily correlated with the depressed synaptic transmission observed in the RC3 KO mice. However, αCaMKII is expressed presynaptically and postsynaptically, and the phenotype of the αCaMKII KO created by Silva et al. (1992) indicates that these knock-outs have large presynaptic deficits. Phosphorylation of presynaptic CaMKII has been implicated in the induction of LTD, so these two mouse strains may not be good model systems to study the role of postsynaptic CaMKII in the depression of synaptic transmission. The observation that pharmacological inhibition of CaMKII facilitates DHPG-induced LTD maybe more relevant to this study because DHPG increases the phosphorylation state of RC3 (Schnabel et al., 1999). Thus, we would argue that lower levels of Ca2+/CaM-independent CaMKII are responsible for depressed basal synaptic transmission in the RC3 KO.
Lower steady-state levels of Ca2+/CaM-independent CaMKII activity and concomitant depression of basal synaptic transmission in RC3 KO mice could be attributable to increased activities of phosphatase2B (PP2B) and of Ca2+/CaM-dependent phosphodiesterase (PDE) caused by increased availability of CaM (Fig.8, bottom). Like us, Pak et al. (2000) observed decreased levels of Ca2+/CaM-independent CaMKII in their RC3 KO mouse, but they concluded that basal synaptic transmission was unchanged. Nevertheless, their data suggest that larger stimulation intensities were necessary to saturate mean pEPSP slope measurements in their KO mouse compared with WT, and WT slices apparently reached the maximum pEPSP slope at approximately half the stimulation intensity necessary for KO slices. Thus, basal excitatory neurotransmission seems to be depressed in their mouse as well. Also, LTP appears to be saturated in their mutant slices but not in WT slices, suggesting that a “ceiling effect” may have obscured enhanced LTP in their RC3 KO slices.
A CaM-based mechanism for setting the frequency–response threshold
Together with published reports on the CaMKII (Thr286Asp) transgenic mouse (Mayford et al., 1995), our results suggest a postsynaptic, CaM-based sliding threshold mechanism for metaplasticity that is regulated by changes in sensitivity to Ca2+ (Fig. 8). When CaM is freely available, as in the RC3 KO mouse, sensitivity to Ca2+ increases to the point at which basal levels of Ca2+ induce LTD, and Ca2+ levels that would normally induce LTD instead cause LTP. Thus, θ− and θ+ are both displaced to the extreme left (Fig. 8, top). When CaM is restricted, as in the CaMKII (Thr286Asp) transgenic mouse, decreased sensitivity to Ca2+ shifts θ+ to the right. Therefore, we propose that the phosphorylation states of RC3 and CaMKII determine the LTD and LTP thresholds. If so, steady-state levels of phospho-RC3 and phospho-CaMKII should be inversely related, and we would predict lower levels of phospho-CaMKII in RC3 KO slices. Our results and those of Pak et al. (2000) support such a reciprocal relationship.
Depotentiation in RC3 KO slices can also be explained in terms of this sliding threshold mechanism. We found that HFS followed by low-frequency trains caused substantial depotentiation in RC3 KO slices and only modest depotentiation in WT slices. Furthermore, maximum depotentiation required only one LFS in mutant slices and multiple stimuli in WT slices. Thus, we postulate that increased sensitivity to Ca2+ facilitates the movement of θ+ to the right in RC3 KO mutant slices.
The experiment shown in Figure 6C suggests that HFS displaces θ+ to the right in mutant slices so that a subsequent low-frequency train causes greater depotentiation than in WT slices. Simultaneously, that same low-frequency train primes the slice, shifting θ+ back to the left so that the subsequent LFS potentiates the slice. Because θ+ has reached its leftward limit, it is not affected by the second LFS, and a subsequent HFS causes greater potentiation in mutant slices compared with WT. Thus, increased sensitivity to Ca2+ in RC3 KO slices facilitates movement of θ+ in either direction. The magnitude of LTP in WT slices can be raised to that of mutant slices by previous administration of multiple low-frequency trains (Fig. 4D). Thus, θ+ can be shifted to the far left in WT slices as well, except that multiple low-frequency trains are required as opposed to a single LFS. This observation also suggests that the basal state of mutant slices can be reproduced in WT slices by inducing robust LTD, supporting the notion that the initially depressed state of RC3 KO slices is qualitatively similar to LTD.
We were also able to induce significant depression in mutant slices but not WT slices after priming with HFS in the presence of APV (Fig.6E). This suggests that a relatively large influx of Ca2+ through the NMDA receptor is required to shift θ+ to the right when CaM is buffered by RC3, but a small rise is sufficient when CaM is not buffered. Thus, the disruption of RC3 facilitates activity-dependent shifts in θ+.
This study provides compelling evidence that RC3 is a central component of an mGluR-dependent, CaM-based sliding threshold mechanism for metaplasticity.
Footnotes
This work was supported by Novartis Grant SFP1183 (T.K.) and National Institutes of Health Grants MH44346 and MH47680 (G.R.S), GM32355 (J.G.S), and NS35831 (D.D.G). We are grateful to Dr. John Polich for statistical advice and Brian Smith for technical assistance with confocal microscopy and quantitative analyses of synaptophysin staining.
Correspondence should be addressed to J. Gregor Sutcliffe, Department of Molecular Biology, The Scripps Research Institute, 10550 North Torrey Pines Road, La Jolla, CA 92037. E-mail: gregor{at}scripps.edu.


