

Article Figures & Data
Figures
- Fig. 1.
Visualization of RGC projection to the tectum in living zebrafish by nAChRβ3 promoter-driven EGFP transgene. A, Structures of the zebrafishnAChRβ3 gene (top) and nAChRβ3 promoter-driven EGFP expression vector (bottom).Filled boxes indicate putative exons of the zebrafishnAChRβ3 gene. The EGFP expression vector consists of the 3.8 kb 5′ upstream sequence of the zebrafishnAChRβ3 gene, the 0.7 kb EGFP coding sequence, and the 0.7 kb 3′ downstream sequence of the zebrafish nAChRβ3gene. B, BamHI; H,HindIII; N, NotI;S, SpeI; X,XbaI. B, Fluorescent signals in a transgenic zebrafish embryo at 72 hpf. Strong EGFP expression signals were found in RGCs in the retina (arrowhead), RGC axon terminals in the tectum (arrow), trigeminal ganglion cells (tg), and Rohon-Beard neurons (rb).C, Bright-field view of the transgenic zebrafish embryo at 72 hpf shown in B. Scale bar, 0.5 mm.
- Fig. 2.
Development of the zebrafish retinotectal projection in vivo. EGFP expression signals in RGCs of transgenic zebrafish embryos were followed at various developmental stages by confocal laser scanning microscopy.e, Eye; h, hypophysis; tg, trigeminal ganglion cells; y, yolk; t, tectum. Scale bars: A–F, 100 μm; D,inset, 30 μm; G–J, 50 μm. A, B, Lateral (A) and frontal (B) views of the head of an embryo at 30 hpf. EGFP signals were detected at the ventral retina (arrowheads). C, D, Lateral (C) and frontal (D) views of the head of an embryo at 36 hpf. D,Inset, RGC axons crossing optic chiasm. E, F, Lateral (E) and frontal (F) views of the head of an embryo at 48 hpf.G–L, Lateral views of the tectum of an embryo at 54 (G), 60 (H), 76 (I), 84 (J), 100 (K), and 124 (L) hpf.Dashed lines indicate the area of the tectal neuropil, and asterisks indicate the pretectal arborization field of RGC axons. Arrows point to the rostrolateral margin in which RGC axons entered the tectum. G,Inset, Lateral view of the head of the embryo at 54 hpf.r, Rostral; l, lateral; c, caudal; m, medial. Arrowhead inL indicates the axonal bundle in the tectum.
- Fig. 3.
Analysis of single RGC axon arborization in the tectum. A, Structures of the nAChRβ3promoter-driven EGFP expression vector (top) and double-cassette expression vector of dnGSK-3β and EGFP (bottom). pA, Polyadenylation signal. B, Axon terminal arborization of a single RGC in the caudomedial tectum of a Par–EGFP-injected embryo at 76 hpf. Arrow indicates the direction of axonal extension. Dashed line indicates the area of the tectal neuropil. r, Rostral; l, lateral;c, caudal; m, medial. Scale bar, 20 μm.C, Magnification of the RGC axon terminal inB. Varicosities (open arrowheads) and filopodia (filled arrowheads) were visible. Scale bar, 5 μm. D, Quantification of arbor morphology.Dashed line shows the arbor area defined by convex polygon made by connecting the first branch point with the tips of branches. The branch length is obtained by measuring the length of all branches within the arbor area. The number of branch tips with branch length >2 μm is counted in the arbor area.
- Fig. 4.
Representative images of RGC axon terminals of the Par–EGFP-injected control and Par–dnGSK-3β–EGFP-injected embryos at 76, 84, and 100 hpf. Axon terminals of respective RGCs were observed consecutively by confocal laser scanning microscopy. Dashed lines show the arbor area. Arrows indicate the parent axon of each arbor. Scale bar, 10 μm.
- Fig. 5.
Effect of the dominant-negative form of GSK-3β on the development of RGC axon terminals in the tectum. The branch length, arbor area, and number of branch tips of Par–EGFP-injected control (open symbols;n = 29) and Par–dnGSK-3β–EGFP-injected (filled symbols; n = 30) embryos were measured consecutively at 76, 84, and 100 hpf. *p < 0.05; **p < 0.01; t test.A, Branch length. B, Increase of branch length from 76 to 100 hpf. C, Arbor area.D, Increase of arbor area. E, Branch tip number. F, Increase of branch tip number.
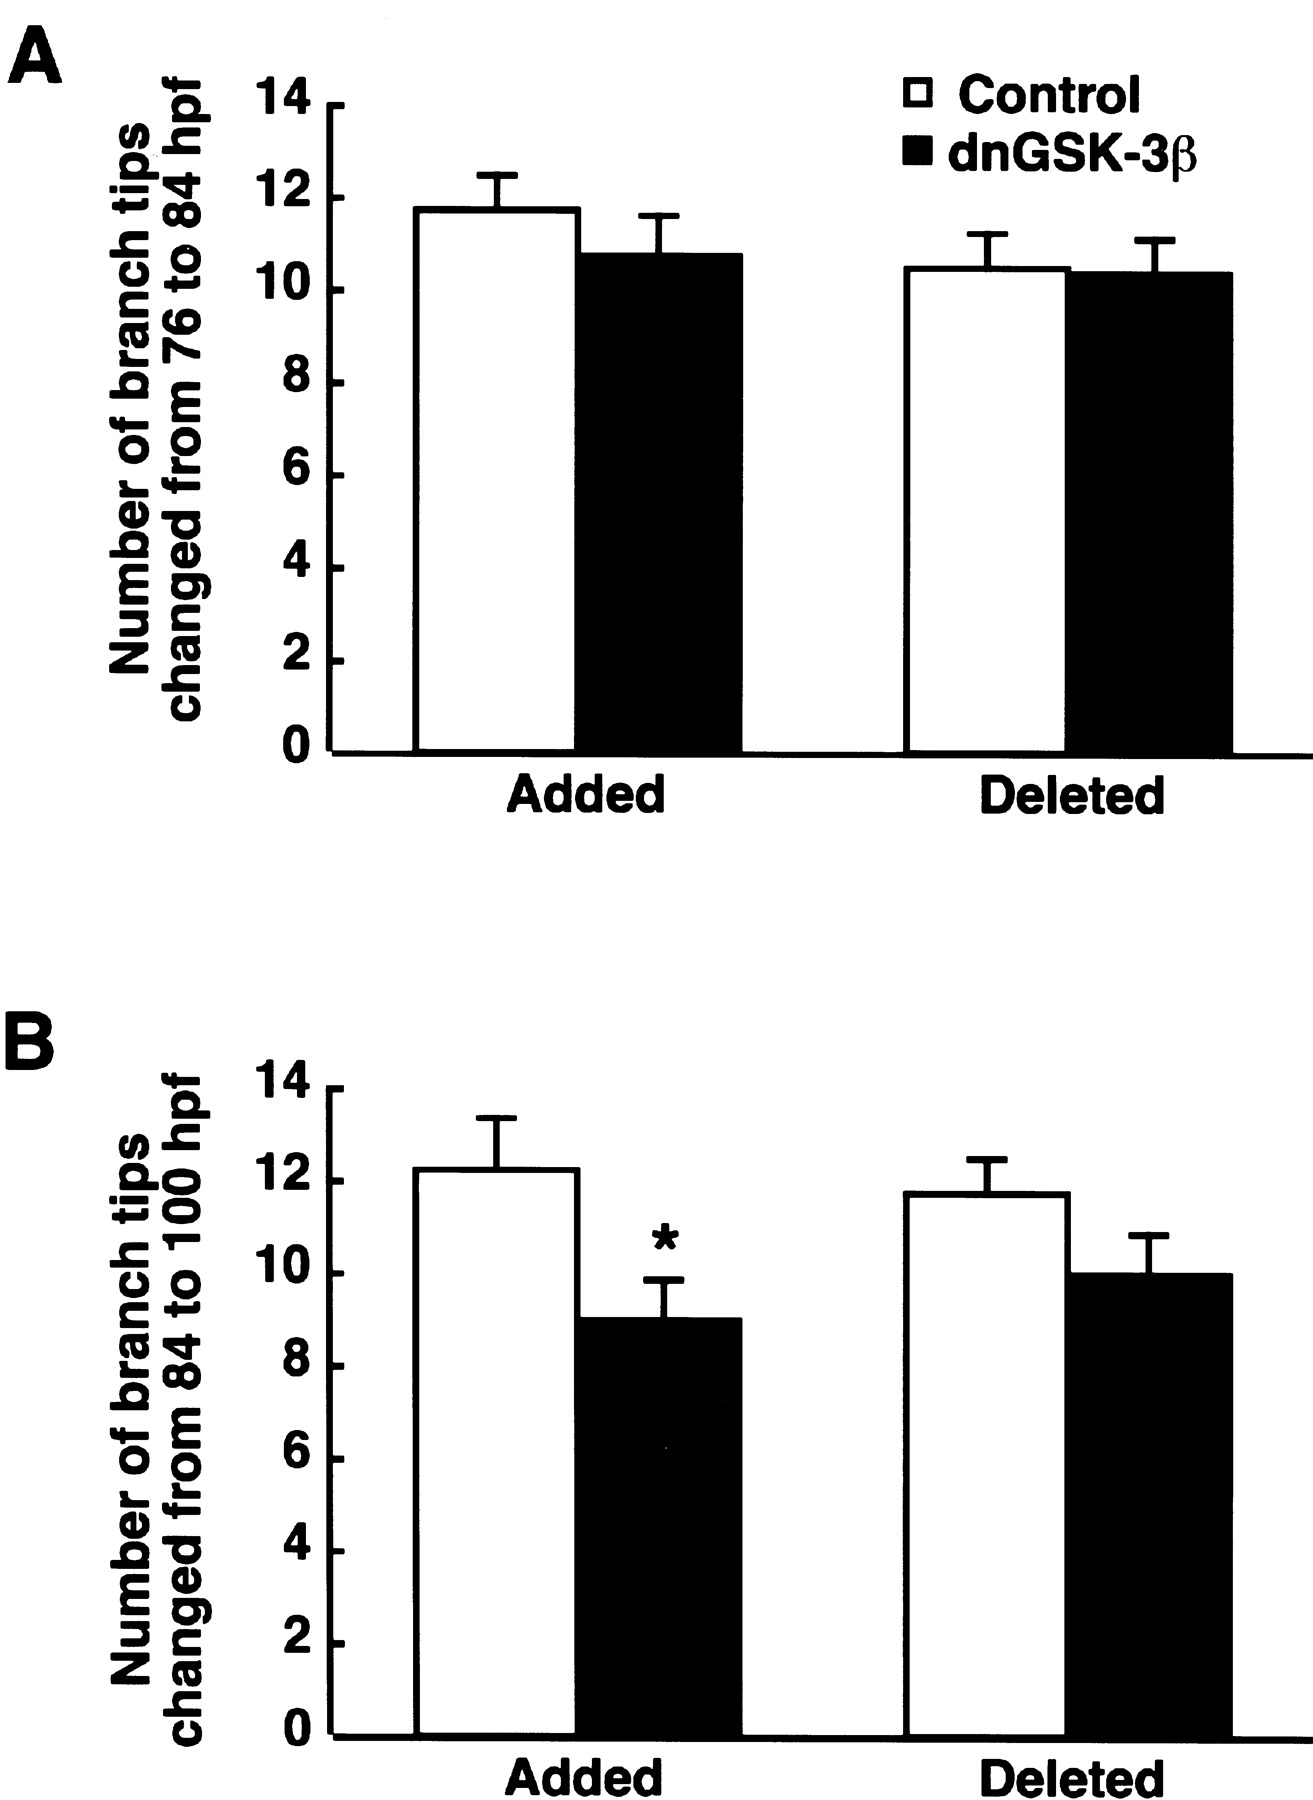
- Fig. 6.
Effect of the dominant-negative form of GSK-3β on the dynamics of RGC axon terminal branches. A,B, The numbers of branch tips added and deleted from 76 to 84 hpf (A) and from 84 to 100 hpf (B) in Par–EGFP-injected control (n = 29) and Par–dnGSK-3β–EGFP-injected (n = 30) embryos. *p < 0.05; t test.
- Fig. 7.
Effect of the dominant-negative form of GSK-3β on the development of VAMP2–EGFP puncta in RGC axon terminals.A, Vectors used for the expression of VAMP2–EGFP and dnGSK-3β. pA, Polyadenylation signalB, D, Representative VAMP2–EGFP expression signals in the RGC axon terminals of Par–VAMP2–EGFP-injected control (B) and Par–dnGSK-3β–VAMP2–EGFP-injected (D) embryos at 76 hpf. C,E, The threshold images of VAMP2–EGFP signals inB and D for evaluation of VAMP2–EGFP puncta. Scale bar, 10 μm. F, The size of VAMP2–EGFP puncta in RGC axon terminals of Par–VAMP2–EGFP-injected control (n = 74, 16 embryos at 76 hpf;n = 216, 18 embryos at 84 hpf;n = 508, 23 embryos at 100 hpf) and Par–dnGSK-3β–VAMP2–EGFP-injected (n = 85, 12 embryos at 76 hpf;n = 354, 25 embryos at 84 hpf;n = 242, 15 embryos at 100 hpf) embryos. *p < 0.05; t test.G, The number of VAMP2–EGFP puncta in RGC axon terminals of Par–VAMP2–EGFP-injected control (n = 16 at 76 hpf; n = 18 at 84 hpf; n = 23 at 100 hpf) and Par–dnGSK-3β–VAMP2–EGFP-injected (n = 12 at 76 hpf; n = 25 at 84 hpf; n = 15 at 100 hpf) embryos.
- Fig. 8.
Colocalization of VAMP2–ECFP and Bassoon–EYFP in RGC axon terminals. Zebrafish embryos were coinjected with Par–Bassoon–EYFP and Par–VAMP2–ECFP. VAMP2–ECFP and Bassoon–EYFP signals in a single RGC axon terminal at 96 hpf were visualized with a HeCd laser (left) and an Ar laser (middle), respectively. These images are merged on the right. Scale bar, 10 μm.


