

Article Figures & Data
Figures
- Fig. 1.
Separation of radiolabeled choline and ACh by reverse-phase HPLC followed by liquid scintillation spectrometry.A, Standards. The radiochromatogram shown here was obtained after injection of a solution (100 μl) that contained 11,590 dpm [3H]choline and 24,850 dpm [14C]ACh. When the two radiolabeled compounds were injected alone, the retention times were similar to those observed in the coinjection experiments (data not shown). B, Representative radiochromatogram showing KCl-dependent [3H]choline and [3H]ACh release from striatal slices from WT mice. Superfused striatal slices prepared from M4 receptor WT mice were prelabeled with [3H]choline and stimulated with KCl as described in Materials and Methods. The superfusion medium contained 100 μm physostigmine. The depicted radiochromatogram was obtained after injection of 100 μl of the fraction (fraction 5) collected immediately after K+ stimulation (total [3H] content of the 100 μl aliquot: 3223 dpm). Note that >90% of the [3H] outflow represents authentic [3H]ACh.
- Fig. 2.
Effect of oxotremorine on potassium-stimulated [3H]ACh release in hippocampal slices from M2–M4 receptor double KO, M2receptor single KO, and M4 receptor single KO mice (A–C, bottom panels) and their corresponding WT control mice (A–C, top panels). Each bar represents the mean ± SEM of S2/S1 values from 6–11 independent experiments (mice). Concentrations shown are micromolar. Asterisks indicate significant differences from the control group (no drug) (*p < 0.05; **p < 0.01).
- Fig. 3.
Effect of oxotremorine on potassium-stimulated [3H]ACh release in cortical slices from M2–M4 receptor double KO, M2receptor single KO, and M4 receptor single KO mice (A–C, bottom panels) and their corresponding WT control mice (A–C, top panels). Each bar represents the mean ± SEM of S2/S1 values from 6–11 independent experiments (mice). Concentrations shown are micromolar. Asterisks indicate significant differences from the control group (no drug) (*p < 0.05; **p < 0.01).
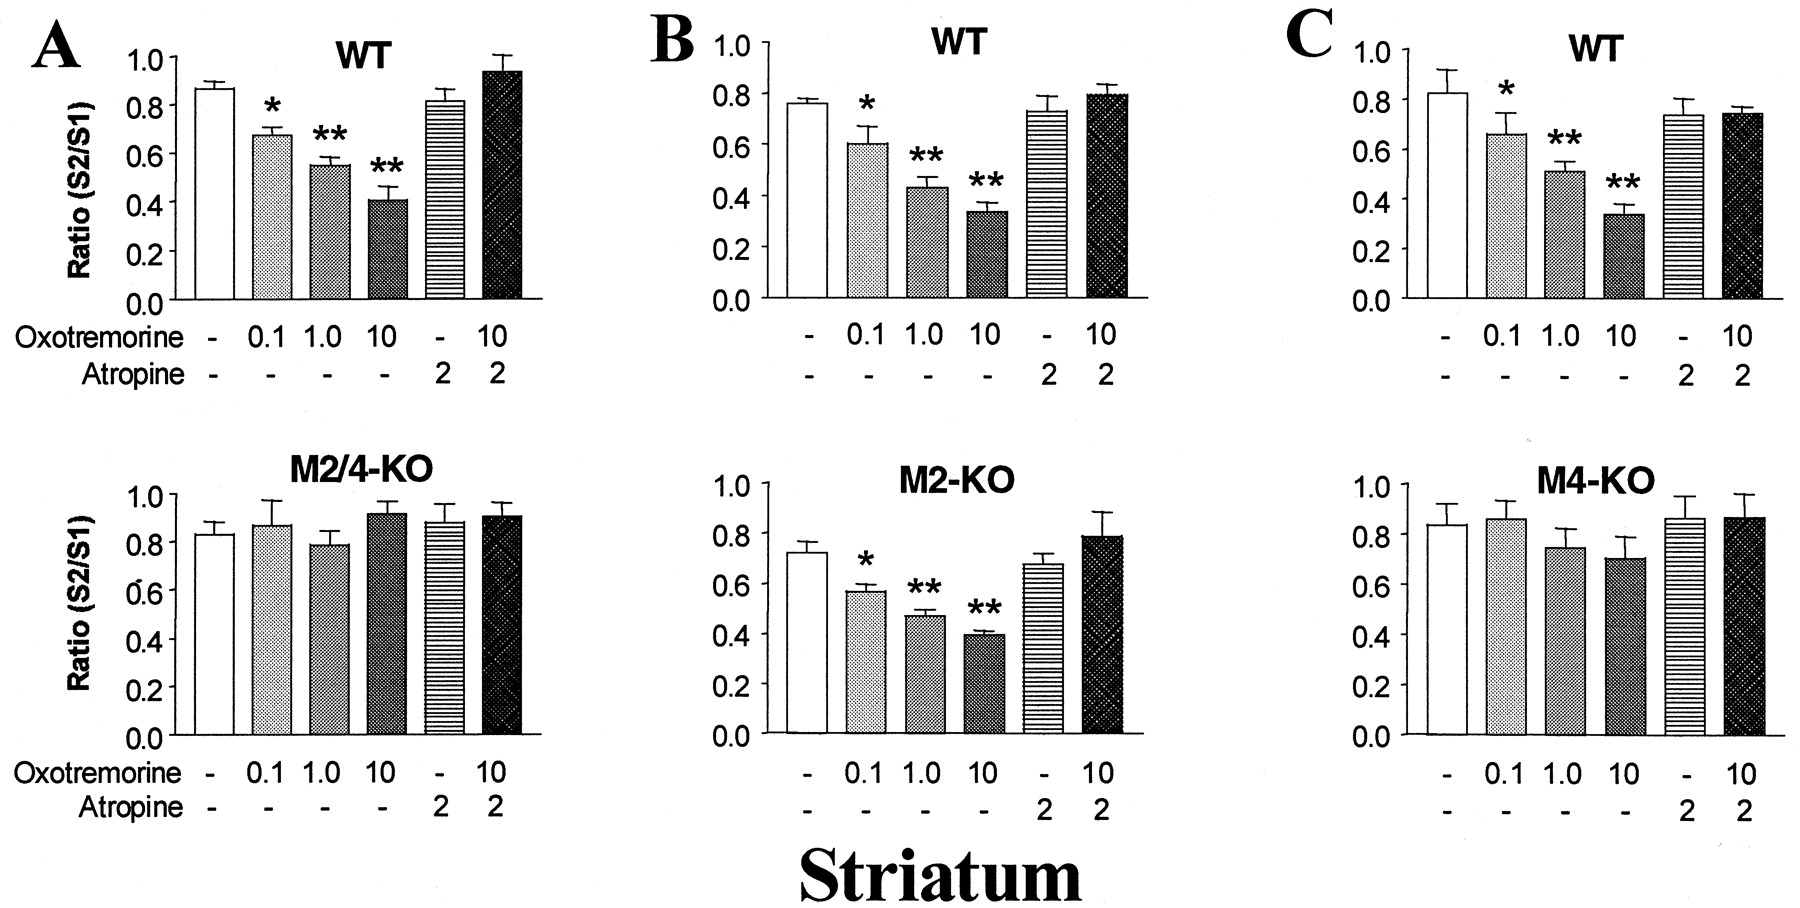
- Fig. 4.
Effect of oxotremorine on potassium-stimulated [3H]ACh release in striatal slices from M2–M4 receptor double KO, M2receptor single KO, and M4 receptor single KO mice (A–C, bottom panels) and their corresponding WT control mice (A–C, top panels). Each bar represents the mean ± SEM of S2/S1 values from 6–11 independent experiments (mice). Concentrations shown are micromolar. Asterisks indicate significant differences from the control group (no drug) (*p < 0.05; **p < 0.01).
- Fig. 5.
Expression of M2 muscarinic receptors in cholinergic terminals in the striatum of M4 receptor WT and M4 receptor KO mice. Striatal slices (∼50-mm-thick) were prepared from M4 receptor WT or M4receptor KO mice, and the M2 muscarinic receptor and the VAChT were visualized via confocal immunofluorescence microscopy (see Materials and Methods for details). M2 receptors (green) colocalize with VAChT (red) in some cholinergic terminals in both M4 receptor WT and KO mice. Colocalization is visualized asyellow in the merged images (arrows). Scale bars, 2 μm.
- Fig. 6.
Localization of M4 muscarinic receptors to cholinergic terminals in mouse striatum. Striatal slices (∼50-mm-thick) were prepared from M4 receptor WT mice, and the M4 muscarinic receptor and the VAChT were visualized via confocal immunofluorescence microscopy (see Materials and Methods for details). M4 receptors (green) colocalize with VAChT (red) in some cholinergic terminals. Colocalization is visualized as yellow in the merged images (arrows). Scale bar, 2 μm.


Tables
- Table 1.
Basal and potassium-evoked release of [3H]choline and [3H]ACh in hippocampal, cortical, and striatal slices from WT mice prelabeled with [3H]choline, as determined by reverse-phase HPLC
[3H]Choline [3H]ACh % [3H]ACh (of total [3H]) Disintegrations per minute/preparation Hippocampus Basal release1-a 957 ± 60 1119 ± 48 52.9 ± 2.1 Release after K+stimulation1-b 1092 ± 56 2516 ± 109 69.7 ± 1.1 Net increase in release after K+stimulation1-c 180 ± 27 1442 ± 104 88.9 ± 1.5 Cortex Basal release 959 ± 10 944 ± 64 49.5 ± 1.5 Release after K+stimulation 1166 ± 30 2285 ± 135 66.1 ± 1.6 Net increase in release after K+stimulation 208 ± 37 1491 ± 159 87.7 ± 2.0 Striatum Basal release 1087 ± 140 1940 ± 182 64.3 ± 1.4 Release after K+stimulation 1254 ± 164 5421 ± 383 81.3 ± 1.7 Net increase in release after K+stimulation 167 ± 33 3481 ± 298 95.5 ± 0.7 ↵F1-a Sum of disintegrations per minute of aliquots (100 μl) taken from the three fractions collected immediately before K+ stimulation (fractions 2–4).
↵F1-b Sum of disintegrations per minute of aliquots (100 μl) taken from the three fractions collected immediately after K+ stimulation (fractions 5–7).
↵F1-c ([3H] outflow after K+ stimulation) − (basal [3H] outflow).
Tissue slices derived from WT mice (M4 receptor WT mice) were prelabeled with [3H]choline (0.1 μm), and potassium-stimulated release of [3H]choline and [3H]ACh was determined as described in Materials and Methods. [3H]choline and [3H]ACh were separated by reverse-phase HPLC followed by liquid scintillation spectrometry (Wessler and Werhand, 1990). Data represent means ± SEM from four independent experiments (mice).


