

Abstract
Voltage-dependent large-conductance Ca2+-activated K+ channels (BK channels) are widely expressed in excitable and nonexcitable cells. BK channels exhibit diverse electrophysiological properties, which are attributable in part to alternative splicing of their α-subunits. BK currents have been implicated in the growth control of glial cells, and BK channels with novel biophysical properties have recently been characterized in human glioma cells. Here we report the isolation, cloning, and functional characterization of glioma BK (gBK), a novel splice isoform of hSlo, the gene that encodes the α-subunits of human BK channels. The primary sequence of gBK is 97% identical to its closest homolog hbr5, but it contains an additional 34-amino-acid exon at splice site 2 in the C-terminal tail of BK channels. hSlo transcripts containing this novel exon are expressed ubiquitously in various normal tissues as well as in neoplasmic samples, suggesting that the novel exon may modulate important physiological functions of BK channels. Expression of gBK inXenopus oocytes gives rise to iberiotoxin-sensitive (IbTX) currents, with an IC50 for IbTX of 5.7 nm and a Hill coefficient of 0.76. Single gBK channels have a unitary conductance of ∼250 pS, and the currents show significantly slower activation and higher Ca2+ sensitivity than hbr5. Ca2+ sensitivity was enhanced specifically at physiologically relevant [Ca2+]i(100–500 nm). Examination of biopsies from patients with malignant gliomas has revealed specific overexpression of BK channels in gliomas compared with nonmalignant human cortical tissues. Importantly, tumor malignancy grades have correlated positively with BK channel expression, suggesting an important role for the gBK channel in glioma biology.
Voltage-dependent large-conductance Ca2+-activated K+ channels, often referred to as BK channels, resemble a unique class of ion channels that couple intracellular chemical signaling to electric signaling (McManus, 1991). BK channels have been indicated to regulate neuronal firing (MacDermott and Weight, 1982; Robitaille and Charlton, 1992; Robitaille et al., 1993; Golding et al., 1999; Poolos and Johnston, 1999), endocrine cell secretion (Marty, 1989; Lingle et al., 1996), and smooth muscle tone (Nelson and Quayle, 1995; Brenner et al., 2000). In nonexcitable cells, such as epithelial, endothelial, or glial cells, BK channels may contribute to diverse biological functions ranging from osmoregulation (Turnheim et al., 1989) and cell proliferation (Wiecha et al., 1998) to cell migration (Soroceanu et al., 1999).
This remarkable functional diversity of BK channels may, in part, be explained by the molecular diversity of their pore-forming α-subunits. These α-subunits derive from a single gene (Slo) that undergoes extensive alternative splicing. These alternatively spliced isoforms exhibit distinct channel properties such as different activation kinetics and calcium sensitivity (Adelman et al., 1992; Tseng-Crank et al., 1994; McCobb et al., 1995).
BK channels have been studied in astrocytes (Nowak et al., 1987), human gliomas (Zahradnikova and Zahradnik, 1992), and Müller glial cells (specialized retinal glial cells) (Newman, 1985; Bringmann and Reichenbach, 1997; Bringmann et al., 1997). In Müller cells the enhanced activity of BK channels is correlated with the increase of cell proliferation during development and after injury (gliosis) (Bringmann et al., 2000). Interestingly, current amplitudes of BK channels are significantly larger in Müller cells isolated from patients with proliferative vitreoretinopathy (PVR) than in cells from healthy donors (Bringmann et al., 1999), suggesting a possible role for BK channels in this proliferative disease.
The BK channel-specific blocker iberiotoxin (IbTX) has been shown to inhibit the migration of U-251MG glioma cells in vitro(Soroceanu et al., 1999). Furthermore, two human glioma cell lines [STTG-1, World Health Organization (WHO) grade III, and D-54MG, WHO grade IV] exhibit large BK currents that are more sensitive to [Ca2+]i (Ransom and Sontheimer, 2001) than has been reported previously for other types of BK channels (Tseng-Crank et al., 1994; DeCoursey et al., 1996;Hurley et al., 1999).
These findings motivated us to embark on a detailed molecular study of BK channels in human gliomas and led to the identification of a novelhSlo splice variant. This alternative splice variant ofhSlo encodes a channel that contains a unique 34-amino-acid exon at splicing site 2 of hSlo and was named glioma BK (gBK). hSlo transcripts containing this novel exon were identified ubiquitously in normalized cDNAs from various normal and neoplastic tissues. After expression in oocytes, gBK exhibited the pharmacological and biophysical properties of the native BK currents identified in glioma cells (Brismar and Collins, 1989; Ransom and Sontheimer, 2001). Importantly, when we compared gBK with a BK channel isoform without this insert (hbr5), which was identified in human brain (Tseng-Crank et al., 1994), gBK showed some unique properties, including an enhanced Ca2+ sensitivity at physiologically relevant [Ca2+]iconcentrations.
MATERIALS AND METHODS
The antibody against BK channels, MP-2, was a gift from Dr. I. Levitan (University of Pennsylvania, Philadelphia, PA). The human glioblastoma cDNA library was a gift from Dr. B. Soares (University of Iowa, Iowa City, IA). Normalized human cDNAs from both normal and neoplastic tissues were purchased from Clontech (Palo Alto, CA). The glioma cell line D54-MG (glioblastoma multiforme, also referred to as GBM) was a gift from Dr. D. Bigner (Duke University, Durham, NC). The glioma cell lines U251-MG (GBM, WHO grade IV) and STTG-1 (astrocytoma, WHO grade III) were obtained from American Type Culture Collection (Manassas, VA). The mammalian expression vector pcDNA 3.1 was purchased from Invitrogen (Carlsbad, CA). Reverse transcriptase (RT)-PCR kits and IbTX were purchased from Sigma (St. Louis, MO). The pSTBlue-1 Perfectly Blunt Cloning Kit was from Novagen (Madison, WI), the Quick Change mutagenesis kit was from Stratagene (La Jolla, CA), and the in vitro mMESSAGE mMACHINE transcription kit was from Ambion (Austin, TX). Restriction enzymes were purchased from New England Biolabs (Beverly, MA) or Promega (Madison, WI). All other chemicals were purchased from Sigma.
Cell culture
Glioma cell lines were maintained in DMEM (Invitrogen) supplemented with 10% fetal calf serum (FBS; HyClone, Logan, UT) and were kept in an incubator (Lab-Line Instruments, Melrose Park, IL) at 37°C in a 90% O2/10% CO2 humidified environment.
Western blots
The biopsy tissue samples. Approximately 0.5 gm of tissues was collected into glass homogenizers with 0.5 ml of homogenization buffer [referred to as HB; containing (in mm) 10 Tris-HCl, pH 7.5, 250 sucrose, 1 MgCl2, 5 CaCl2, and 1 PMSF plus 10 μg/ml leupeptin, 1 μg/ml pepstatin, and 1 μg/ml aprotinin]. The tissues were homogenized for 1 min and put on ice. This was repeated for two to three sets, and cell debris was spun down and removed at 2000 × g for 5 min at 4°C. Supernatants were collected, and the proteins were separated by SDS-PAGE; Western blot analysis was performed.
Cell lines. Cells in 100 mm culture dishes were rinsed once with cold PBS and then scraped off and transferred into glass homogenizers with 0.3 ml HB. Subsequent procedures were identical as described for the biopsy samples above.
Xenopus oocytes. Xenopus oocytes injected with rRNA were transferred to Eppendorf tubes and homogenized on ice in 5 mm Tris-HCl, pH 8.0, 1 mmEGTA, and 1 mm EDTA containing 20 μm PMSF and 10 μg/ml leupeptin by passage through a 22-gauge needle. The homogenates were centrifuged at 3000 × g at 4°C for 5 min to pellet the yolk granules. The supernatants were used directly for SDS-PAGE and immunoblotting (White et al., 1994).
Cloning of hSlo cDNA from glioma cells and construction of expression vector
To isolate gBK, we synthesized a pair of degenerate PCR primers (Tseng-Crank et al., 1994). The sequences of the degenerate primers were as follows: s7 forward, 5′-GA(A/G)(C/T)TIAA(A/G)(C/T)YIGGITT(T/C)ATIGCICA-3′; s9 reverse, 5′-GGCATIACIA(A/G)(A/G)TTICGIA(A/G)ICCIATIA-3′. RT-PCR was performed according to the protocol for the RT-PCR kit (Sigma) from 20 μg of glioma cell line D54-MG whole RNA. The reverse transcription used both pd(T)23 and pd(N)6 primers. The PCR conditions were 85°C for 3 min, 94°C for 1 min, 45°C for 2 min, and 72°C for 1 min (30 cycles).
Initial PCR products were cloned into the pSTBlue-1 vector by using the pSTBlue-1 Perfectly Blunt Cloning Kit and were sequenced. A 70 bp sequence was identified and matched to the hSlo cDNA sequence. A pair of primers was designed according to this sequence: middle forward, 5′-CCTCTCCACCATGCTTGCCAACCTCTTCTC-3′; middle reverse, 5′-GGAGAAGAGGTTGGCAAGCATGGTGGAGAG-3′. The 5′ and 3′ primers ofhSlo were designed according to the aligned Slosequences: forward, 5′-CGGCGGAGGCAGCAGTCTTAGAATGAGTAG-3′; reverse, 5′-GGGGGGACTACAGGGGAAAACAGGGAAAG-3′. RT-PCR was conducted to clone 5′ and 3′ of hSlo cDNA from D54-MG cells. The products were cloned into the pSTBlue-1 vector and sequenced as above.
The complete gBK cDNA sequence was constructed by assembling the overlapping 5′ and 3′ sequence of gBK cDNA into pcDNA 3.1 in tandem, and mutagenesis was conducted to eliminate the overlapping 61 bp between the two fragments. The oligo sequences used for mutagenesis were as follows: forward, 5′-p-CACCATGCTTGCCAACCTCTTCTCCATGAGGTCATTCATAAAGATTGAGG-3′; reverse, 5′-p-CCTCAATCTTTATGAATGACCTCATGGAGAAGAGGTTGGCAAGCATGGTG-3′. The programs GENETOOL (BioTools, Edmonton, Alberta, Canada), BCM Search Launcher (Baylor College of Medicine, Houston, TX), and NCBI BLAST (National Center for Biotechnology Information, Bethesda, MD) were used for sequence analysis.
PCR application
PCR was applied to detect the mRNA distribution and expression levels of hSlo splice variants containing the novel gBK exon in normalized cDNAs from eight normal tissues and eight neoplastic samples, respectively. PCR primers were designed to amplify the novel gBK exon specifically. The sequences of the primers were as follows: forward, 5′-GTTGGGAAGAACATTGTTCTTTGTGG-3′; reverse, 5′-ATTTAGGTGACACTATAGAAGTGGACTTTGACAGAGAAAGTTTG-3′. PCR conditions were 95°C for 30 sec, 55°C for 30 sec, and 68°C for 30 sec (38 cycles). The primer specificity was determined by sequencing the PCR product from the glioma cDNA library with sp6 primer: 5′-ATTTAGGTGACACTATAGAAGTG-3′.
cRNA synthesis
Linearized plasmid DNA was transcribed with T7 RNA polymerase in the presence of the cap analog m7G(5′)ppp(5′)G with the Ambion mMESSAGE mMACHINE kit. Template DNA was removed with RNase-free DNase I, and the RNA was precipitated with lithium chloride and resuspended in RNA storage buffer (1 mm sodium citrate, pH 6.4). RNA samples were examined on agarose minigels with ethidium bromide to assure the presence of a single, nondegraded band of the expected size.
Expression of cloned BK channels in Xenopus oocytes
Stage VI oocytes from female Xenopus laevis (Xenopus I, Ann Arbor, MI) were harvested and incubated at 16°C before injection. The in vitro-transcribed capped cRNA was injected into oocytes with a Nanoject microinjection system (Drummond Scientific, Broomall, PA) at a total volume of ∼60 nl (∼100 ng). Oocytes were maintained at 16°C in sterile oocyte Ringer's incubation solution (OR2) consisting of (in mm) 92.5 NaCl, 2.5 KCl, 1 MgCl2, 1 Na2HPO4, 1 CaCl2, and 5 HEPES plus 50 U/ml penicillin and 50 μg/ml streptomycin, pH 7.5. The solution was changed daily. Functional channel expression was observed within 2 d, and increasing current levels could be measured up to 4–7 d after injection. Immediately before the patch-clamp experiments the vitelline membrane was removed with fine forceps in a hypertonic solution containing (in mm) 200 K-gluconate, 20 KCl, 1 MgCl2, 10 EGTA, and 10 HEPES (pH-adjusted to 7.4 with NaOH).
Electrophysiology
Two-electrode voltage clamp. At 2 d after cRNA injection the oocytes were placed in a 100 μl chamber with continuous perfusion of the OR2 solution. The oocytes were voltage clamped at −20 mV and then jumped to 10 voltage steps in 20 mV increments (from 0 to approximately +180 mV), using a GeneClamp 500 amplifier (Axon Instruments, Foster City, CA). The current signal was low-pass filtered at 2 kHz and digitized at 10 kHz. Data were collected via a Power Macintosh 7300 computer (Apple, Cupertino, CA) running IGOR Pro software (WaveMetrics, Lake Oswego, OR) with Pulse Control macro (Instrutech, Port Washington, NY). For IbTX blockage experiments IbTX was applied at increasing concentrations by switching from control solution to each IbTX solution; voltage steps were applied after constant perfusion of the IbTX solution until it reached steady state, which for low concentrations of IbTX took up to 20 min.
Patch clamp. All macropatch experiments were performed by the gigaohm seal patch-clamp method in the excised inside-out configuration (Hamill et al., 1981). Patch pipettes were pulled from thin-walled borosilicate glass (TW150F-40, World Precision Instruments, Sarasota, FL) on a PP-830 puller (Narishige Instruments, Tokyo, Japan) and were flame-polished on a microforge (MF-83, Narishige Instruments); they had resistances of 4–7 MΩ. Macropatch pipettes were pulled with very steep taper, which resulted in the excision of a large area of membrane because of the propensity of oocyte membranes to form seals as far as 20–100 μm into the electrode (Ruknudin et al., 1991). The macropatch currents were amplified with an Axopatch-1D amplifier (Axon Instruments) controlled by a PC-compatible microcomputer (Dell Computers, Dallas, TX) running pClamp8 (Axon Instruments). Data were stored directly to disk with a Digidata 1200 analog-to-digital interface (Axon Instruments), acquired at 10 kHz, and filtered at 2 kHz. Capacitance compensation was performed by using the built-in amplifier circuitry. No series resistance compensation was used, and leak currents were not subtracted from macropatch currents. Pipette potentials were nulled immediately before seal formation.
During seal formation the oocytes were bathed in ND-96 [containing (in mm) 96 NaCl, 2 KCl, 1 MgCl2, and 5 HEPES, pH 7.5, supplemented with 2.5 sodium pyruvate]. After excision the patches were moved quickly into a flowing zero Ca2+ solution. For inside-out recordings the pipette extracellular solution was (in mm) 145 K+-gluconate, 5 KCl, 2.5 MgCl2, 10 HEPES, and 1 EGTA (pH-adjusted to 7.4 with KOH). The intracellular (bath) solution was (in mm) 145 K+-gluconate, 5 KCl, 2.5 MgCl2, 10 HEPES, and 1 EGTA (pH-adjusted to 7.2 with KOH). Recording solutions contained gluconate as a nonpermeant anion to prevent the activation of calcium-activated chloride channels endogenous to oocytes (Miledi, 1982). Sufficient CaCl2 was added to obtain the desired free [Ca2+]. We calculated the calcium to add to our intracellular solutions in experiments with elevated free calcium concentrations with a software program based on equations provided in Marks and Maxfield (1991). This program takes into account the pH and the type of chelators present. We corrected for EGTA purity. For target free Ca2+ concentrations of 0.1, 0.14, 0.5, and 1 μm we added 0.387, 0.470, 0.746, and 0.844 mm Ca2+, respectively.
Data analysis
Data were analyzed off-line with the software packages Clampfit8 (Axon Instruments), Origin (v.6.0, MicroCal Software, Northampton, MA), and Excel 2000 (Microsoft, Seattle, WA).
Dose–response curves for IbTX were constructed first by measuring the leak-subtracted steady-state currents at each IbTX concentration at +160 mV. Data from each oocyte were fit to a modified Hill equation:I = Imax/(1 + ([IbTX]/IC50)n), whereI is the IbTX-sensitive current,Imax is the maximum current of the fit, IC50 is the half-maximal inhibitory concentration of IbTX, and n is the Hill coefficient. The IbTX-sensitive currents were normalized to the maximum value determined from the fit, and normalized currents from each oocyte were pooled and plotted against the applied IbTX concentration. The IC50 and Hill coefficient were obtained from averaged data from three oocytes.
Calcium dependence curves were constructed similarly to the IbTX dose–response curve except that the data were fit to the following equation: G = Gmax/(1 + (KD/[Ca]i)n), where Gmax is the maximal conductance,KD is the apparent Ca2+ dissociation constant, andn is the Hill coefficient. The curve was obtained from averages of normalized data from five micropatches. The normalized conductance (G/Gmax) curves were obtained by first measuring the steady-state currents for each macropatch. Because we used symmetrical K+and the reversal potential was zero, we calculated the conductance for each test potential: G =I/(Vm − 0). These data were plotted against test voltages, fit to the Boltzmann equation:G =Gmax/(1+e−(V − V1/2)zF/RT) (Weiss and Magleby, 1990), and then normalized to the maximum value obtained from the fit. The resultingG/Gmax values, in turn, were averaged, plotted against test voltages, and fit to the Boltzmann equation also.
RESULTS
BK channel expression is upregulated markedly in human glioma cells
To investigate BK channels in glioma cells at the molecular level, we first examined expression levels of BK channel protein in glioma and nonglioma tissues by immunoblotting. We obtained human biopsy tissues (under an Institutional Review Board approved protocol) from seven patients operated on for malignant gliomas. For comparison, we also obtained from two autopsies the tissues of normal cortex without any evident pathology. The glioma samples that were examined included two pilocytic astrocytomas (WHO grade I), two astrocytomas (WHO grade II), one anaplastic astrocytoma (WHO grade III), and two GBMs (WHO grade IV). Identical amounts of total protein were loaded (as evidenced by similar amounts of α-actin used as loading control; Fig.1A, bottom panel) on an 8% SDS-PAGE and were probed with the polyclonal anti-BK channel antibody MP-2. This antibody recognizes a highly conserved intracellular region at the C terminus of BK channels from a variety of species, including human, rat, and mouse.

BK channel expression is upregulated in human malignant gliomas. The polyclonal BK antibody MP-2 was used to examine the expression of BK channels by Western blot in human biopsy tissue and established human glioma cell lines, with autopsy samples from normal human brain serving as a control. Antibodies consistently detected a BK channel protein band at a molecular weight of ∼120 kDa. This band was enhanced significantly in glioma samples. A band at ∼42 kDa corresponds to α-actin, which was used as a loading control.A, Human biopsy tissue samples from glioma patients showing enhanced BK channel expression. Tissue samples were grouped into five categories, from left to right:C, normal cortex from autopsy; I, pilocytic astrocytoma (WHO grade I); II, grade II astrocytoma (WHO grade II); III, anaplastic astrocytoma (WHO grade III); IV, glioblastoma (WHO grade IV).B, BK channel expression in glioma cell lines. The first three lanes show normal human cortex samples as a control. The three glioma cell lines that were studied were STTG-1, derived from a WHO grade III astrocytoma, and D54-MG and U251-MG, each derived from WHO grade IV glioblastoma multiforme.
Considerably higher expression levels of BK channel proteins were observed in all glioma samples compared with the two control tissues, despite some visible protein degradation in the glioma samples (Fig.1A). Interestingly, relative BK expression correlated positively with the malignancy grades of the examined tissues. Thus, expression levels in the pilocytic astrocytoma samples, the lowest grade of glioma (WHO I), albeit much more pronounced than in controls (Fig. 1A,C), were lower than in the samples from astrocytomas (Fig. 1A; II, III) or GBM (Fig.1A; IV). By far, the highest protein level was found in GBM, the most malignant glioma (Fig. 1A; IV).
We also examined BK channel expression in several established and frequently studied cell lines derived from human gliomas by immunoblotting. These cell lines included two GBM-derived cell lines (D54-MG and U251-MG; WHO grade IV), and one astrocytoma-derived cell line (STTG-1; WHO grade III). Normal cortical tissues from three autopsies without evident pathology served for comparison. All three controls showed very low BK protein expression, whereas all three glioma cell lines displayed prominent expression of BK channel protein (Fig. 1B). In keeping with the above observation, BK protein levels correlated positively with enhanced malignancy grades of the cell lines, with significantly higher expression in D54-MG and U251-MG than in STTG-1 cells. These results suggest that relative expression of BK channel protein is elevated notably in human gliomas compared with nonmalignant normal brain.
Cloning of a novel BK splicing variant: gBK
To study the molecular identity of glioma BK channels, we set out to clone the cDNA encoding this channel from glioma cells by using an RT-PCR strategy as described in more detail in Materials and Methods. Briefly, the 5′ and 3′ cDNA fragments of gBK first were cloned separately. Then the two sequences were subcloned in tandem into the expression vector pcDNA 3.1 to yield a 3.5 kb fragment with a 61 bp overlapping sequence, which was eliminated by subsequent mutagenesis.
These manipulations generated a full-length cDNA with an open reading frame encoding a protein of 1174 amino acids. The derived amino acid sequence of the glioma BK channel, henceforth termed gBK, is 97% identical to the primary sequence of hbr5, the next closest BK relative. Specifically, gBK and hbr5 differ at splice site 2, which in hbr5 contains a 29-amino-acid exon, at which position gBK contains a 63-amino-acid insert composed of an additional 34-amino-acid exon adjacent to the N terminus of the 29-amino-acid exon in hbr5. This topology is illustrated in Figure 2.

The glioma BK (gBK) channel is a novel alternatively spliced BK channel isoform derived from thehSlo gene. Shown is a schematic drawing of a BK channel with the five identified splicing sites. The transmembrane α-helices S0–S6 and the C-terminal hydrophobic domains S7–S10 are represented by gray barrels. Amino acid sequences of the alternate splice exons of gBK and hbr5 are illustrated also. Theunderlined sequence represents a 29-amino-acid exon that is present in both gBK and hbr5. The sequence in boldrepresents the novel exon of gBK. The symbols above the sequence point to motifs that meet the criteria for a casein kinase I phosphorylation site (asterisk), a multifunctional calmodulin-dependent kinase phosphorylation site (filled diamond), and a protein kinase C phosphorylation site (filledcircle).
We searched protein databases and established that the 34-amino-acid insert of gBK is unique and without homology to any reported protein sequence. To ascertain that gBK is indeed the major BK channel isoform in glioma, we synthesized PCR primers to amplify potential inserts at the splice sites 1, 2, 3, and 4 of BK channels from a cDNA library constructed from human GBM brain tissues (data not shown). The PCR products from each splicing site were sequenced and analyzed. Splicing site 2 was identified to be the only site of BK channels in glioma cDNA library undergoing alternative splicing, and the sequence of the insert was identical to that in gBK. This suggests that gBK also is expressed in acute human glioma and most likely is the only BK channel isoform expressed in glioma.
By applying sequence analysis, we identified the potential phosphorylation sites in the novel gBK exon for various protein kinases, such as casein kinase I, multifunctional calmodulin-dependent kinase (CAMK), and protein kinase C (PKC), suggesting that this exon may regulate the biological function of gBK channels in glioma cells.
Distribution of hSlo transcripts containing the novel gBK insert
PCR was applied to determine the distribution of hSloalternative splicing variants containing the novel gBK exon among normalized cDNAs from various normal and neoplastic tissues. Primers were designed specifically to amplify the novel gBK exon at splicing site 2. The sizes and relative quantities of the PCR products amplified from eight normal tissues and eight neoplastic samples are shown in Figure 3. PCR amplification with the same pair of primers in glioma cDNA was used as a positive control; amplifications from the hbr5 vector and without a template were used as negative controls (data not shown), and the expression level of the housekeeping gene G3PDH was used as an internal control. All tissues that were examined showed PCR products with a size that was identical to those found in the glioma cDNA library, suggesting thathSlo transcripts with this novel exon are expressed ubiquitously. Note, however, that the relative expression differed substantially, as shown in the immunoblotting in Figure 1, indicating elevated BK protein levels in gliomas compared with normal brain tissues.

PCR analysis of the distribution and relative expression levels of hSlo transcripts containing the novel gBK insert in human tissues. Normalized cDNAs were used to detect the novel insert in eight normal human tissues and eight neoplastic human samples representing tumors derived from six different organs. The primers were designed specifically to amplify the gBK insert (see Materials and Methods). Glioma cDNA library was used as a positive control. To ensure the specificity of the primers, we sequenced the PCR product from glioma cDNA library with sp6 primer. The expression level of the housekeeping gene G3PDH was used as an internal control.Top, Amplification results with the gBK insert-specific primers; all tissues examined here show a ∼120 bp product, a size that is consistent with what we obtained from the glioma cDNA library.Bottom, Results with human G3PDH-specific primers, which give rise to a 983 bp amplification product.
gBK forms a functional BK channel
To test whether the gBK cDNA encodes a functional channel in vivo, we examined gBK expression as a full-length protein inXenopus oocytes and used hbr5 as a positive control. cRNAs encoding for either gBK or hbr5, respectively, were injected intoXenopus oocytes. On day 3 after the injections, cell lysates from injected or uninjected oocytes were collected; immunoblotting was performed as above. As expected, we detected a ∼120 kDa protein band in cell lysates from oocytes injected with either gBK or hbr5 cRNA (Fig. 4A), demonstrating that both gBK and hbr5 expressed robustly as full-length proteins in Xenopus oocytes. We could not detect endogenous BK channel expression in uninjected oocytes with the MP-2 antibody.
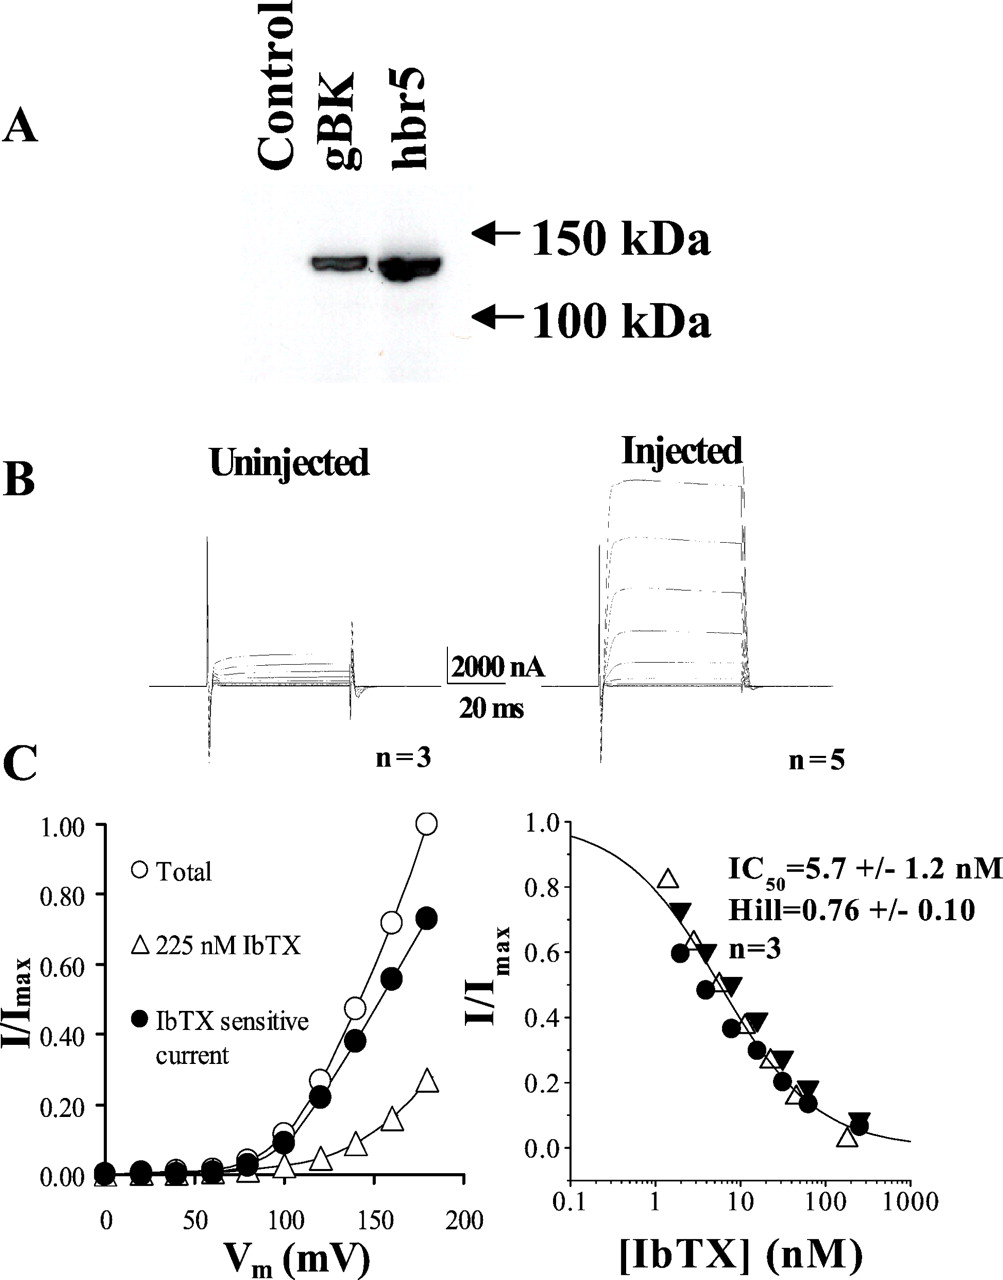
gBK forms IbTX-sensitive channels inXenopus oocytes. A, Western blot of oocyte lysates from injected and uninjected oocytes. Uninjected oocyte lysate was used as a negative control, and hbr5-injected oocyte lysate was used as a positive control. The anti-BK channel antibody MP-2 recognized a specific band ∼120 kDa in both gBK- and hbr5-injected oocyte lysates, respectively, but not in uninjected oocyte lysate.B, gBK-injected oocytes express large voltage-activated outward currents. Current recordings were obtained by double-electrode voltage clamp in OR2 medium containing (in mm): 92.5 NaCl, 2.5 KCl, 1 CaCl2, 1 MgCl2, and 5 HEPES, pH 7.5, with 3 m KCl containing microelectrodes. Oocytes were held at −20 mV and stepped to test potentials between 0 and +180 in 20 mV increments. Uninjected oocytes were used as a control, and the currents shown are averages of currents from three oocytes (left). gBK-injected oocytes showed large voltage-dependent outward currents; the traces shown are averages from five oocytes (right). C, Dose–response of IbTX block in gBK-injected oocytes. Left, The normalized current (I/Imax)–voltage relationship for total currents before IbTX treatment (open circles), the residual currents after 225 nm IbTX treatment (open triangles), and the IbTX-sensitive currents (filled circles) that were obtained by subtracting residual currents from total currents.Right, Pooled IbTX dose–responses from three oocytes (the three symbols represent data from three oocytes, respectively) that were obtained by plotting the relative inhibition achieved by IbTX as a function of the applied IbTX concentration. The data were a least-squares fit to a modified Hill equation of the form:I/Imax = 1/(1 + ([IbTX]/IC50)n), whereI is the IbTX-sensitive current,Imax is the maximum current of the fit, IC50 is the half-maximal inhibitory concentration of IbTX, and n is the Hill coefficient. The dose–responses were obtained after applying IbTX up to 20 min until it reached steady state; the continuous line was obtained from the averaged data of three oocytes.
We next examined whether gBK protein expressed in Xenopusoocytes can form functional BK channels by two-electrode voltage clamp. On day 2 after injection large-amplitude voltage-activated outward currents were recorded (Fig. 4B, right), which were not detected in uninjected oocytes (Fig.4B, left). To confirm that the outward currents were mediated by BK channels, we applied the highly selective BK channel blocker IbTX. More than 60% of the total currents were inhibited by 100 nm IbTX. The same concentration did not affect currents in uninjected oocytes (data not shown). Thus, gBK cDNA encodes a functional BK channel in Xenopusoocytes
A complete dose–response curve for the inhibition of gBK currents by IbTX was established from three oocytes by voltage-clamp recordings. Figure 4C, left, shows the normalized current (I/Imax)–voltage relationships before (Total; open circles) and after the addition of 225 nm IbTX (open triangles) and the IbTX-sensitive currents (filled circles) that were obtained by subtracting the 225 nm IbTX currents from total currents. Figure4C, right, shows pooled IbTX dose–responses from three oocytes (the three symbols represent the data from three oocytes, respectively). The IC50 and Hill coefficient of IbTX inhibition of gBK currents were determined by a least-squares fit of the I/Imax–[IbTX] relationship of IbTX-sensitive currents to a Hill equation. This yielded an IC50 of 5.7 ± 1.23 nm and a Hill coefficient of 0.76 ± 0.10 (± SD; n = 3) for the IbTX block of gBK currents. These values are similar to those obtained in D54-MG glioma cells (Ransom and Sontheimer, 2001), suggesting that gBK may encode the endogenous BK currents in glioma cells.
Single-channel conductance of gBK inXenopus oocytes
It is well established that different splice variants of BK channels can differ in single-channel conductance, kinetics of activation, and calcium sensitivity (Lagrutta et al., 1994; Saito et al., 1997; Xie and McCobb, 1998; Ramanathan et al., 1999). We first examined the single-channel conductance of gBK from inside-out patches. Figure 5A illustrates representative recordings of gBK unitary currents in symmetrical solutions containing 145 mm K-gluconate with 100 nm free [Ca2+]i at different holding potentials. The unitary currents of gBK channel were determined from Gaussian fits of amplitude frequency histograms by using Fetchan and Pstat (Axon Instruments), and the single-channelI–V relationship of gBK (filled circle) is plotted in Figure 5B. The slope of the I–Vrelationship suggests a single-channel conductance of 250 pS (± 10.7 pS; n = 5) for gBK, which is consistent with the unitary conductance of endogenous BK currents (250–300 pS) determined in patch recordings from five different glioma cell lines with symmetric 150–160 mmK+ solution (Brismar and Collins, 1989).

Single-channel recordings from gBK expressed in oocytes. A, Representative single-channel recordings for gBK. Single-channel currents were measured in inside-out patches at different holding potentials under 100 nm free [Ca2+]i in 145 mmsymmetrical K-gluconate. The closed states of the channels are indicated by dashed lines. Data were filtered at 2 kHz and digitized at 10 kHz. B, The single-channelI–V relationship for gBK (filled circles). Current amplitudes were obtained by Gaussian fit of amplitude histograms. The resulting I–V relationship was fit by using linear regression; the single-channel conductance was obtained from the slope of the fitted line. Data are expressed as the means ± SD.
We also obtained the unitary conductance of hbr5, which was 269 pS (± 10.8 pS; n = 6) and was thus essentially identical to that of gBK, suggesting that the splice insert in gBK does not affect the unitary conductance.
gBK shows altered activation kinetics
We next determined the activation kinetics of gBK in response to depolarizing voltage steps (Fig.6A,C) by using inside-out macropatches. Mean values were derived by fitting the data to a double-exponential function (Fig. 6B). Interestingly, the fast rise time constant (Taufast)–V relationships differed significantly between gBK and hbr5 at voltages more negative than 140 mV (p < 0.05; Fig. 6B), whereas their slow rise time constant (Tauslow)–V relationships were indistinguishable (data not shown). These values were obtained at 100 nm free [Ca2+]i, a value that is within the range of the resting [Ca2+]i levels in glioma cells. However, at 1 μm free [Ca2+]i, both Taufast–V and Tauslow–V relationships of gBK and hbr5 were essentially identical (data not shown); normalized traces at two voltage steps are shown in Figure 6C. Furthermore, our experimentally observed activation time constant determined at 100 mV and 10 msec after onset of the voltage step was 12 msec (± 1.3 msec;n = 7), identical to the value reported for native BK currents in glioma cells (Ransom and Sontheimer, 2001), again suggesting that the gBK encodes predominant BK currents in glioma cells.

Different activation kinetics of gBK and hbr5 currents. Currents were studied in macropatches from oocytes injected with either gBK or hbr5. For comparison, the current traces elicited at each test voltage were normalized to the maximum amplitude, and traces from each patch were averaged from four consecutive recordings. Thethick line represents gBK-mediated currents; thethinline represents hbr5-mediated currents. The patches were held at 0 mV and depolarized to the testing voltages for 200 msec. Currents were recorded in 145 mmsymmetrical K-gluconate solutions with different free [Ca2+]i. A, Averages of normalized traces recorded during superfusion with internal solution buffered to 100 nm free [Ca2+]i from seven patches of gBK-injected and six patches of hbr5-injected oocytes at +60 and +80 mV testing voltages, respectively. B, The relationships between fast rise time constants (Taufast) and voltage for both gBK-mediated (open circles) and hbr5-mediated (filled circles) currents at 100 nm free Ca2+. Theasterisks identify rise time constant values that differ significantly between gBK and hbr5 at the same voltage (p < 0.05). Error bars indicate ± SEM. C, Averages of normalized currents recorded at 1 μm free Ca2+ from three patches of gBK-injected and five patches of hbr5 mRNA-injected oocytes, respectively.
Calcium sensitivity of gBK expressed inXenopus oocytes
To measure the calcium sensitivity of the gBK channel, we examined currents recorded in oocyte macropatches from gBK- and hbr5-expressed oocytes separately. Of the cloned BK channels, hbr5 represents one of the most Ca2+-sensitive BK channel isoforms. Figure 7A summarizes the steady-state Ca2+ dependence curves of gBK derived from five patches at +80 mV testing potential. To obtain these curves, we plotted conductance–[Ca2+]irelationships from each patch and fit them to a Hill equation. With theGmax values obtained from the fit, the conductances were normalized and averaged. Normalized conductances (G/Gmax values;filled circles) then were plotted against [Ca2+]i and fit to a Hill equation (solid curve). The normalized conductance of gBK reached the plateau at ∼1 μm[Ca2+]i with an apparent KD of 137 nm (± 22.3 nm,n = 5), indicating overall high Ca2+ sensitivity of the gBK channel. With the same strategy the apparent KD of hbr5 was obtained (150 ± 20 nm,n = 6; data not shown). This suggests that the apparentKD values of gBK and hbr5 are indistinguishable.

Calcium sensitivity of gBK and hbr5. Currents were elicited with 200 msec voltage steps to test potentials between −120 and +160 mV in 20 mV increments from a 0 mV holding potential in inside-out patches and recorded during superfusion with internal solutions buffered to different free [Ca2+]i ranging from 0 to 1 μm. Data are expressed as the means ± SEM.A, Calcium dependence of gBK. Normalized conductances (G/Gmax) of gBK (A; n = 5) at +80 mV testing potential were plotted against free [Ca2+]i (see Materials and Methods) and fit to the Hill equation: G =Gmax/(1 + (KD/[Ca]i)n), where Gmax is the maximum conductance of the fit, KD is the apparent Ca2+ dissociation constant, and n is the Hill coefficient. B, Calcium sensitivity of gBK. Normalized conductances (G/Gmax) of gBK (left) and hbr5 (right) at five different Ca2+ concentrations were plotted against voltage and fit to a Boltzmann equation:G/Gmax = 1/(1 + exp(−q(V −V1/2)/kT)), where G/Gmax is the normalized conductance, q is the effective gating charge, V1/2 is the half-maximal voltage,k is the Boltzmann constant, and T is the temperature in Kelvin. C,V1/2–[Ca2+]irelationships differ significantly (p < 0.05) between gBK (n = 6) and hbr5 (n = 10). The asterisksindicate the calcium concentrations at whichV1/2 values of gBK and hbr5 differ significantly.
We also examined the steady-stateG/Gmax–voltage relationships of gBK. Figure 7B summarizes recordings obtained from gBK-expressed (Fig. 7B, left) and hbr5-expressed oocytes (Fig. 7B, right) at different Ca2+ concentrations, respectively. Steady-stateG/Gmax values were derived from conductance–voltage relationships of individual patches that were normalized and fit to a Boltzmann equation. AveragedG/Gmax values from six patches for gBK and 10 patches for hbr5 were plotted against testing potentials in Figure 7B. As reported previously, increasing intracellular Ca2+ shifted the conductance–voltage curve to the left for both gBK and hbr5, and very depolarized voltages (greater than +100 mV) were required to activate these channels significantly at zero Ca2+.
The V1/2 values, the voltages at which 50% of channels are active, are a convenient means to compare the calcium sensitivity of BK channels. We determinedV1/2 values in the physiological range of Ca2+ concentrations and plotted them against free [Ca2+]i in Figure7C. Asterisks in Figure 7C indicate that the differences between the two isoforms at the same Ca2+ concentrations were significant (p < 0.05), based on one-way ANOVA analysis. Our data suggest that over a physiologically relevant [Ca2+]i range in glioma cells (100–500 nm), the Ca2+ sensitivity of gBK is significantly higher than in previously identified BK channels in human preparations (Tseng-Crank et al., 1994; DeCoursey et al., 1996; Hurley et al., 1999). Moreover, the Ca2+ sensitivity of gBK was identical to the native BK currents that have been reported recently in glioma cells (Ransom and Sontheimer, 2001).
DISCUSSION
We report on the cloning and functional characterization of a novel splice variant of hSlo, the gene encoding the α-subunit of IbTX-sensitive human BK channels. The novel isoform of BK channels, which was termed gBK, contains a 63-amino-acid insert at splice site 2, which differs by 34 amino acids from its nearest relative, hbr5 (Tseng-Crank et al., 1994). Importantly, we found that BK channels were overexpressed in glioma cells, as evidenced by examination of human biopsy specimens. Moreover, BK channel expression correlates positively with the relative degrees of malignancy of the tumor tissues. Heterologous expression of gBK in oocytes revealed that the pharmacological and biophysical properties of gBK are consistent with the properties of native BK currents in glioma cells. Furthermore, even when compared with its most homologous form, hbr5, gBK showed distinct properties, including slowed channel activation and, importantly, enhanced Ca2+ sensitivity at physiologically relevant [Ca2+]ivalues.
gBK is the principal BK channel in glioma cells
Both our RT-PCR result from glioma cell line D54-MG and PCR results from the pooled human glioma cDNA library suggest that gBK may be the only BK channel isoform in glioma cells. Furthermore, our studies shows that heterologously expressed gBK in oocytes has essentially identical pharmacological and biophysical properties to native BK currents in glioma cells (Brismar and Collins, 1989; Ransom and Sontheimer, 2001), suggesting that gBK is likely to encode the principal native BK channel in glioma.
Heterogeneity in the splicing site 2 of BK channels
It has been demonstrated that alternative splicing of theSlo gene leads to BK channels with different biophysical properties, and these may serve different biological functions (Lagrutta et al., 1994; Xie and McCobb, 1998; Jones et al., 1999;Ramanathan et al., 1999). So far, five alternative splicing sites have been identified in hSlo (Tseng-Crank et al., 1994; Ferrer et al., 1996). Of these, splice site 2 appears to be the most heterogeneous not only in hSlo, but also in Drosophila Slo (dSlo) (Atkinson et al., 1991; Adelman et al., 1992), mouse Slo (mSlo) (Butler et al., 1993), and rat Slo (rSlo) (Xie and McCobb, 1998). Most notably, changes at splice site 2 appear to affect the Ca2+ sensitivity of the channel. For example, in rat adrenal chromaffin cells and PC12 cells the presence of a cysteine-rich 59-amino-acid exon (STREX-1) increases the apparent Ca2+ sensitivity of BK channels when compared with the channels without the exon (ZERO) (Saito et al., 1997;Hanaoka et al., 1999). Similarly, in chick cochlea a 61-amino-acid exon at this site enhances the Ca2+ sensitivity of the channel (Ramanathan et al., 1999).
The gBK-specific exon identified here is the fifth exon described for splicing site 2 in hSlo cDNAs, and splicing variants containing this exon are ubiquitously present among the different tissues studied here. Among the BK channels studied to date that contain an exon at this site, hbr5, which contains a 29-amino-acid exon, was found to have the greatest Ca2+sensitivity. For this reason we used it for comparison purposes throughout this study. Even when compared with native BK currents in different human preparations (Gallin, 1984; Lerche et al., 1995;DeCoursey et al., 1996; Hurley et al., 1999), hbr5 is one of the most Ca2+-sensitive variants, suggesting that the splice site 2 exons either may be a part of the Ca2+ sensor or may interact with a Ca2+ sensor located elsewhere on the channel (Tseng-Crank et al., 1994). Our data are consistent with this notion, and the comparison with hbr5 suggests that gBK has even greater Ca2+ sensitivity under physiological relevant [Ca2+]i, and this may have implications for the biology of these cells, as discussed below.
In addition to alterations in Ca2+sensitivity, there is evidence that exons at splice site 2 can alter the regulation of BK channels. For instance, PKA activates ZERO but inhibits STREX-1 BK channels (Tian et al., 2001). We show that gBK contains at least three potential sites meeting the consensus criteria for kinase phosphorylation by casein kinase I, CAMK II, and PKC. Thus future studies on the kinase modulation of gBK are warranted.
Differential activation kinetics and steady-state properties
Our studies show that the unique exon of gBK affects the activation kinetics of the channel, as evidenced by different fast activation time constants (Taufast) and different slopes of Taufast–V relationships between gBK and hbr5. The presence of this exon also affected the calcium sensitivity, but not the calcium affinity, of the channel because gBK and hbr5 have indistinguishableKD values but differentV1/2 values at the physiological [Ca2+]i range in glioma cells. Hence, it suggests that the unique insert of gBK may affect primarily the gating properties of the channel.
This finding is surprising. It has been proposed previously that the region between S8 and S9 of BK channels, which contains the splice insert in gBK, is dispensable. It was thought that the core region (S0–S8) determines the voltage dependence of gating, whereas the tail domain (S9–C terminus) contains two calcium-sensing domains, including the “calcium bowl” and an inhibitory domain for voltage-dependent gating. The region between S8 and S9 was considered to be a simple linker to connect these two parts (Wei et al., 1994; Schreiber and Salkoff, 1997; Schreiber et al., 1999). Our results suggest that this region instead contributes to activation kinetics and Ca2+ sensitivity of the channel. Future site-directed mutagenesis studies at splice site 2 will be able to characterize its role in calcium sensitivity and voltage dependence.
Enhanced BK channel expression in glioma cells
BK channels have been suggested to participate in the proliferation of nonexcitable cells, including glial cells. For example, BK channels have been implicated in the regulation of cultured Müller cell proliferation (Puro et al., 1989; Kodal et al., 2000) and have been found to be elevated in human Müller cells from patients with PVR when compared with cells from control retinas (Bringmann et al., 1999). This is the first report demonstrating overexpression of BK channels in gliomas acutely removed from patients. The positive correlation of BK channel expression with tumor malignancy grade indeed suggests a possibly important role of BK channels in the biology of these tumors.
Glioma cells are transformed glial cells that have lost their growth control. The process of the glial-to-glioma transition is poorly understood. Overexpression of growth factor receptors, most notably the epidermal growth factor receptor (EGF-R), is a characteristic feature of glioma cells (Collins, 1994), and its activation has been shown to increase [Ca2+]i(Hernandez et al., 2000). An increase in intracellular Ca2+ is required during G1/S transition of the cell cycle (Whitfield et al., 1995). The high Ca2+ sensitivity of the gBK channel suggests that EGF-R activation would activate gBK also and, hence, couples growth factor release to changes in K+ conductance and, consequently, the membrane potential of the cell. This in turn may alter the driving force for Ca2+ entry (Kamouchi et al., 1997). EGF-R activation has been shown to activate BK currents through rising [Ca2+]i in cultured Müller glial cells (Kodal et al., 2000).
Several previous studies have implicated BK channel expression to oncogenic cell transformation. For example, Huang (Huang and Rane, 1994) reported that p21ras, which plays a pivotal role in controlling cell oncogenic transformation (Ding et al., 2001), and its immediate downstream target, the Raf kinase, are required for the induction of Ca2+-activated K+ channels (KCa). Increased activity of KCa channels appeared to be required for the mitogenic stimulation of nontransformed cells with EGF and platelet-derived growth factor (PDGF). Mitogenic stimulation in the presence of the KCa blocker charybdotoxin (ChTX) inhibited the stimulatory effect of the mitogen, suggesting that KCa is one of the physiological targets of p21ras and may play a role in cell proliferation (Huang and Rane, 1994). Indeed, EGF and lysophosphatidic acid induced a Ca2+-activated K+ current with 186 pS unitary conductance when applied to serum-deprived chicken embryo fibroblasts (CEFs) after 2 hr (Repp et al., 1995). Similarly, the transformation of CEFs with Rous sarcoma virus (RSV) specifically induced a TEA (IC50 = 1.8 mm) and ChTX-sensitive (IC50 = 19 nm) KCa current that is absent from nontransformed cells (Repp et al., 1993).
Glioma cells show an unusual ability to invade the normal brain diffusely, thereby escaping surgical treatment (Merzak and Pilkington, 1997). It has been suggested that cell invasion into narrow brain spaces may require tumor cells to shrink. Cell shrinkage requires the efflux of KCl, and BK channels may serve as the pathway for regulated K+ efflux (Christensen and Zeuthen, 1987;Gitter et al., 1987). Consistent with this notion, 10 nmIbTX was found to reduce the in vitro invasion of U251-MG glioma cells (Soroceanu et al., 1999).
In light of these findings that implicate BK channels in the growth and migration of cells, it is not surprising that BK channels are overexpressed in glioma cells. Moreover, a putative role for BK channels in cell growth and cell migration also may explain why higher grade tumors, characterized by enhanced growth and invasiveness, express more BK channels than lower grade tumors. It also is interesting in this regard that gBK is somewhat more sensitive to calcium than other BK channels. This may facilitate channel activation by even modest increases in [Ca2+]i, for example, as a result of growth factor activation. Clearly, additional studies of the role of gBK in glioma biology are warranted.
Footnotes
This work was supported by National Institutes of Health Grants RO1-NS36692, RO1-NS31234, and DK07545. We thank Dr. Irwin B. Levitan for providing the BK channel-specific antibody MP-2, Dr. Bento Soares for providing the human glioblastoma cDNA library, Dr. David S. Weiss for providing oocytes and for critical review of this manuscript, and Dr. Chris B. Ransom for technical advice. We also thank Dr. Honglong Ji for help with oocyte injection.
Correspondence should be addressed to Dr. Harald Sontheimer, Department of Neurobiology, University of Alabama at Birmingham, 1719 Sixth Avenue South, Civitan International Research Center (CIRC) 545, Birmingham, AL 35294. E-mail: hws{at}nrc.uab.edu.


