

Article Figures & Data
Figures
- Figure 2.
Quantification IEDs related extracellular potentials and analysis of IED origin and propagation. A, Example of interictal epileptiform discharge in hippocampal-entorhinal cortex slice of a P19 rat. Extracellular field potential recording (wide band, 0.1 Hz to 4 kHz) at the CA3 pyramidal cell layer before filtering (left trace) and after filtering (right traces) for EEG components of IED (1-100 Hz bandpass filter) and IED-related fast field ripple (200-500 Hz bandpass filter). EEG components are labeled (I, primary population spike; II, slow spike wave). B, Simultaneous extracellular field potential records in the pyramidal cell layer of the CA3a, CA3b, CA3c, CA1, and granular cell layer (G. C.) of the dentate gyrus regions. Examples of IEDs before (left traces) and after (right traces) filtering in EEG band (raw data, 0.1 Hz to 4 kHz; EEG, 1-100 Hz). EEG components are labeled (I, primary population spike; II, slow spike wave; III, secondary afterdischarges). Shift of the negative peaks of primary (initial) population spike (Δτ) shows that the population spike is initiated in CA3a and bidirectionally propagates to CA3c dentate gyrus and CA1. C, Simultaneous extracellular records in the CA3a stratum oriens, stratum pyramidale, stratum radiatum, and stratum lacunosum-moleculare layers (wide band range, 0.1 Hz to 4 kHz). Filtered traces (1-100 Hz) show that the population spike is initiated in the somatic layer and propagated into dendritic trees and axons. A-C, IEDs induced by 8.5 mm [K+]o.
- Figure 1.
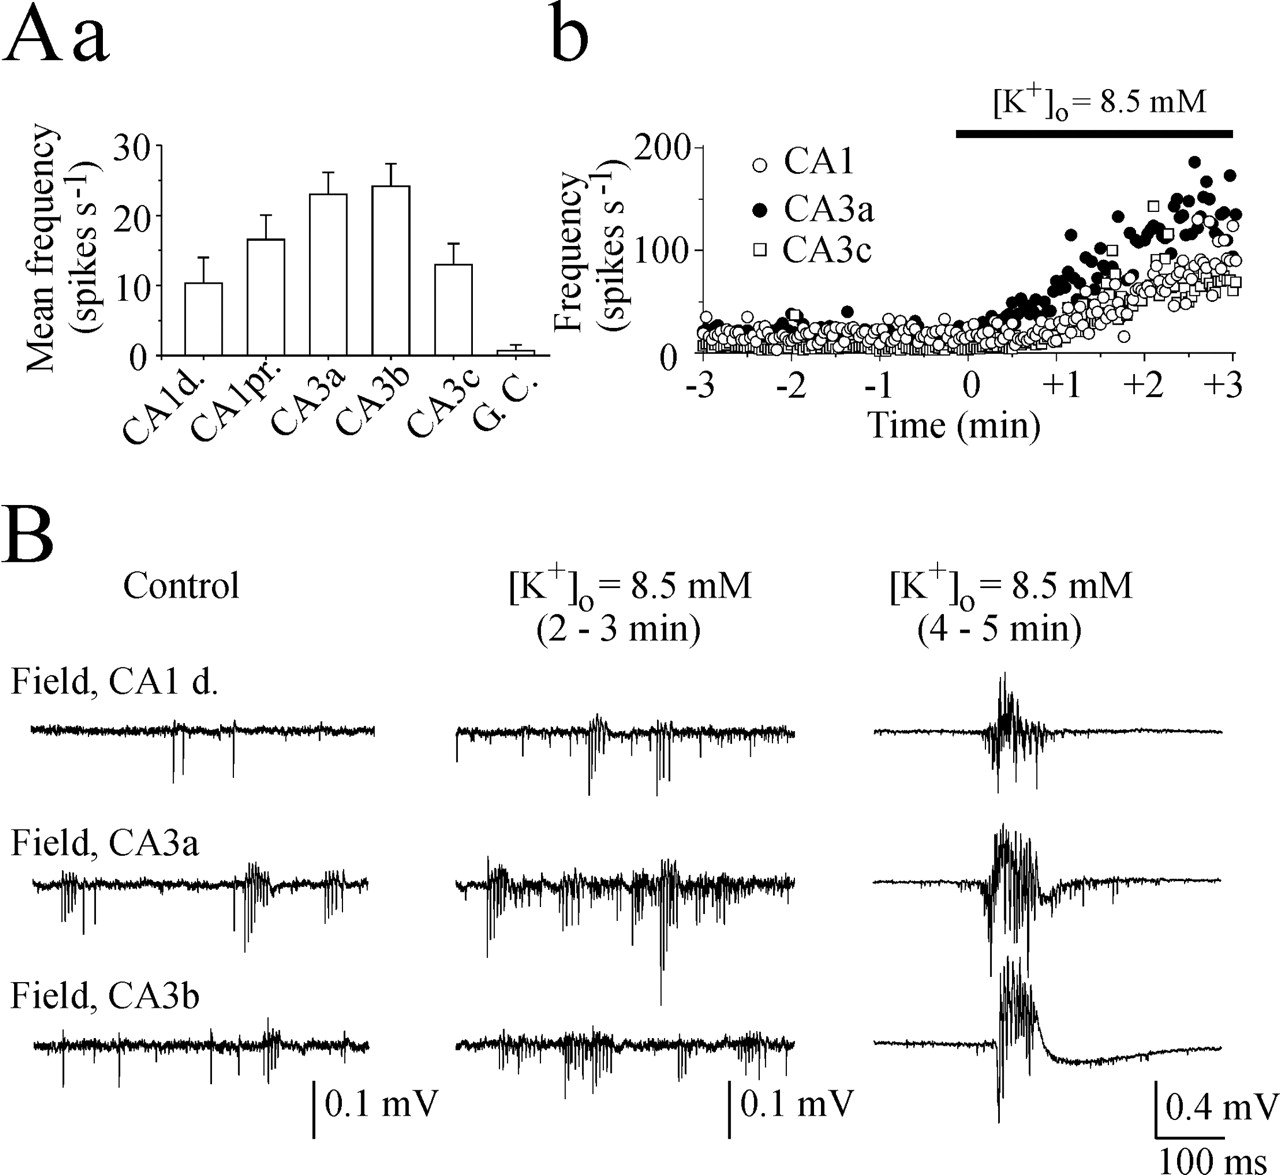
Effects of 8.5 mm [K+]o on spontaneous activity of CA3 and CA1 cells. Aa, Averaged frequency of spontaneous MUA in the pyramidal cell layer of different CA3 and CA1 areas and in the granular cell layer of the dentate gyrus in a P15-P16 hippocampal-entorhinal cortex slices. Ab, Progressive increase in spike frequency as [K+]o was increased to 8.5 mm. B, Bath application of 8.5 mm [K+]o increased neuronal firing rate, resulting in synchronous network-driven population bursts. Selected traces depict extracellular activity in the CA3a, CA3b, and distal CA1 pyramidal cell layer in control and after high K+ application. Separation distance between electrodes, -600 μm; recording range, 0.1 Hz to 4 kHz.
- Figure 3.
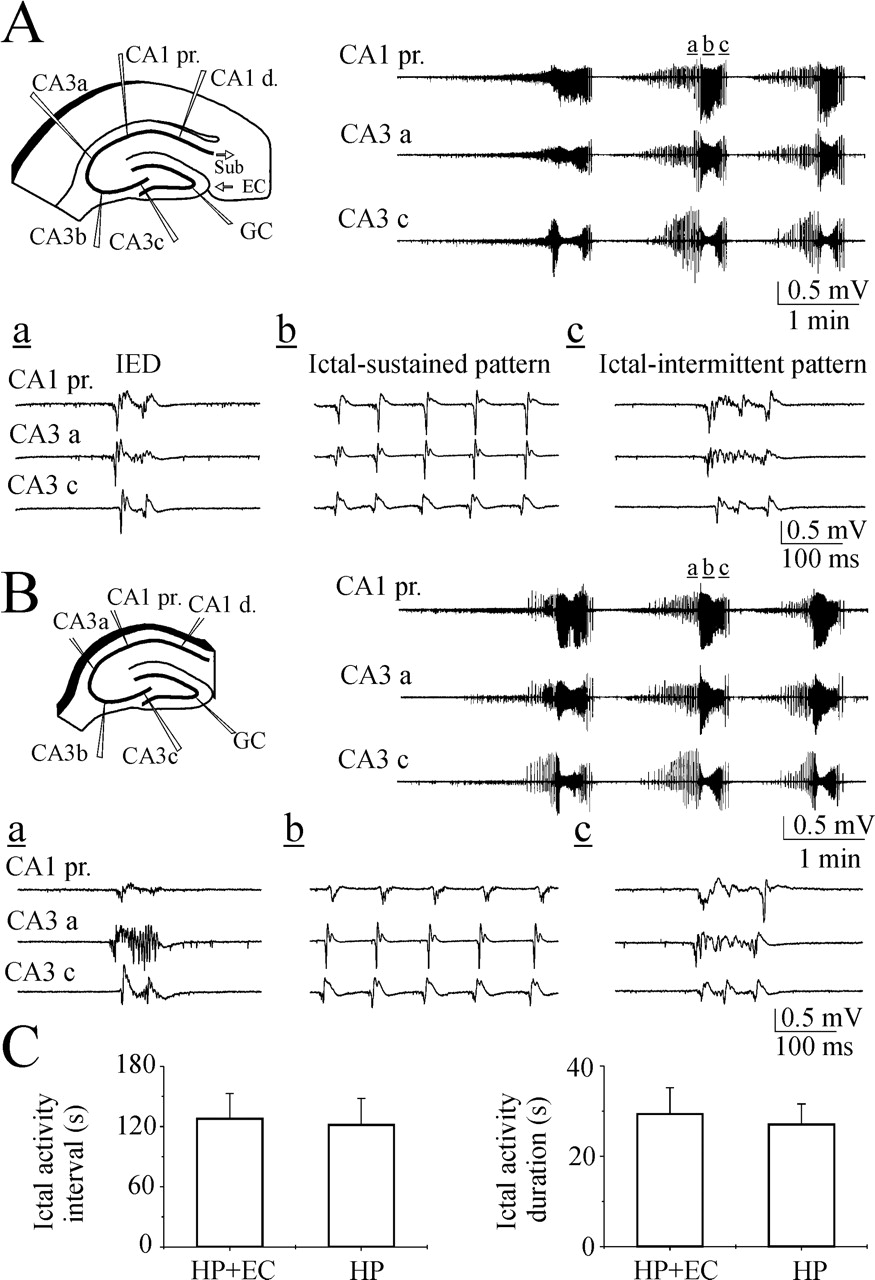
Hippocampal network is self-sufficient to generate recurrent ictal-like epileptiform activity. A, Scheme of extracellular field potential recordings (wide band, 0.1 Hz to 4 kHz) in the CA3a, CA3b, CA3c, and CA1 pyramidal cell layer in the hippocampal-entorhinal cortex slice of a P15 rat. Selected traces represent recurrent IEDs and ictal-like epileptiform discharges induced by continuous application of 8.5 mm [K+]o. The events marked by small letters (a-c) are shown on an extended time scale. B, Scheme of extracellular recordings from the same slice after removal of entorhinal cortex. Removing the entorhinal cortex does not affect 8.5 mm [K+]o-induced recurrent ictal-like epileptiform activity. C, Averaged ictal activity duration and interval in the hippocampal slices before and after removal of entorhinal cortex. At the p = 0.05 level, the two means are not significantly different.
- Figure 5.
Pre-ictal alterations in hippocampal network activity. A, Extracellular field recordings from five electrodes placed in CA3a, CA3b, CA3c, and CA1 (proximal and distal to CA3a) pyramidal cell layers in P16 hippocampal slice preparation (interelectrode distances, 0.6 mm). The relative time delays of all IEDs and ictal epileptiform discharges are shown as pseudocolors. Colors were derived using a sliding 1 msec time window, with onsets measured from the (negative) peak of the initial population spike. The IED initiation area shifts before ictal-like epileptiform activity from CA3a to CA3c-hilus, and ictal-sustained discharges originate in CA3c. Bottom traces show the origin and propagation of epileptiform discharges on an extended time scale. B, Ictal activity onset can be anticipated on the basis of the shift in the area of origin of pre-ictal IEDs. Open circles correspond to the IEDs initiated in CA3a and propagated to CA3c; colored circles indicate reversed IED propagation (i.e., IEDs originating in CA3c and propagating to CA3a). Several examples are shown for seizures produced by high extracellular K+ (left) and the K+-channel blocker 4-AP (100 μm; right). For each example, the slice number as well as the seizure number for that slice (slice/seizure number) are indicated along the origin of each panel.
- Figure 4.
Changes in IED power spectra before transition to ictal-like activity. A, Continuous extracellular record of interictal and ictal-like activity in the CA3b pyramidal cell layer. The trace is selected from simultaneous extracellular field recordings in the CA1, CA3a, CA3b, and CA3c regions of P16 rat hippocampal slice. Epileptiform activity was induced by high K+ (8.5 mm) bath application. A, a-f, Examples of IEDs during interictal state and before transition to ictal-like activity. IED duration progressively increased in secondary afterdischarges appeared during the 20-30 sec period before ictal-like activity generation. B, Power spectra of interictal epileptiform discharges in 20 sec windows preceding transition to ictal-like activity. C, Averaged IED power in frequency bands from 1 to 100 Hz (EEG band) and from 200 to 500 Hz (fast field ripple band) in each 20 sec window preceding transition to ictal-like activity. Data from 10 extracellular field potential recordings in the CA3a and CA3b pyramidal cell layer in five P10-P16 rat hippocampal slices.
- Figure 6.
Pre-ictal shift in the IED initiation site and reverberation of secondary afterdischarges. Examples of simultaneous extracellular records from the CA3a and CA3c pyramidal cell layer represent consecutive interictal epileptiform discharges from the steady-state interictal (A), primary IED and secondary afterdischarges from the pre-ictal (B), and ictal-sustained discharges from the ictal (C) states. Note also the reverberations of the secondary afterdischarges from CA3a to CA3c in the pre-ictal phase. Population spike and secondary afterdischarge timing are marked with vertical dotted lines; (+) indicates their origin in the CA3c subregion, and (-) indicates origin in CA3a. Cross-correlation histograms represent relative delays in primary population spike and secondary afterdischarge timing in the CA3a area versus CA3c (bin 1 msec).
- Figure 7.
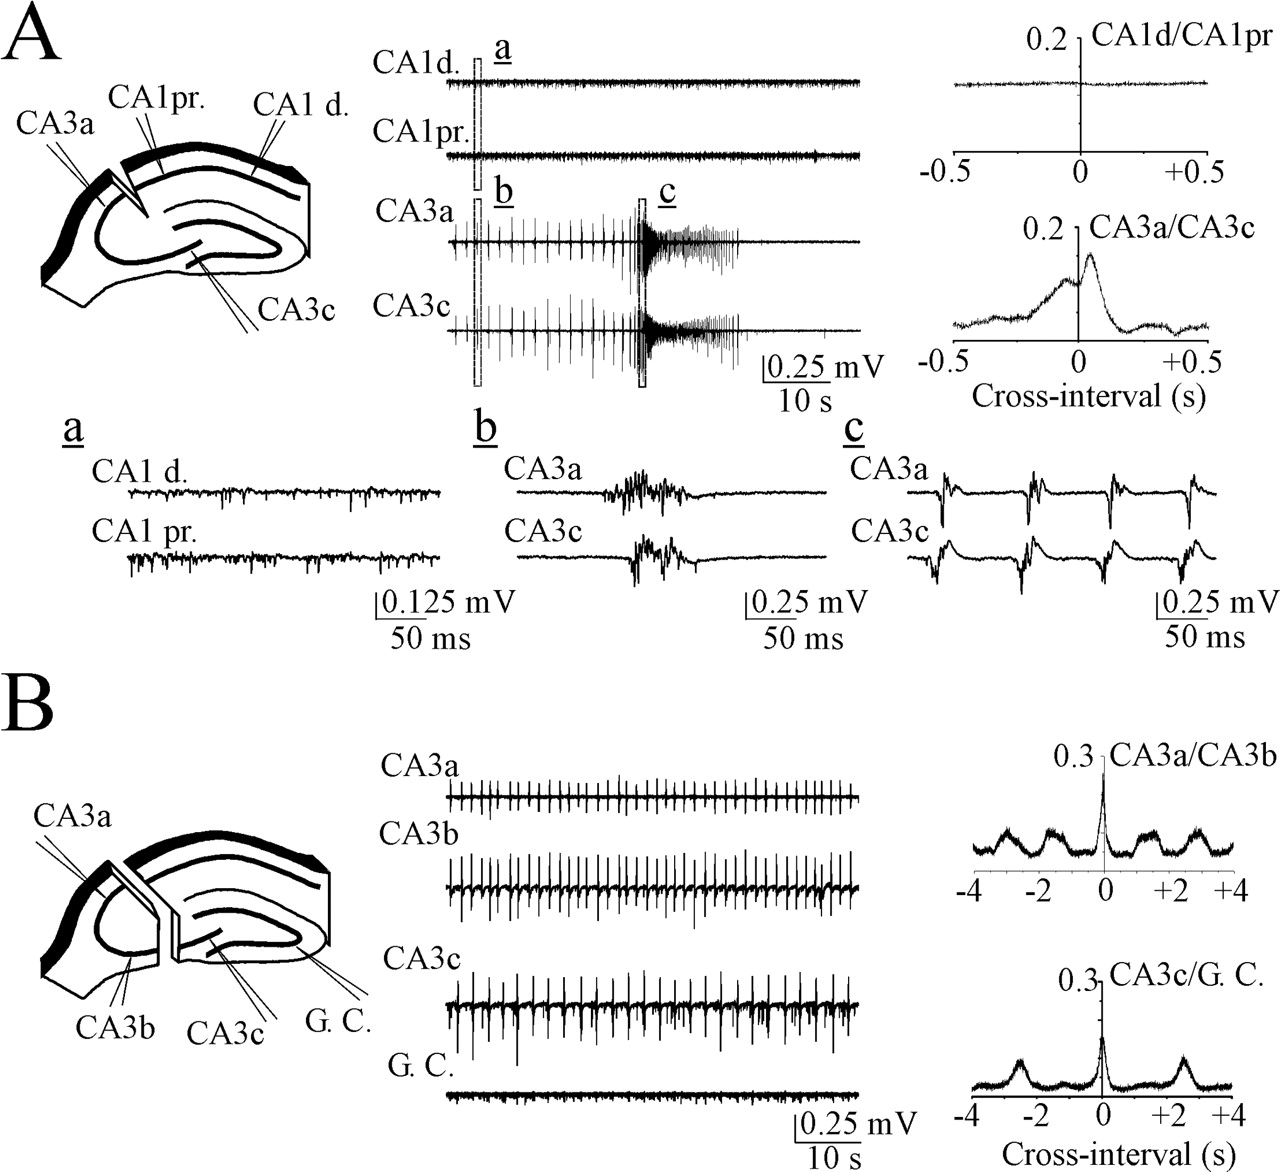
CA3 network paces interictal and ictal-like epileptiform activity. A, Severing the connections between CA3 and CA1 areas abolished interictal and ictal-like epileptiform activity in the CA1 region but did not affect epileptiform activity in CA3. Right, Cross-correlations of the MUA detected in the distal CA1 area versus proximal CA1 (top) and in the CA3a versus CA3c (bottom). Two peaks correspond to the interictal phase discharges initiated by CA3a (left peak) and pre-ictal phase discharges initiated by CA3c (right peak). The events marked by small letters (a-c) are shown on an extended time scale. B, Scheme of extracellular field recordings in the isolated portions of hippocampus. Electrodes are positioned in the pyramidal cell layer of the isolated CA3a-CA3b and CA3c dentate gyrus subfields. Right, Cross-correlations of the MUA in CA3a versus CA3b (top) and in CA3c versus granular cell layer of the dentate gyrus (bottom). The frequency of the CA3a-b generator was higher than the frequency of the CA3c generator. A, B, Epileptiform discharges induced by 8.5 mm [K+]o.


