

Article Figures & Data
Figures
- Figure 1.
Immunopurification of MiRP2-Kv2.1 and MiRP2-Kv3.1 complexes from mammalian brain. A, Northern blot analysis showing distribution of MiRP2 mRNA in adult human brain and spinal cord. Numbers indicate migration distances of 1.35, 2.4, and 4.4 kb markers. B, RT-PCR of MiRP2 from mRNA isolated from E18, 12 DIV rat primary hippocampal neurons. Numbers indicate corresponding molecular weight marker migration distances in base pairs. Products were amplified by PCR from water control, hippocampal neuron mRNA before RT-PCR, or hippocampal neuron mRNA after RT-PCR. The identity of the 596 bp amplicon was confirmed by sequencing as MiRP2 (M2). C, Anti-MiRP2 antibody immunoblots of rat MiRP2-transfected CHO cell lysate (rMiRP2 CHO), mock-transfected CHO cell lysate (con CHO), or rat brain membranes (rat brain m). D, Anti-Kv2.1 antibody immunoblots of crude rat brain membranes (rat brain m), Kv2.1-transfected CHO cell lysate (Kv2.1 CHO), or immunoprecipitations from rat brain membranes using antibodies raised against Kv2.1 (α-Kv2.1 IP), Kv3.1 (α-Kv3.1 IP), parvalbumin (α-parv IP), or MiRP-2 (α-MiRP2 IP). E, Anti-Kv3.1 antibody immunoblots of crude rat brain membranes (rat brain m), Kv2.1-transfected CHO cell lysate (Kv2.1 CHO), or immunoprecipitations from rat brain membranes using antibodies raised against Kv2.1 (α-Kv2.1 IP), Kv3.1 (α-Kv3.1 IP), parvalbumin (α-parv IP), or MiRP-2 (α-MiRP2 IP).
- Figure 2.
MiRP2 colocalizes with heterologously expressed Kv2.1 and Kv3.1 subunits in CHO cell plasma membranes. Fluorescence microscopy of fixed and permeabilized CHO cells, either nontransfected or transiently transfected with plasmids encoding HA-tagged MiRP2 or untagged Kv2.1 or Kv3.1. Cells were stained with monoclonal anti-HA and polyclonal anti-Kv2.1 or polyclonal anti-Kv3.1 primary antibodies, and Alexa Fluor 594-labeled (red) goat anti-rabbit IgG and FITC-labeled (green) goat anti-mouse IgG secondary antibodies. Scale bars, 10 μm. A, Red-green overlay of nontransfected cells stained with anti-HA and anti-Kv2.1 antibodies showing no signal. B, Red-green overlay of nontransfected cells stained with anti-HA and anti-Kv3.1 antibodies showing no signal. C, Red-green overlay of HA-MiRP2-transfected cell stained with anti-HA antibody showing predominantly cytoplasmic distribution of HA-MiRP2 (green) when transfected alone. D-F, HA-MiRP2 and Kv2.1 cotransfected cell stained with anti-HA and anti-Kv2.1 antibodies; D, green signal showing membrane distribution of HA-MiRP2; E, red signal showing membrane distribution of Kv2.1; F, red-green overlay showing colocalization (yellow) of HA-MiRP2 and Kv2.1. G-I, HA-MiRP2 and Kv3.1 cotransfected cell stained with anti-HA and anti-Kv3.1 antibodies; G, green signal showing membrane distribution of HA-MiRP2; H, red signal showing membrane distribution of Kv3.1; I, red-green overlay showing colocalization (yellow) of HA-MiRP2 and Kv3.1.
- Figure 3.
MiRP2 slows and downregulates Kv2.1 currents. A, Exemplar traces showing currents recorded using protocol 1 (inset) in nontransfected CHO cells (untrans) or CHO cells cotransfected with GFP and either MiRP2, Kv2.1 (filled square), or MiRP2 plus Kv2.1 (open square), as indicated. Top center and top right traces, expanded view of first 150 msec of Kv2.1 and MiRP2-Kv2.1 traces, as indicated by dashed lines. B,Mean peak current density for CHO cells expressing Kv2.1 alone (filled squares; n = 19) or MiRP2 and Kv2.1 (open squares; n = 10); protocol as in A. Error bars indicate SEM. The double asterisk indicates significant difference between current densities at all voltages between -20 and +60 mV (unpaired t test;p<0.01). C, Current density-normalized early portion of exemplar Kv2.1 and MiRP2-Kv2.1 traces at 0 mV illustrating slowing of Kv2.1 activation by MiRP2. D, Activation rates of Kv2.1 and MiRP2-Kv2.1 currents at different voltages as in B, fitted with a single exponential function, expressed as τact. Error bars indicate SEM. The double asterisk indicates significant difference between τact at all voltages between -20 and +60 mV (unpaired t test, p < 0.01). E, Time to peak current of Kv2.1 and MiRP2-Kv2.1 currents as in B. Error bars indicate SEM. The double asterisk indicates significant difference between times to reach peak at all voltages between -20 and +60 mV (unpaired t test; p < 0.01). F, Mean activation rates of Kv2.1 and MiRP2-Kv2.1 currents at 0 mV as in B, fitted with a double exponential function, error bars indicate SEM. Left, Mean slow and fast τact components; the double asterisk indicates significant difference between the fast components of τact (unpaired t test; p < 0.01). Right, Mean relative amplitudes of the slow component of τact; the single asterisk indicates significant difference (unpaired t test; p < 0.05). G, Mean deactivation rates of Kv2.1 and MiRP2-Kv2.1 currents at -30 mV as in B, fitted with a double exponential function; error bars indicate SEM. Left, Mean slow and fast τdeact components; the single and double asterisks indicate significant differences between the corresponding components of τdeact depending on the presence of MiRP2 (unpaired t tests; p < 0.05 and p < 0.01, respectively). Right, Mean relative amplitudes of the slow component of τdeact; the double asterisk indicates significant difference (unpaired t test; p < 0.01). H, TEA block of Kv2.1 (solid) versus MiRP2-Kv2.1 (open) currents evaluated using protocol 3 (inset) in the absence and presence of 0-30 mm TEA bath and peak currents recorded at equilibrium. Dose-response curves were fit with a logistic dose-response function: y = A2 + (A1-A2 /1 + (x/x0)p); for Kv2.1 x0 = 11.7 ± 2.7 mm, p = 0.92 ± 0.19; for MiRP2-Kv2.1 x0 = 6.7 ± 0.79 mm, p = 0.92 ± 0.08; n = 5 cells per point. I, 4-AP block of Kv2.1 (solid) versus MiRP2-Kv2.1 (open) currents evaluated using protocol 3 (inset) in the absence and presence of 0-10 mm 4-AP and peak currents recorded at equilibrium. Dose-response curves were fit with a logistic dose-response function: y = A2 + (A1-A2/1 + (x/x0)p); for Kv2.1 x0 = 3.9 ± 0.79 mm, p = 0.68 ± 0.09; for MiRP2-Kv2.1 x0 = 4.2 ± 1.4 mm, p = 0.66 ± 0.14; n = 5 cells per point.
- Figure 4.
MiRP2 downregulates and reduces inactivation of Kv3.1 currents. A, Bottom, Exemplar traces showing currents recorded using protocol 2 (inset) in CHO cells cotransfected with GFP and MiRP2, Kv3.1 (filled square), or MiRP2 plus Kv3.1 (open square), as indicated. Top, Expanded view of first 40 msec of Kv3.1 and MiRP2-Kv3.1 traces as indicated by dashed lines. B, Mean peak current density for CHO cells expressing Kv3.1 alone (filled squares; n = 31) or MiRP2 plus Kv3.1 (open squares; n = 32); protocol as in A. The error bars indicate SEM. The double asterisk indicates significant difference between current densities at all voltages between -10 and +60 mV (unpaired t test; p < 0.01). C, Current density-normalized early portion of exemplar Kv3.1 and MiRP2-Kv3.1 traces at 0 mV illustrating slowing of Kv3.1 activation largely by removal of the current inactivation spike by MiRP2. D, Activation rates of Kv3.1 and MiRP2-Kv3.1 currents at different voltages as in B, fitted with a single exponential function, expressed as τact. Error bars indicate SEM. The double asterisk indicates significant difference between τact at all voltages between -20 and +60 mV (unpaired t test; p < 0.01).E, Time to peak current of Kv3.1 and MiRP2-Kv3.1 currents as in B. Error bars indicate SEM. The asterisk indicates significant difference between times to reach peak at all voltages between -20 and +60 mV (unpaired t test; p < 0.05). F, Effects of MiRP2 on early inactivation of Kv3.1 currents, assessed by comparing peak current in first 100 msec of activation to current at exactly 100 msec after activation. The asterisk indicates significant difference between respective values at voltages between 30 and 60 mV (unpaired t test; p < 0.05). G, Mean activation rates of Kv3.1 and MiRP2-Kv3.1 currents at 0 mV as in B, fitted with a double exponential function. Error bars indicate SEM. Left, Mean slow and fast τact components. The double asterisk indicates significant difference between the corresponding components of τact depending on the presence of MiRP2 (unpaired t test; p < 0.01). Right, Mean relative amplitudes of the slow component of τact. The double asterisk indicates significant difference (unpaired t test; p < 0.01). H, Mean deactivation rates of Kv3.1 and MiRP2-Kv3.1 currents at -30 mV as in B, fitted with a double exponential function. Error bars indicate SEM. Left, Mean slow and fast τdeact components. Right, Mean relative amplitudes of the slow component of τdeact. No significant differences were observed between Kv3.1 and MiRP2-Kv3.1 deactivation rates. I, TEA block of Kv3.1 (solid) versus MiRP2-Kv3.1 (open) currents evaluated using protocol 3 (inset) in the absence and presence of 0-10 mm TEA bath and peak currents recorded at equilibrium. Dose-response curves were fit with a logistic dose-response function: y = A2 + (A1-A2/1 + (x/x0)p); for Kv3.1 x0 = 471 ± 98 μm, p = 0.76 ± 0.08; for MiRP2-Kv3.1 x0 = 254 ± 42 μm, p = 0.86 ± 0.09; n = 4-6 cells per point. J, 4-AP block of Kv3.1 (solid) versus MiRP2-Kv3.1 (open) currents evaluated using protocol 3 (inset) in the absence and presence of 0-1 mm 4-AP and peak currents recorded at equilibrium. Dose-response curves were fit with a logistic dose-response function: y = A2 + (A1-A2/1 + (x/x0)p); for Kv3.1 x0 = 58 ± 0.9 μm, p = 0.8 ± 0.01; for MiRP2-Kv3.1 x0 = 43 ± 6 μm, p = 0.8 ± 0.06; n = 4-6 cells per point.
- Figure 5.
MiRP2 colocalizes with native Kv2.1 and Kv3.1 subunits in PC12 cell plasma membranes. Fluorescence microscopy of fixed and permeabilized PC12 cells, either nontransfected or transiently transfected with a plasmid encoding HA-tagged MiRP2. Cells were stained with monoclonal anti-HA, polyclonal anti-Kv2.1, or polyclonal anti-Kv3.1 primary antibodies, Alexa Fluor 594-labeled (red) goat anti-rabbit IgG and FITC-labeled (green) goat anti-mouse IgG secondary antibodies. Scale bars, 10 μm. A, Nontransfected PC12 cells stained with anti-HA and anti-Kv2.1 antibodies showing: left, green channel, no HA staining; center, red channel, punctate native Kv2.1 staining; right, red-green overlay. B, HA-MiRP2-transfected PC12 cells stained with anti-HA and anti-Kv2.1 antibodies showing: left, green channel, punctate HA-MiRP2 staining; center, red channel, punctate native Kv2.1 staining; right, red-green overlay showing HA-MiRP2/native Kv2.1 colocalization (yellow). C, Nontransfected PC12 cells stained with anti-HA and anti-Kv3.1 antibodies showing: left, green channel, no HA staining; center, red channel, punctate native Kv3.1 staining; right, red-green overlay. D, HA-MiRP2-transfected PC12 cells stained with anti-HA and anti-Kv3.1 antibodies showing: left, green channel, HA-MiRP2 staining; center, red channel, native Kv3.1 staining; right, red-green overlay showing HA-MiRP2/native Kv3.1 colocalization (yellow).
- Figure 6.
Native MiRP2 slows and downregulates native delayed rectifier currents in PC12 cells. A, RT-PCR of Kv2.1 (top) and Kv3.1 (bottom) from mRNA isolated from PC12 cells. Lanes indicate amplification by PCR from: lane 1, water control; lane 2, mRNA from PC12 cells after RT-PCR; lane 3, mRNA from PC12 cells before RT-PCR; lane 4, plasmid DNA containing Kv2.1 (top) or Kv3.1 (bottom); lane 5, marker. Expected product sizes for gene fragments, indicated by labeled lines, were 557 bp for Kv2.1 and 522 bp for Kv3.1. B, RNAi gene silencing of endogenous MiRP2 assessed by semiquantitative PCR of products from RT-PCR of PC12 cell mRNA. Top gel, Normalization of RT-PCR products by titration of amplified β-actin; lanes show approximately equal β-actin band intensities. Bottom gel, RT-PCR for rMiRP2 using normalized samples. Top and bottom gels, Lane 1, Marker; lane 2, water control; lane 3, nontransfected PC12 cell RT-PCR product; lane 4, MiRP2 siRNA-transfected PC12 cell RT-PCR product; lane 5, MiRP2 cDNA-transfected PC12 cell RT-PCR product. Expected product sizes for gene fragments, indicated by labeled lines, were 450 bp for actin, and 596 bp for MiRP2. C, Exemplar traces showing potassium currents recorded using protocol 4 (inset) in nontransfected PC12 cells (black circle, untrans) or PC12 cells transfected with MiRP2 cDNA (open circle, M2 cDNA), MiRP2 siRNA (gray square, M2 siRNA), or scrambled control siRNA (black square, con siRNA). Cotransfection with blank plasmid was used to keep total transfected nucleic acid concentration equal. D, Mean peak current for nontransfected PC12 cells (black circle; n = 39) or PC12 cells transfected with MiRP2 cDNA (open circle; n = 16), MiRP2 siRNA (gray square; n = 14), or scrambled control siRNA (black square; n = 16); protocol as in C. Error bars indicate SEM. The double asterisks indicate significant differences between current densities of MiRP2 cDNA transfected versus MiRP2 siRNA or nontransfected cells at all positive voltages (Mann-Whitney rank sum test; p < 0.001). The single asterisk indicates significant difference between current densities of MiRP2 siRNA transfected versus nontransfected cells at voltages between +30 and +60 mV (Mann-Whitney rank sum test; p < 0.05). E, Mean inactivation of PC12 cell outward potassium currents at +60 mV expressed as percentage inactivation over 1 sec, in nontransfected (untrans) and transfected PC12 cells as indicated, calculated from the same traces as in D. The double asterisk indicates significant difference between mean inactivation of MiRP2 cDNA transfected versus MiRP2 siRNA-transfected cells (unpaired t test; p < 0.001). F, Trace resulting from subtraction of averaged +60 mV trace for MiRP2 cDNA-transfected PC12 cells from averaged +60 mV trace for MiRP2 siRNA-transfected PC12 cells; protocol (inset) as in C. G, Mean activation rates of nontransfected (untrans) and transfected PC12 cells as indicated, calculated from the same recordings as in D. Activation traces at 0 mV were fitted with a double exponential function yielding fast and slow τact components. Error bars indicate SEM. A single asterisk indicates a significant difference between the slow components of τact of PC12 cells transfected with control siRNA and those transfected with MiRP2 siRNA (unpaired t test; p < 0.05). Relative amplitudes of the slow components of activation were not significantly different and were 0.63 ± 0.05 (nontransfected), 0.54 ± 0.1 (MiRP2 cDNA), 0.58 ± 0.08 (MiRP2 siRNA), and 0.55 ± 0.1 (scrambled control siRNA). H, Mean deactivation rates of nontransfected (untrans) and transfected PC12 cells as indicated, calculated from the same recordings as in D. Deactivation traces at -30 mV were fitted with a double exponential function yielding fast and slow τdeact components. Error bars indicate SEM. Relative amplitudes of the slow components of deactivation were not significantly different and were 0.31 ± 0.03 (nontransfected), 0.25 ± 0.09 (MiRP2 cDNA), 0.25 ± 0.09 (MiRP2 siRNA), and 0.38 ± 0.06 (scrambled control siRNA).
- Figure 7.
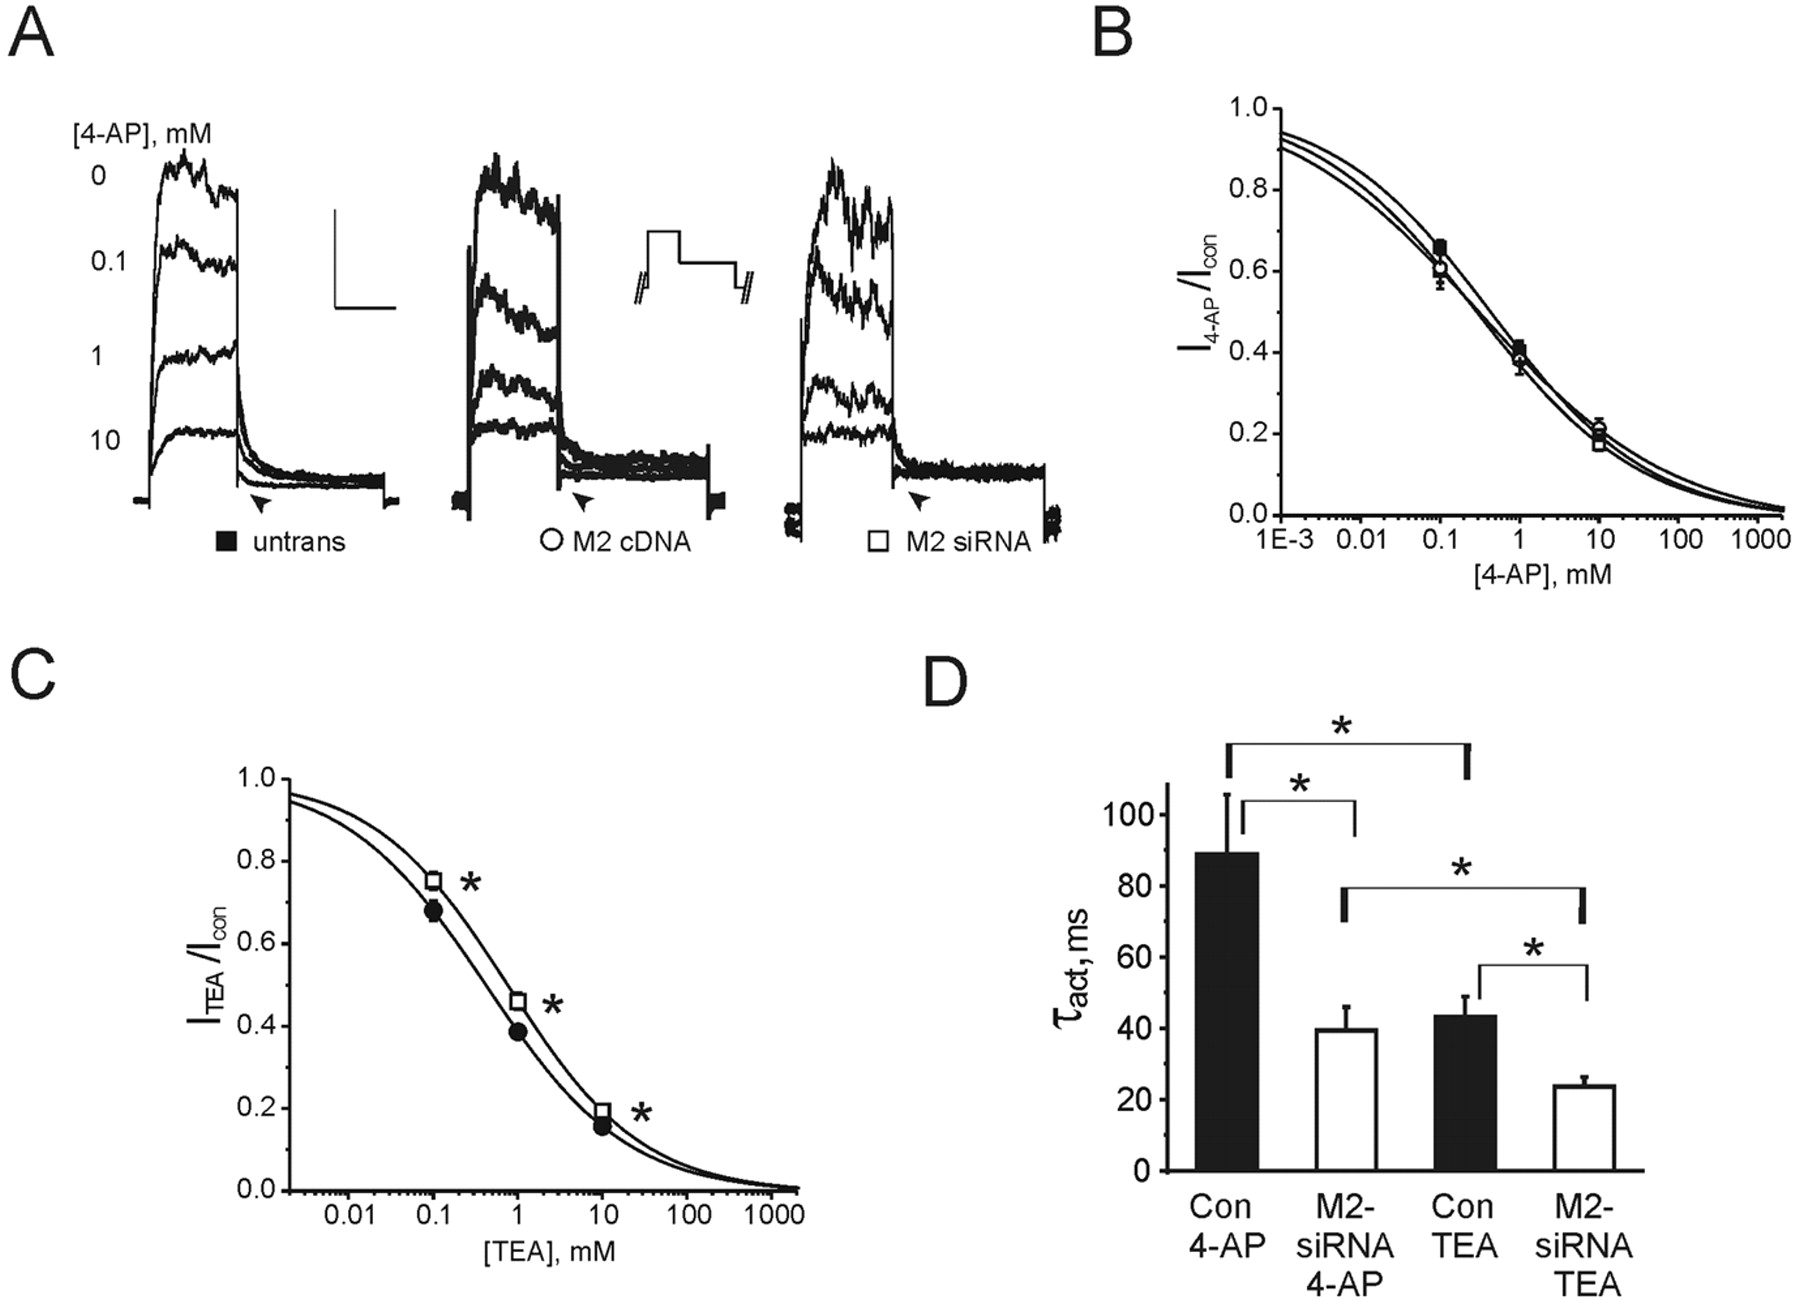
Relationship between TEA and 4-AP sensitivities, activation kinetics, and MiRP2 expression in PC12 cells. A, Exemplar outward potassium current traces recorded using protocol 6 (inset) during bath application of 0-10 mm 4-AP block (as indicated) of whole-cell outward potassium currents at 0 mV in nontransfected PC12 cells and PC12 cells transfected with MiRP2 cDNA or MiRP2 siRNA, as indicated; 0 mV portion of trace only is shown here. Arrows highlight block of tail current in all cases. Calibration represents current (50 pA, nontransfected; 15 pA, MiRP2 cDNA; 25 pA, MiRP2 siRNA) and time (200 msec). B, 4-AP inhibition of outward potassium currents in untransfected PC12 cells (black circles; n = 12) and PC12 cells transfected with MiRP2 siRNA (white squares; n = 9) or MiRP2 cDNA (white circles; n = 10). PC12 cells were repetitively pulsed using protocol 6 in the absence and presence of 0-10 mm 4-AP and isochronal (450 msec after activation) currents recorded at equilibrium. Dose-response curves were fit with a Boltzmann function. IC50 values were: 440 ± 71 μm, slope of 0.43 ± 0.03 (nontransfected); 291 ± 97μm, slope of 0.42 ± 0.05 (MiRP2 siRNA transfected); 307 ± 115 μm, slope of 0.36 ± 0.06 (MiRP2 cDNA transfected). Sensitivity of PC12 currents to inhibition by 4-AP was not significantly altered by transfections, as assessed by repeated measures ANOVA; p > 0.05. C, TEA inhibition of outward potassium currents in untransfected PC12 cells (black circles; n = 22) or PC12 cells transfected with MiRP2 siRNA (white squares; n = 18). PC12 cells were repetitively pulsed using protocol 6 in the absence and presence of 0-10 mm TEA bath and isochronal (450 msec after activation) currents recorded at equilibrium. Dose-response curves were fit with a Boltzmann function. IC50 values were: 420 ± 54 μm, slope of 0.52 ± 0.03 (nontransfected); 765 ± 109 μm, slope of 0.55 ± 0.04 (MiRP2 siRNA transfected). The asterisks indicate that a significant shift in the sensitivity of PC12 currents to inhibition by TEA was significantly affected by transfection of MiRP2 siRNA, as assessed by repeated measures ANOVA; p < 0.05. D, Mean activation rates of potassium currents in nontransfected (Con; n = 8-11) and MiRP2 siRNA-transfected (M2-siRNA; n = 10-18) PC12 cells equilibrated with bath concentrations of 10 mm 4-AP or TEA as indicated, calculated from recordings similar to those in A. Activation traces at 0 mV were fitted with a single exponential function yielding a τact value. Error bars indicate SEM. The asterisks indicate significant differences between the τact values of nontransfected or MiRP2 siRNA-transfected PC12 cells in the presence of either drug and between the τact values of similarly transfected cells, depending on the drug applied (unpaired t test; p < 0.05).
- Figure 8.
MiRP2 colocalizes with Kv2.1 but not Kv3.1 subunits in rat primary hippocampal neurons. Fluorescence microscopy of fixed and permeabilized E18, 12-14 DIV rat primary hippocampal neurons cells, either nontransfected or transiently transfected with a plasmid encoding HA-tagged MiRP2. Cells were stained with monoclonal anti-HA, monoclonal anti-MAP2, polyclonal anti-Kv2.1, or polyclonal anti-Kv3.1 primary antibodies, Alexa Fluor 594-labeled (red) goat anti-rabbit IgG and FITC-labeled (green) goat anti-mouse IgG secondary antibodies. Scale bars, 10 μm. A, Immunostaining of native Kv2.1 (red; arrowhead) and native MAP2 (green) in nontransfected E18, 14 DIV rat primary hippocampal neurons. Left, Green-red overlay; top inset, red only; bottom inset, green only. B, Immunostaining of diffusely (left arrowhead) and punctately (right arrowhead) distributed native Kv3.1 (red) and native MAP2 (green) in nontransfected E18, 14 DIV rat primary hippocampal neurons. Left, Green-red overlay; top inset, red only; bottom inset, green only. C, Immunostaining with anti-Kv2.1 (red) and anti-HA antibodies (green) in the soma of a representative nontransfected E18, 14 DIV rat primary hippocampal neuron, showing lack of any anti-HA signal but punctate staining of endogenous Kv2.1 (arrowhead). Left, Green-red overlay; top inset, red only; bottom inset, green only. D, Immunostaining with anti-Kv2.1 (red) and anti-HA antibodies (green) in the soma of a representative HA-MiRP2-transfected E18, 14 DIV rat primary hippocampal neuron, showing colocalization (yellow) of HA-MiRP2 and endogenous Kv2.1 (arrowhead) in somatic plasma membrane and dendrites (arrow). Left, Green-red overlay; top inset, red only; bottom inset, green only. E, Immunostaining with anti-Kv3.1 (red) and anti-HA antibodies (green) in the soma of a representative HA-MiRP2-transfected E18, 14 DIV rat primary hippocampal neuron, showing efficient transfection but lack of colocalization (yellow) of HA-MiRP2 and endogenous neuronal Kv3.1. Left, Green-red overlay; top inset, red only; bottom inset, green only. F, Close-up showing immunostaining with anti-Kv3.1 (red) and anti-HA antibodies (green) in the soma of a representative HA-MiRP2-transfected E18, 14 DIV rat primary hippocampal neuron. The panel illustrates efficient transfection and punctate distribution of HA-MiRP2 and native Kv3.1 but lack of colocalization (yellow) of HA-MiRP2 and endogenous neuronal Kv3.1. Occasional spots of yellow (arrowhead) appear to be rare and possibly coincidental overlap. Left, Green-red overlay; top inset, red only; bottom inset, green only.
- Figure 9.
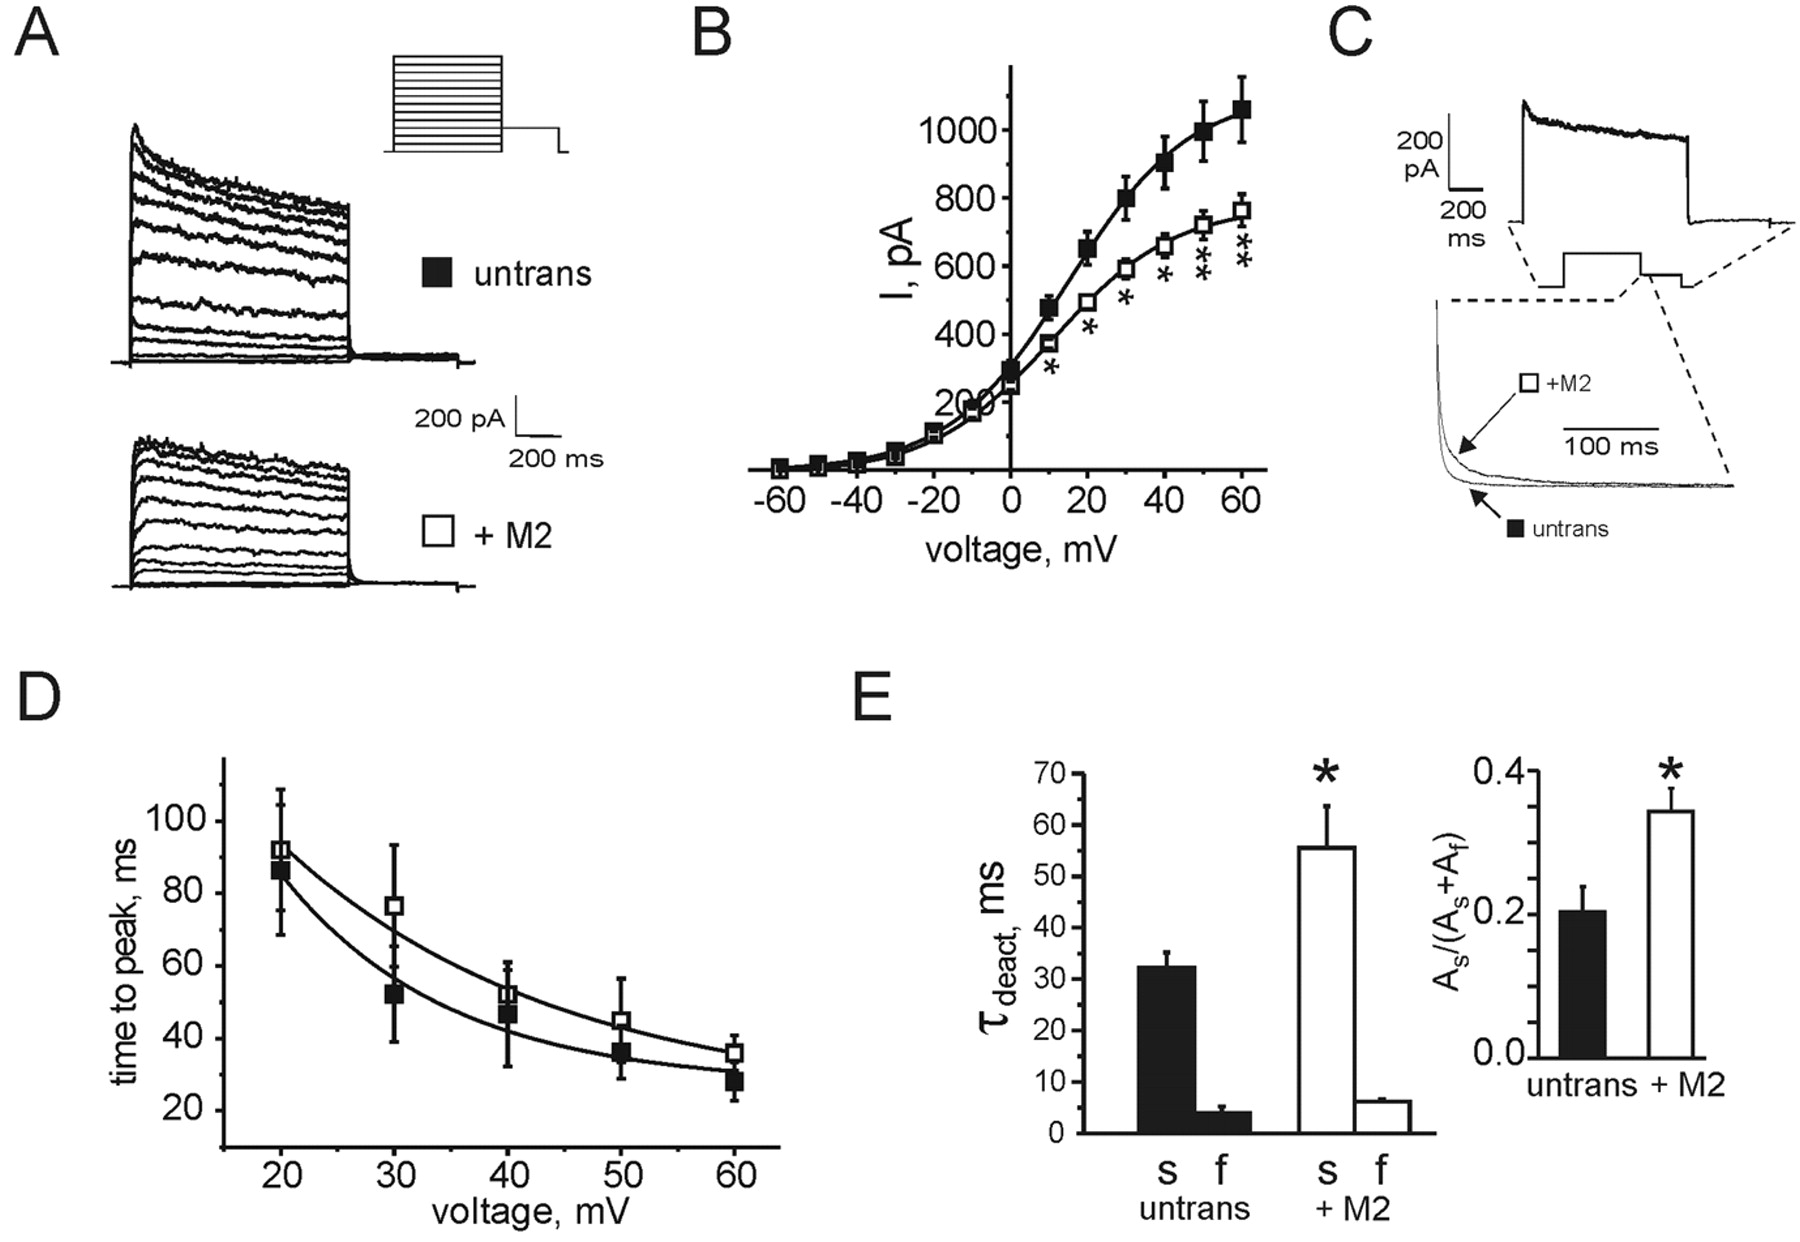
MiRP2 slows and downregulates native delayed rectifier currents in primary hippocampal neurons. A, Exemplar traces showing currents recorded using protocol 5 (inset) in nontransfected (untrans) or MiRP2-transfected (+M2) E18, 13 DIV rat primary hippocampal neurons. B, Mean peak current density for nontransfected (solid squares; n = 14) or MiRP2-transfected (open squares; n = 15) neurons; protocol as in A. Error bars indicate SEM. The asterisks denote significant difference between raw current magnitudes at voltages indicated (unpaired t test; *p < 0.05; **p < 0.01). C, Top trace, Trace resulting from subtraction of averaged +60 mV trace for MiRP2-transfected neurons from averaged +60 mV trace from nontransfected neurons; protocol as in A. The inset with dashed lines indicates corresponding points on current trace. Bottom trace, Current-normalized first 300 msec of -30 mV tail pulse from representative nontransfected (untrans) and MiRP2-transfected (+M2) neurons, showing slowing of deactivation by MiRP2. D, Time to peak current for nontransfected (solid squares; n = 14) or MiRP2-transfected (open squares; n = 15) neurons; protocol as in A. Error bars indicate SEM. Differences were not statistically significant (p > 0.05; unpaired t test). E, Mean deactivation rates at -30 mV for nontransfected (n = 14) or MiRP2-transfected (n = 15) neurons as indicated; protocol as in A. Error bars indicate SEM. Deactivation was fitted with a double exponential function. Left, Mean slow and fast τdeact components. The single asterisk indicates a significant difference between the slow components of τdeact, depending on transfection with MiRP2 (unpaired t test; p < 0.05). Inset, Mean relative amplitudes of the slow component of τdeact. The single asterisk indicates significant difference (unpaired t test; p < 0.05).
- Figure 10.
MiRP2 broadens action potentials and lowers firing frequency in computer simulations. A, Membrane potentials in model neurons expressing 150 nS conductance Kv3.1, 150 nS conductance MiRP2/Kv3.1, or 100 nS MiRP2/Kv3.1 as indicated, during a simulated current injection of 0.05 nA for 250 msec. To the right of each train is an expanded picture of the final spike of the train. Failure to reach 0 mV is indicated by a line labeled “failure.” B, Membrane potentials in model neurons expressing 150 nS conductance Kv3.1, 150 nS conductance MiRP2/Kv3.1, or 100 nS MiRP2/Kv3.1 as indicated, during simulated current injections of 1.4 nA for 0.25 msec at frequencies or 100, 200, 300, and 350 Hz, as indicated. To the right of each train is an expanded picture of the final one to two spikes of the train. Failure to reach 0 mV is indicated by a line labeled “failure.” The asterisk indicates one example of undershoot in a model neuron expressing Kv3.1 alone.


