

Article Figures & Data
Figures
- Figure 1.
Activation of D4 receptors reversibly reduced NMDA receptor currents in acutely dissociated PFC pyramidal neurons. A, Plot of peak NMDAR current showing that the D4 agonist PD168077 (20 μm) decreased NMDA (100 μm)-evoked currents in the cell. B, Representative current traces taken from the records used to construct A (at time points denoted by #). C, Plot of peak NMDAR current showing that dopamine (50 μm) decreased NMDAR currents in the presence of the D1/D5 antagonist SCH23390 (10μm) and the D2/D3 antagonist sulpiride (5μm). D, Cumulative data (mean ± SEM) showing the percentage reduction of NMDAR currents by different agonists: PD168077 (n = 156) and dopamine (in the presence of SCH23390 and sulpiride; n = 14). E, Plot of peak NMDAR current showing that the selective D4 antagonist l-741742 (10 μm) blocked PD168077-induced reduction of NMDAR currents. Inset, Representative current traces (at time points denoted by #). Calibration: 0.25 nA, 1 sec. F, Cumulative data (mean ± SEM) showing the percentage reduction of NMDAR currents by PD168077 in the absence (n = 37) or presence of l-745870 (10 μm; n = 22), l-741742 (10 μm; n = 9), or sulpiride (5 μm; n = 10) (*p < 0.005; ANOVA).
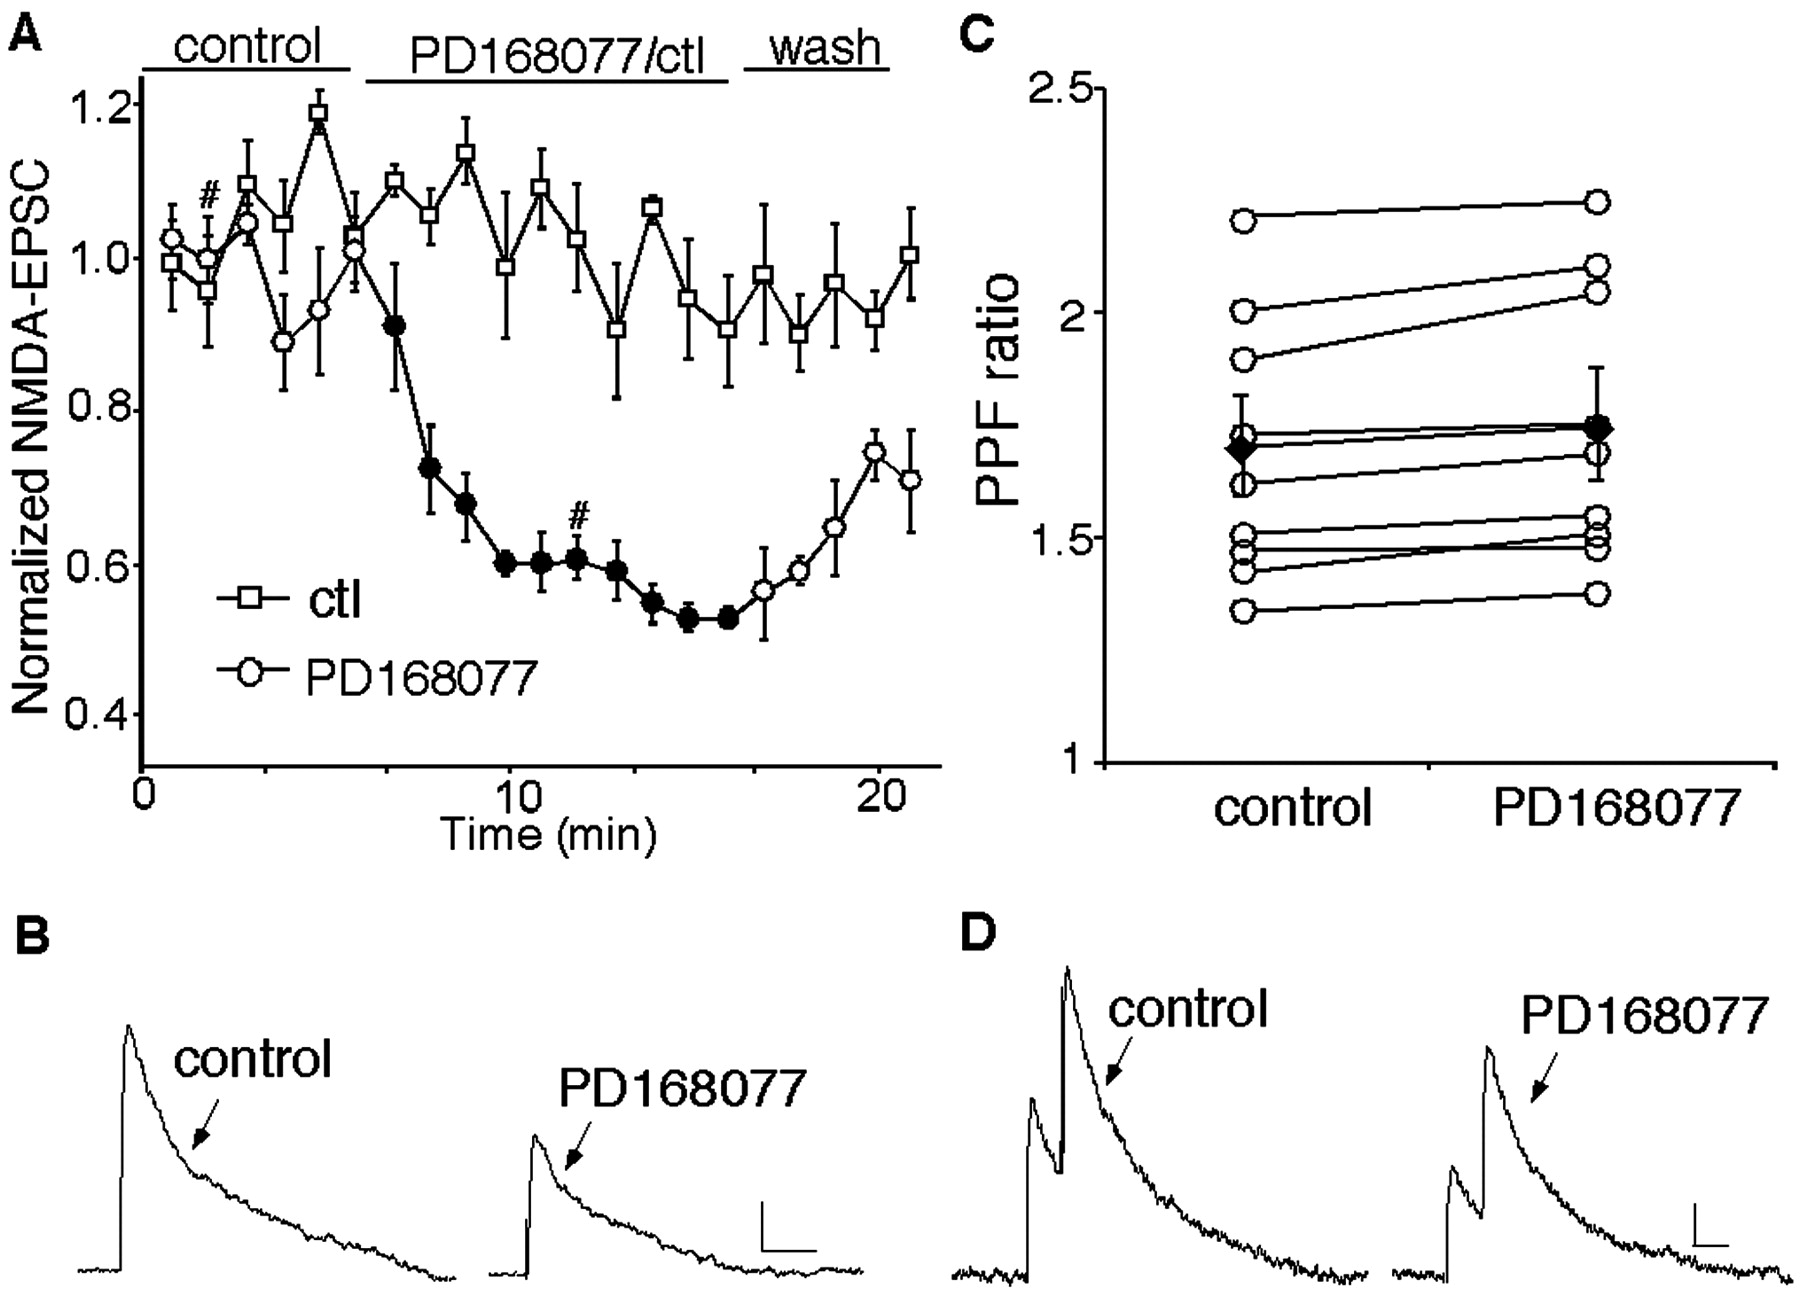
- Figure 2.
Activation of D4 receptors reduced the amplitude of NMDAR-mediated EPSCs in PFC slices but did not change the paired-pulse ratio of NMDAR EPSCs. A, Plot of peak evoked NMDAR EPSCs as a function of time and agonist application. NMDAR EPSCs were decreased by PD168077 (20μm) but remained stable in the control cell not subjected to the D4 agonist. Each point represents the average peak (mean ± SEM) of three consecutive NMDAR EPSCs. B, Representative current traces (average of 3 trials) taken from the records used to construct A (at time points denoted by #). Calibration: 50 pA, 100 msec. Stimulus artifacts were blanked. C, The ratio of paired-pulse facilitation (PPF) of NMDAR EPSCs (interstimuli interval: 100 msec) under control conditions and after application of PD168077. The filled squares (and error bars) indicate the mean (± SEM) of the ratio of PPF (n = 9). D, Representative NMDAR EPSCs (average of 3 trials) evoked by double pulses from a PFC neuron before (control) and after PD168077 application. Calibration: 50 pA, 100 msec.
- Figure 3.
The effect of PD168077 on NMDAR currents was dependent on PKA–PP1, but not PKC or PLC. A, Plot of peak NMDAR currents showing that application of the membrane-permeable myristoylated PKA inhibitor PKI[14–22] (1μm) reduced NMDAR currents and occluded the effect of subsequent application of PD168077 (20 μm). B, Plot of peak NMDAR currents showing that dialysis with the PLC inhibitor U73122 (5 μm) did not prevent the PD168077-induced reduction of NMDAR currents. Inset, Representative current traces (at time points denoted by #). Calibration: 0.25 nA, 0.5 sec. C, Cumulative data (mean ± SEM) showing the percentage reduction of NMDAR currents by PD168077 in the absence (n = 8) or presence of cpt-cAMP (50μm; n = 9), PKI (PKI[5–24]: 20μm, PKI[14–22]: 1μm; n = 20), PKC19–36 (20μm; n = 8), or U73122 (n = 12) (*p < 0.005; ANOVA). D, Plot of peak NMDAR currents showing that the membrane-permeable PP1–2A inhibitor OA (0.5 μm) blocked the ability of PD168077 (20μm) to reduce NMDAR currents. Inset, Representative current traces (at time points denoted by #). Calibration: 0.1 nA, 0.5 sec. E, Cumulative data (mean ± SEM) showing the percentage modulation of NMDAR currents by PD168077 in the absence (n = 17) or presence of OA (0.5 μm; n = 15), pThr35I-1[7–39] (40 μm; n = 17), or microcystin (5 μm; n = 14) (*p < 0.005; ANOVA). F, Plot of peak evoked NMDAR EPSCs as a function of time and agonist application in a neuron dialyzed with the PP1–2A inhibitor microcystin (20μm). Each point represents the average peak (mean ± SEM) of three consecutive NMDAR EPSCs. Microcystin markedly diminished the PD168077 (20μm)-induced reduction of NMDAR EPSCs. Inset, Representative current traces (average of 3 trials) taken from the records used to construct F (at time points denoted by #). Calibration: 20 pA, 40 msec.
- Figure 4.
The D4 reduction of NMDA receptors required the inhibition of CaMKII activity. A, Plot of peak NMDAR currents showing that the CaMKII inhibitor KN-93 (10 μm) prevented PD168077 (40 μm) from reducing NMDAR currents. B, Plot of peak NMDAR currents as a function of time and agonist application in neurons dialyzed with the CaMKII inhibitory peptide AIP (10μm) or the purified calmodulin (10 μm). C, Cumulative data (mean ± SEM) showing the percentage reduction of NMDAR currents by PD168077 in the absence (n = 22) or presence of KN-93 (10μm; n = 9), KN-92 (10μm; n = 9), AIP (n = 11), calmodulin (n = 8), or calmidazolium (20 μm; n = 13) (*p < 0.005; ANOVA). D, E, Plot of peak NMDAR currents (D) or evoked NMDAR EPSCs (E) as a function of time and drug application in neurons from wild-type versus α-CaMKII +/– mice. Each point (E) represents the average peak (mean ± SEM) of three consecutive NMDAR EPSCs. The effect of PD168077 (20 μm) on NMDA receptors was markedly attenuated in the mutant cell. D, Inset, Immunoblots of total CaMKII and Thr286 autophosphorylated CaMKII in PFC slices from wild-type versus α-CaMKII heterozygous mice. F, Representative current traces (average of 3 trials) taken from the records used to construct E (at time points denoted by #). Calibration: 20 pA, 100 msec.
- Figure 5.
Activation of D4 receptors reduced CaMKII activity in PFC slices, which was blocked by activation of PKA or inhibition of PP1. A, Immunoblots of autophosphorylated CaMKII and total CaMKII. PFC slices were pretreated without or with KN-93 (10 μm), PKI[14–22] (1 μm), cpt-cAMP (100 μm), or OA (0.3 μm) for 30 min, followed by incubation without or with PD168077 (40 μm) for 10 min. After treatment, slice lysates were blotted with an antibody specific for Thr286-phosphorylated CaMKII. After stripping out signals, membranes were reblotted with an antibody recognizing the total CaMKII. B, Quantitation of Thr286-phosphorylated CaMKII with various treatments (n = 5–8 for each condition; *p < 0.001; ANOVA).
- Figure 6.
Activation of D4 receptors reduced the NMDAR surface expression and increased the NMDAR internalization in a CaMKII-dependent manner. A, Immunoblots showing the surface NR1 and total NR1 in PFC slices under different treatment conditions. PD168077 (40 μm; 10 min) decreased the level of surface NR1, and this effect was abolished by the pretreatment with KN-93 (5 μm; 30 min). B, Quantitation of the NR1 surface level with various treatments (n = 5–6 for each condition; *p < 0.01; ANOVA). C, Examples of internalized NMDAR immunoreactivity in cultured PFC pyramidal neurons under different treatment conditions. The untreated cell showed little NMDAR internalization, whereas the cell treated with PD168077 (40 μm; 5 min) showed significant staining for NMDARs internalized from the plasma membrane. Pretreatment with KN-93 (5 μm; 10 min) blocked the PD168077-induced NMDAR internalization. D, Quantitation of the internalized NR1 with various treatments (n = 24–32 cells per group from four cultures; *p < 0.001, ANOVA).


