

Article Figures & Data
Figures
- Figure 1.
The Tritonia swim network and swim motor program. A, A schematic diagram of the neural circuit underlying the swim motor pattern. All neurons have a contralateral homolog that is not represented. The shaded box indicates the neurons that comprise the CPG. Filled triangles represent excitatory synapses, and filled circles represent inhibitory synapses. Combinations of triangle and circle are multicomponent synapses. Dotted lines indicate that the connection is either polysynaptic or not determined. Tr1, Trigger neuron 1. The connectivity is derived from published work of Getting et al. (1980), Getting (1981), Hume and Getting (1982a), Frost and Katz (1996), and Frost et al. (2001). B, Schematic drawing of a dorsal view of the Tritonia brain showing the location of the swim CPG neurons and their axonal projections. DSI and C2 are located on the dorsal surface of the cerebral ganglion. VSI-B is located on the ventral side of the pleural ganglion. VFN is located on the dorsal side of the pedal ganglion. The VSI-B synapse on VFN and the DSI modulatory action are shown as a filled triangle and an arrow, respectively. C, An example of the swim motor pattern. Simultaneous intracellular recordings from three CPG neurons, C2, DSI, and VSI-B, and one efferent flexion neuron, VFN, are shown. The bursting pattern was elicited by stimulation of pedal nerve 3 by applying voltages pulses (10 V, 1 msec) at 10 Hz for 1 sec (arrow). DSI and VSI-B fire bursts of action potentials out of phase with one another. The cycle period varies from 7 to 12 sec.
- Figure 2.
The effect of DSI stimulation on VSI-B-evoked EPSPs was dependent on the time between the DSI spike train and the VSI-B spike. A, A schematic diagram showing the experimental configuration. Intracellular microelectrodes were placed in the somata of DSI, VSI-B, and VFN. DSI and VSI-B were stimulated by injecting brief current pulses (7-10 nA, 20 msec). The membrane potential of VFN was set at approximately -70 mV by constantly injecting a hyperpolarizing current through another electrode to prevent action potential firing triggered by the EPSP. B1, Simultaneous intracellular recordings from VFN, VSI-B, and DSI show that DSI stimulation increased the amplitude of VSI-B-evoked EPSPs recorded in VFN when VSI-B was stimulated shortly after DSI. VSI-B was stimulated repeatedly to fire single action potentials at a 60 sec interval. After the third VSI-B action potential (i), DSI was stimulated to fire a train of action potentials (10 Hz, 5 sec) that ended 7 sec before the next VSI-B spike (ii). The amplitude of the EPSP in VFN was enhanced after DSI stimulation. In this recording, VFN showed a slow depolarization in response to a DSI spike train, which appeared to be the summated unitary EPSPs. The depolarized membrane potential in VFN recovered to the original potential within 5 sec. Action potentials in the VSI-B and DSI traces are truncated. Vertical calibration bars indicate 5 mV. B2, Expanded, superimposed waveforms of VSI-B-evoked EPSPs recorded in VFN (top trace) and VSI-B action potentials (bottom trace) before (i, solid trace) and 7 sec after (ii, dotted trace) the DSI stimulation show the synaptic enhancement. The action potentials in VSI-B are truncated to show the resting potential and spike afterhyperpolarization. C1, When the DSI spike train preceded VSI-B by 37 sec, then the amplitude of the VSI-B-evoked EPSP in VFN decreased. The stimulus protocol was the same as in B except for the timing of the DSI spike train. Vertical calibration bars indicate 5 mV. C2, The decreased amplitude of the EPSPs can be seen in superimposed waveforms evoked before (iii, solid trace) and 37 sec after (iv, dashed trace) the DSI stimulation. Resting potentials of VSI-B and DSI were -47 and -44 mV, respectively.
- Figure 11.
Stimulating DSI and VSI-B in a swim-like bursting pattern differentially modulated single and summated EPSPs. A, The configuration of intracellular stimulation to VSI-B and DSI and an intracellular recording of EPSPs in VFN. Bursts of 5-10 spikes were evoked in VSI-B every 10 sec at 5-10 Hz alone (left) or in alternation with DSI spike trains (5-10 Hz, 4-7 sec; right) mimicking the swim motor program. B, The normalized average amplitudes of the initial EPSP in each train (B1) and the summated fifth EPSP (B2) are plotted as a function of burst cycle number. When VSI-B was stimulated alone (solid circles), the amplitudes of both the initial EPSP (B1) and the summated EPSP (B2) gradually declined. When DSI bursts were interposed between VSI-B bursts for six cycles, the amplitudes of both the initial EPSP (B1) and the summated EPSP (B2) increased immediately (control, open circles). The initial EPSP declined gradually in amplitude despite continued DSI stimulation and by the seventh cycle was not significantly different from control (B1). In contrast, the summated EPSP decreased in amplitude after the first burst cycle but remained elevated for as long as DSI bursts were maintained (B2). After the cessation of DSI stimulation (the eighth cycle), the initial EPSP decreased to an amplitude that was significantly less than control, whereas the summated EPSP was not significantly different from control. Asterisks indicate significant difference from control (n = 7; p < 0.05; paired t test).
- Figure 3.
DSI stimulation caused a biphasic-bidirectional change in the amplitude of EPSPs evoked by VSI-B. A, The normalized amplitudes of VSI-B-evoked EPSPs were plotted as a function of time after the end of the DSI spike train. A DSI was stimulated to fire action potentials for 3-10 sec at 5-10 Hz (the gray vertical bar represents a 5 sec DSI spike train). Time 0 is the time of the last DSI spike. The peak amplitude of the VSI-B-evoked EPSPs occurred ∼5 sec after the DSI spike train. The decrement was maximal at ∼40 sec after the DSI spike train. Data from 13 preparations are plotted; each symbol represents data from a different preparation. The plot was fit by a double-exponential curve, f(t) = 1 + A × e-t/τ1 - e-t/τ2, where t is the time after the end of the DSI spike train, A = 1.89, τ1 = 18.8 sec, and τ2 = 68.5 sec. The EPSP amplitude was normalized to the average of the three EPSPs elicited before each DSI spike train (compare Fig. 2B1,C1). B, Bar graph showing averages of the normalized EPSP amplitudes at 10 sec intervals after DSI stimulation. Each bar shows mean ± SEM across preparations. The number of animals examined for each time period is indicated in each bar. There was a significant increase in EPSP amplitude when VSI-B was stimulated within 10 sec of DSI and a significant decrease when VSI-B was stimulated 20-60 sec after DSI (p < 0.001 by one-way ANOVA with Tukey test); however, there was no significant change during the transition period from enhancement to decrement (10-20 sec after DSI).
- Figure 4.
DSI stimulation caused different sequential neuromodulatory effects depending on the timing of its activation. A-C, VSI-B was stimulated to fire an action potential every 30 sec. A DSI was then stimulated to fire a single train of action potentials (10 Hz, 5 sec) that ended 5 sec (A), 15 sec (B), or 20 sec (C) before a VSI-B spike. D, Averaged data show the sequential effects of DSI stimulation on normalized VSI-B-evoked EPSPs recorded in VFNs. The gray vertical bar represents a 5 sec DSI spike train. When DSI was stimulated to fire 5 sec before a VSI-B spike, subsequent EPSPs showed an initial increase, followed by a decrease in amplitude (plot A, open circles; n = 7). When DSI was stimulated 15 sec before a VSI-B spike, there was no immediate effect, but subsequent EPSPs were decreased in amplitude (plot B, gray circles; n = 5). When DSI was stimulated 20 sec before a VSI-B spike, subsequent EPSPs were decreased in amplitude (plot C, filled circles; n = 4). The time course of recovery was slightly slower when the DSI stimulus was timed to produce only a decrement. In all cases, the EPSPs recovered to the original size after the decrement. Each plot shows a mean value (mean ± SEM) of pooled data obtained by repeated trials made in three preparations.
- Figure 5.
DSI stimulation produced a biphasic-bidirectional change in the input resistance of a VFN that was opposite to the observed change in synaptic strength. Two-electrode voltage clamp was performed on a VFN, which was held at -50 mV. Changes in the input resistance of the VFN were measured by recording membrane current responses evoked by repetitive command voltage pulses (amplitude, -40 mV, 1 sec duration) given at 0.5 Hz. Reciprocal values for the membrane current responses were normalized to the average before DSI stimulation and plotted against time after the DSI stimulation. The plot was fit by a double-exponential curve, f(t) = 1 + A × e-t/τ1 - B × e-t/τ2, where t is the time after the end of DSI stimulus train, A = 0.25, τ1 = 62.5 sec, B = 0.4, and τ2 = 15.9 sec.
- Figure 6.
Synaptic currents evoked by VSI-B were modulated in a timing-dependent manner by DSI. A, Schematic diagram showing the experimental configuration. The membrane potential of the VFN soma was held at -50 mV by two-electrode voltage clamp. Intracellular electrodes were used to elicit action potentials in DSI and VSI-B. VSI-B was stimulated to fire an action potential every 60 sec. A DSI spike train (10 Hz, 5 sec) was elicited at varying times relative to VSI-B spikes. Changes in EPSC amplitude were normalized to the average of the three EPSCs before the DSI spike train. B, The effect of DSI on VSI-B-evoked EPSCs in VFN depended on the timing of the DSI spike train relative to VSI-B spikes. When DSI stimulation preceded VSI-B by 5 sec, then the amplitude of the following EPSC increased (B1). When the DSI spike train was evoked 30 sec before VSI-B spiking, then the amplitude of the EPSC decreased (B2). C, The normalized EPSC amplitudes plotted against time after the DSI stimulation show a biphasic-bidirectional change (n = 5). Each symbol represents a different animal. The plot was well fit by a double-exponential function: f(t) = 1 + A × e-t/τ1 - e-t/τ2, where A = 1.98, τ1 = 15.6 sec, and τ2 = 45.9 sec.
- Figure 7.
Effects of bath-applied serotonin on VSI-B synaptic strength. A, 5-HT (100 μm) caused three types of changes in the amplitude of the VSI-B-evoked EPSPs or EPSCs: a sustained increase (A1), a sustained decrease (A2), and a biphasic-bidirectional change with initial transient increase followed by a decrease (A3). The horizontal bar in each graph shows the duration of 5-HT bath application. B, Dose-responses to 5-HT for individual animals. The amplitudes (B1) and the normalized amplitudes (B2) of VSI-B-evoked EPSPs and EPSCs are plotted as a function of 5-HT concentration. Symbols represent the averaged amplitude of 10 EPSPs (millivolts, circles) or EPSCs (nanoamperes, triangles) before the onset of 5-HT application (0 μm) and in the presence of 5-HT (1, 10, or 100 μm). Open symbols indicate 5-HT-induced enhancement (n = 11), whereas filled symbols indicate the depression (n = 2). Gray circles represent a biphasic-bidirectional change (n = 1). C, Average dose-response relationship of the 5-HT-induced enhancement of VSI-B synaptic strength and the effect of methysergide. The presence or absence of methysergide (50 μm) is shown by + or -, respectively. 5-HT (100 μm) caused a significant increase in the amplitude of VSI-B-evoked EPSP and EPSCs (+64.1 ± 10.0%; n = 11; p < 0.05; paired t test). Methysergide (50 μm) by itself did not have a significant effect on the amplitude of VSI-B-evoked EPSP and EPSCs (p = 0.99; paired t test). In the presence of methysergide, 100 μm 5-HT caused no significant change (p = 0.46; paired t test).
- Figure 8.
Occlusion of DSI modulatory actions by bath-applied 5-HT. A, Superimposed waveforms of EPSPs evoked by VSI-B alone (solid traces) and those evoked 5 sec (dotted traces) and 35 sec (dashed traces) after DSI stimulation are shown. In normal saline (left), stimulation of DSI 5 sec before VSI-B increased the amplitude of the EPSP; stimulating DSI 35 sec before VSI-B decreased the EPSP amplitude. In 100 μm 5-HT (middle), the amplitude of the EPSP evoked by VSI-B alone increased; however, DSI stimulation caused little change in VSI-B-evoked EPSPs. The amplitude of the EPSP recovered during washout of 5-HT, and DSI-evoked enhancement-decrement was again observed (right). B, Bar graphs showing mean values of normalized amplitudes of the EPSPs evoked before DSI stimulation (gray), 0-10 sec after DSI stimulation (white), and 20-60 sec after DSI stimulation (black). In normal saline, there was a significant enhancement (+50.5 ± 16.5%) of VSI-B-evoked synaptic EPSPs when VSI-B was stimulated within 10 sec of a DSI train (n = 4; p < 0.05; paired t test) and a significant decrement (-11.2 ± 2.1%) when VSI-B was stimulated 20-60 sec after DSI (n = 4; p < 0.05; paired t test). In the presence of 100 μm 5-HT, there was no significant change in VSI-B-evoked EPSPs after DSI stimulation (p = 0.18 and 0.22; paired t test).
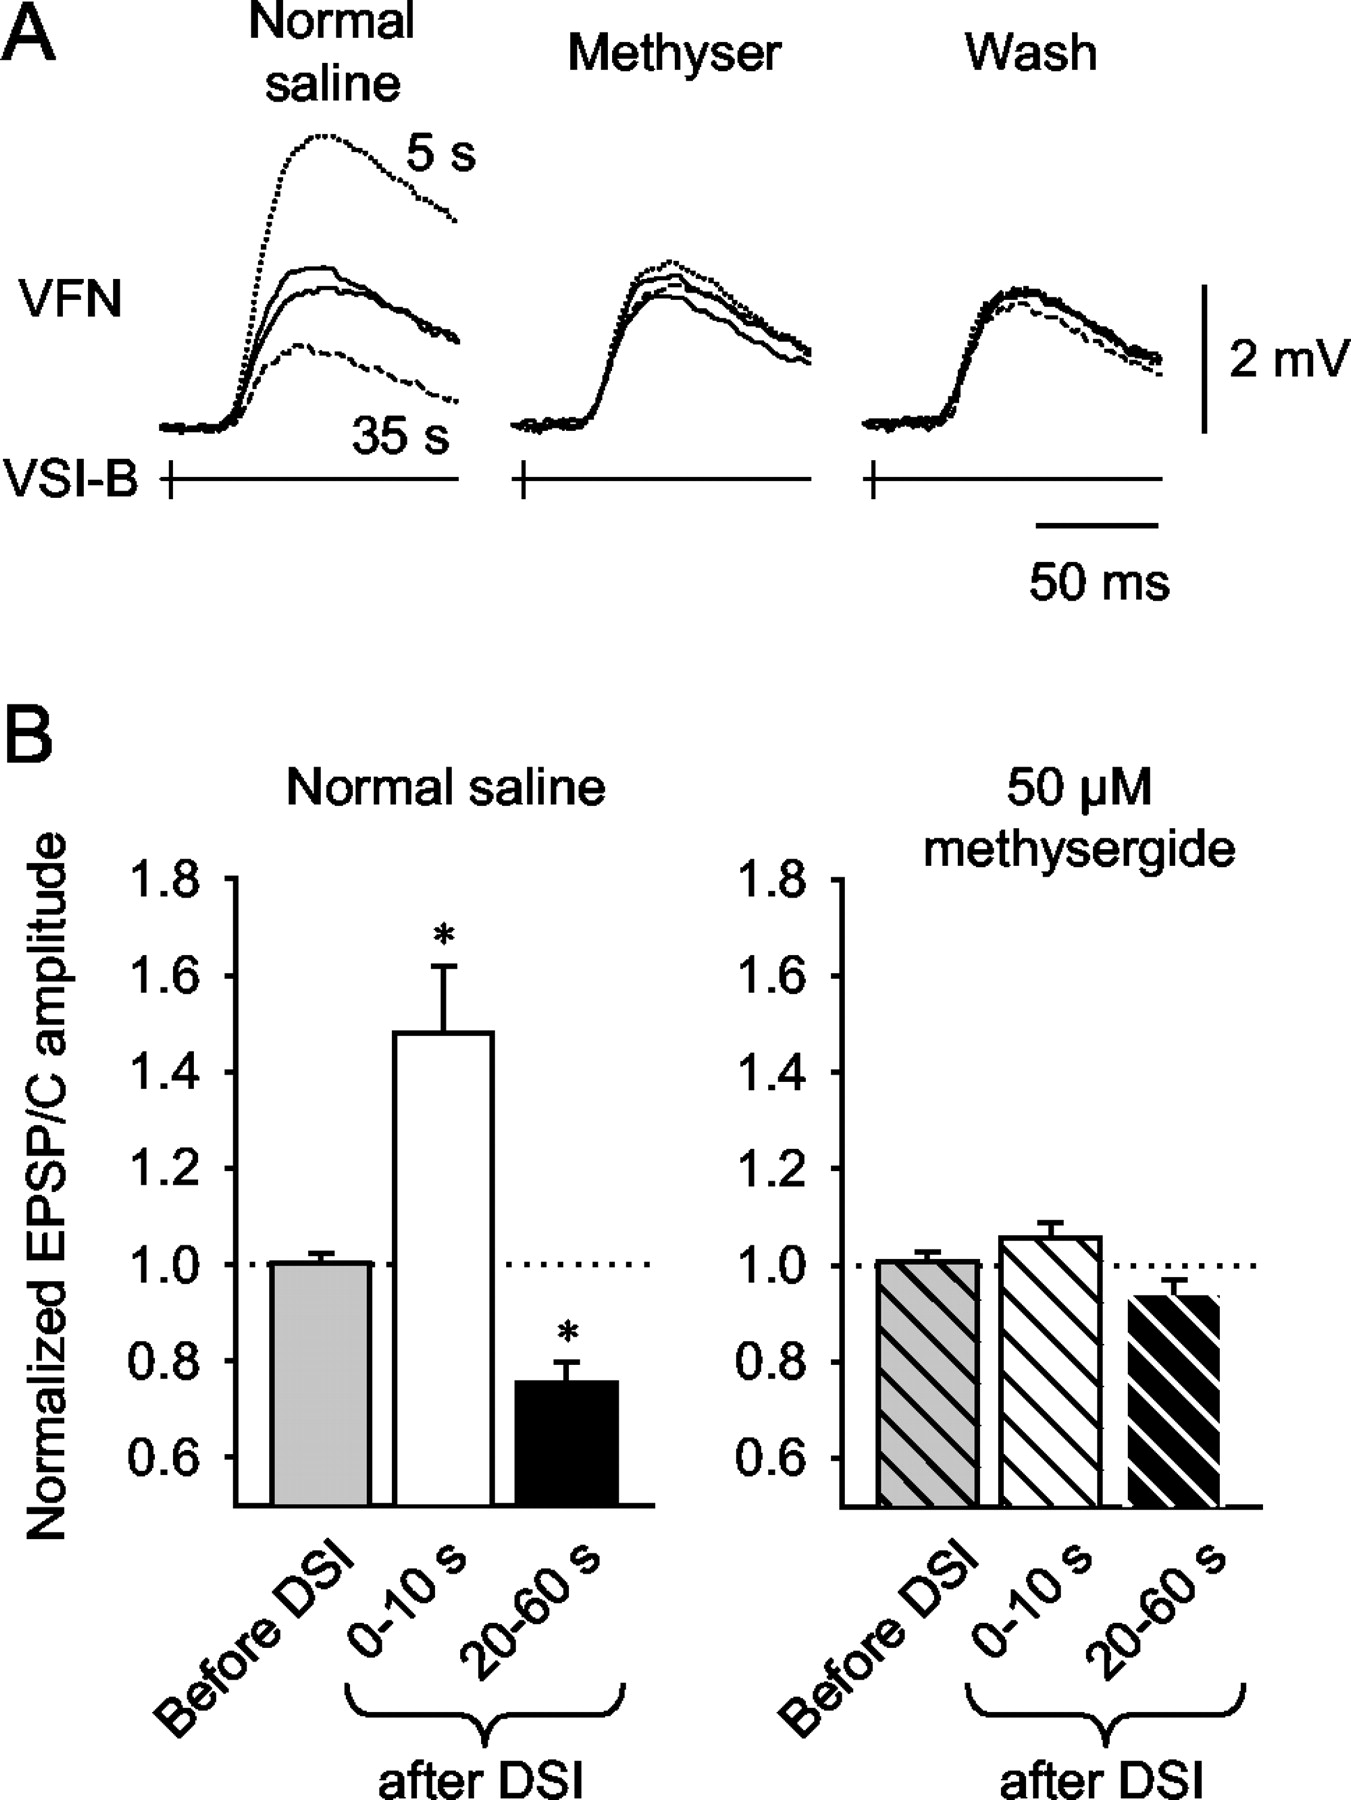
- Figure 9.
Blockade of DSI neuromodulatory actions by methysergide. A, Superimposed waveforms of the EPSPs evoked by VSI-B alone before DSI stimulation (solid traces) and those evoked 5 sec (dotted traces) and 35 sec (dashed traces) after DSI stimulation are shown. In normal saline (left), DSI stimulation caused either an enhancement or a decrement of VSI-B-evoked EPSPs depending on the timing of its firing relative to that of VSI-B. In the presence of methysergide (50 μm; middle), DSI stimulation caused little change in EPSP amplitude. The DSI-evoked enhancement-decrement did not recover after washing out for >1 hr (right). B, Average responses show that methysergide blocked both the enhancement and depression evoked by DSI stimulation. In normal saline, stimulation of DSI 10 sec before VSI-B caused a significant increase in synaptic strength (+48.2 ± 13.9%; n = 4; p < 0.05; paired t test) and a significant decrement (-24.6 ± 8.6%) when stimulated 20-60 sec before VSI-B (n = 4; p < 0.05; paired t test). In the presence of 50 μm methysergide, DSI stimulation had no significant effect on VSI-B synaptic strength in either time period (p = 0.23 and 0.18; paired t test).
- Figure 10.
DSI modulatory actions interact with homosynaptic facilitation. A, Trains of five VSI-B-evoked EPSCs (10 Hz) recorded from VFN before DSI stimulation (solid lines) and 5 sec (A1) or 35 sec (A2) after DSI stimulation (dotted lines). The gray arrowheads point to the peak amplitudes of the unmodulated EPSCs. The white and black arrowheads indicate the peak of the EPSCs 5 and 35 sec after DSI stimulation, respectively. When VSI-B was stimulated 5 sec after DSI (A1), each EPSC increased in amplitude; however, when VSI-B was stimulated 35 sec after DSI (A2), there was a substantial decrease in the first two EPSPs and very little change in subsequent EPSPs. B, Averages of normalized responses show that the amplitude of the first EPSC (left) was significantly increased when VSI-B was stimulated within 10 sec of DSI (n = 5; p < 0.05; paired t test) and significantly decreased when stimulated 20-60 sec after DSI (n = 5; p < 0.05; paired t test). The fifth EPSC (right) of the train was larger than the first (left) because of to homosynaptic facilitation. When VSI-B was stimulated within 10 sec after a DSI spike train, the amplitude of the fifth EPSC was significantly larger than before DSI (n = 4; p < 0.05; paired t test); however, when VSI-B was stimulated 20-60 sec after DSI, the amplitude of the fifth EPSC in the train was not significantly different from the control fifth EPSC (n = 4; p = 0.35; paired t test). C, DSI-evoked changes in the ratio of fifth EPSC to first EPSC, an index of homosynaptic frequency facilitation of the VSI-B synapse. When VSI-B was stimulated 0-10 sec after DSI (white bar), there was no significant change in the ratio (n = 4; p = 0.06; paired t test); however, when VSI-B was stimulated 20-60 sec after DSI stimulation (black bar), there was a significant increase in the ratio (n = 4; p < 0.05; paired t test).


