

Article Figures & Data
Figures
- Figure 1.
Digital recordings of fear-elicited 22 kHz USVs. The top spectrogram (A) is the USV CS used in experiment 1. The average call duration is 850 msec. The bottom spectrogram (B) is the USV CS used in experiment 2. The average call duration is 1490 msec. The downward-pointing arrow in A and the upward-pointing arrow in B indicate the first instance of an upsweep at the beginning and end of the USV, respectively.
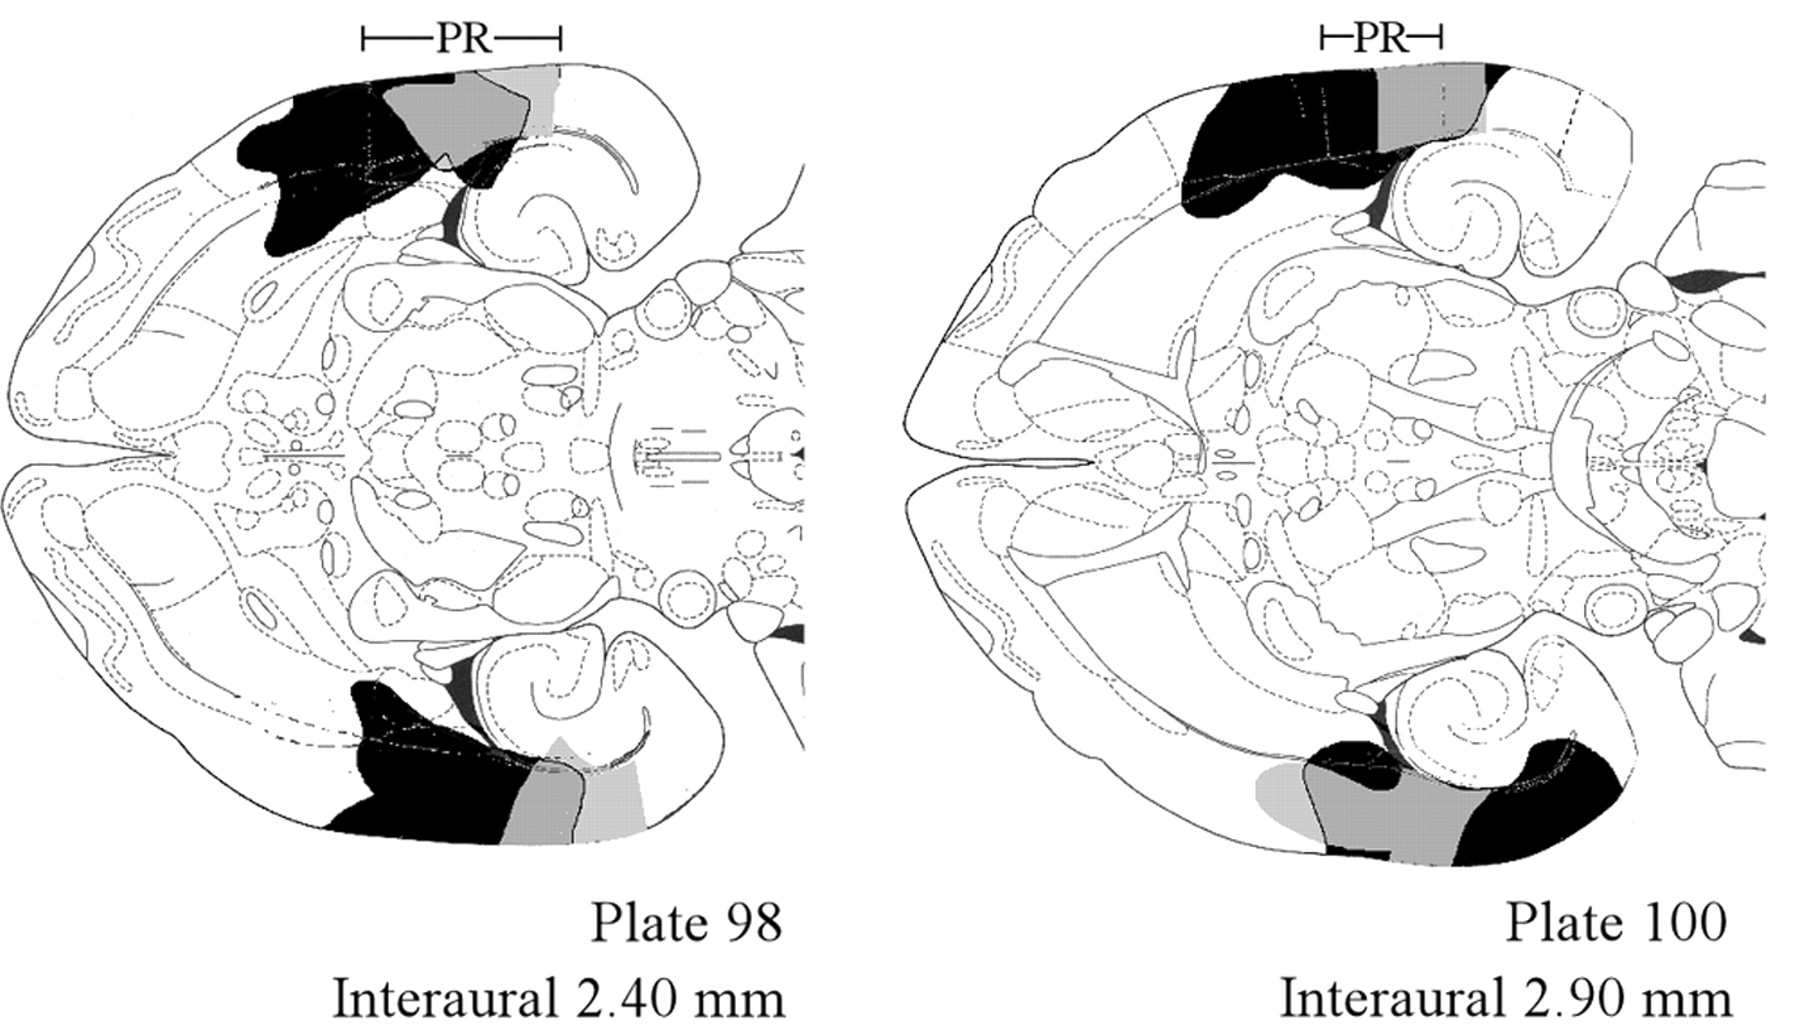
- Figure 2.
Composite histological reconstructions and a photomicrograph showing PR damage in experiment 1. A, PR lesions drawn onto plates 98 and 100 from Paxinos and Watson (1998). Gray and black areas indicate, respectively, the smallest and largest lesion. The rostrocaudal extent of the PR, indicated above both plates, follows the coordinates of Paxinos and Watson (1998). The region of the PR in plate 98 ranges from –2.4 to 6.0 mm, whereas plate 100 ranges from –2.7 to 5.0 mm, relative to bregma. The numbers at the bottom of each figure indicate the distance in millimeters above the interaural line. B, Photomicrograph of a stained section, corresponding to plate 100, showing a representative PR lesion. The rostrocaudal extent of the PR is indicated by the bar at the top of the figure.
- Figure 3.
Freezing to the cue and context in each of the four groups in experiment 1. The dashed horizontal line is the mean level of freezing during the pre-CS period averaged across the four experimental groups (20.2%), whereas asterisks denote significant differences between the sham-operated control and lesioned animals (see Results for details). A, Freezing to the paired USV cue and the training context. B, Freezing to the unpaired USV cue and the training context. C, Freezing to the paired 22 kHz tone and the training context. D, Freezing to the 4 kHz tone and the training context.
- Figure 4.
Freezing to the cue and context in the combined groups from experiment 1. The broken horizontal line is the mean level of freezing during the pre-CS period (20.2%), as in Figure 3, and the asterisk denotes a significant overall effect of surgery. A, In the cue test, all three paired conditional stimuli elicited robust freezing in control rats (Sham; three tall bars), but not the unpaired USV CS (Sham; short bar). Freezing to the two tone conditional stimuli (Lesion; two tall bars) was not blocked by PR lesions, whereas lesions abolished freezing to the paired USV CS (Lesion; unfilled short bar), comparable with the level seen when the USV CS was unpaired (Lesion; other short bar). B, In the context text, all four groups of control animals showed robust freezing, which was significantly attenuated in the PR rats.
- Figure 6.
Replication and summary of PR lesion effects on conditioning to an USV cue and to the conditioning context. A, Freezing to USV#2 and to the conditioning context in experiment 2. The dashed horizontal line is the mean level of freezing during the pre-CS period (26.5%). Asterisks denote significant differences between the sham-operated control and PR-lesioned animals. Freezing during the pre-CS and post-CS periods are not shown in this case (see Results for values). B, Freezing to both USV cues and to the conditioning context in the combined results from experiments 1 and 2. The dashed horizontal line is the mean level of freezing during the combined pre-CS period (21.1%). Asterisks denote a significant lesion effect.
- Figure 5.
Composite histological reconstructions showing PR damage in experiment 2. The PR lesions are drawn onto plates 98 and 100 from Paxinos and Watson (1998). Gray and black areas indicate, respectively, the smallest and largest lesion.


