

Article Figures & Data
Figures
- Figure 1.
Behavioral data mean response latency (in seconds) (i.e., time elapsed between odor onset and licking of the spout during daily training sessions) for six rats over four training stages (see Results). Each learning curve corresponds to one of the odors used in task 1: geraniol (S+; dash) and eugenol (S-; black line). Values obtained in the control task are shown on the right: C8 (S+; •) and C10 (S-; ▪). During the intermediate level, a difference between the two latency curves appeared and increased during the following days. In the expert level, the curves were well separated. For S-, rats licked the spout with an average delay of 11 sec after odor onset. When new odors were introduced, this difference disappeared.
- Figure 2.
Examples of local field potential signal recorded before and during odor sampling. A, Raw signal (0.1-300 Hz) during spontaneous activity. In the absence of odor, γ bursts (60-90 Hz) are present at each respiratory cycle. B, Raw signal (0.1-300 Hz) before, during, and after odor sampling (horizontal bar). Single trial to the S+ odor (geraniol) is shown from the same posteroventral recording site in the beginner condition (top) and in the expert condition (bottom). Note that an increase in the β oscillatory response can be observed in the expert condition even in the raw signal. C, Time-frequency analysis representation (from wavelet transform) of the same signal shown in B in the beginner condition. Left, In the γ band. Right, In the β band. Odor sampling duration is indicated with white vertical bars. x-Axis, Time (in sec); y-axis, frequency from 60 to 90 Hz (left), and 15-40 Hz (right) from top to bottom. The color scale represents signal power (μV2). The same time scale is used for all representations. D, Example of individual and filtered signals in the β band (15-40 Hz) recorded simultaneously in four recording sites; expert condition in response to sampling the S+ odor (geraniol, white vertical bar). One can see the obvious difference, at least in amplitude, in odor-induced β response. E, Time-frequency analysis representation corresponding to the local field potential signals in D. Odor sampling duration is indicated with white vertical bars. x-Axis, Time (in sec); y-axis, frequency from 15 to 40 Hz, from top to bottom. The color scale expresses signal power (μV2). The same time and color scale is used for all representations.
- Figure 3.
Electrode localization. A, Electrode localization as controlled histologically is reported on schematic views of the olfactory bulb. Top, Profile view. Bottom, Top view. The gray dots represent the recording sites from the AD site. The black dots represent sites from the PV site. B, Detail of an olfactory bulb section showing an example of one recording site marked by electrocoagulation in the mitral cell body layer.
- Figure 4.
Mean occurrence rate of significant power decrease in the γ band (60-90 Hz; n = 6 rats). Mean (±SEM) occurrence rate of power decrease is represented by uporientated bars during the two periods of signal analysis for the two recording sites, anterodorsal (top; n = 11) and posteroventral (bottom; n = 12), in beginners (gray bars), experts (black bars), and controls (scratched bars). In all conditions, values were significantly higher for the odor period than for the preperiod (at least p < 0.05). Symbols indicate a significant difference in the level of decrease: *, between experts and beginners; ▵, between AD and PV; ×, difference between controls and experts. There was no difference between controls and beginners.
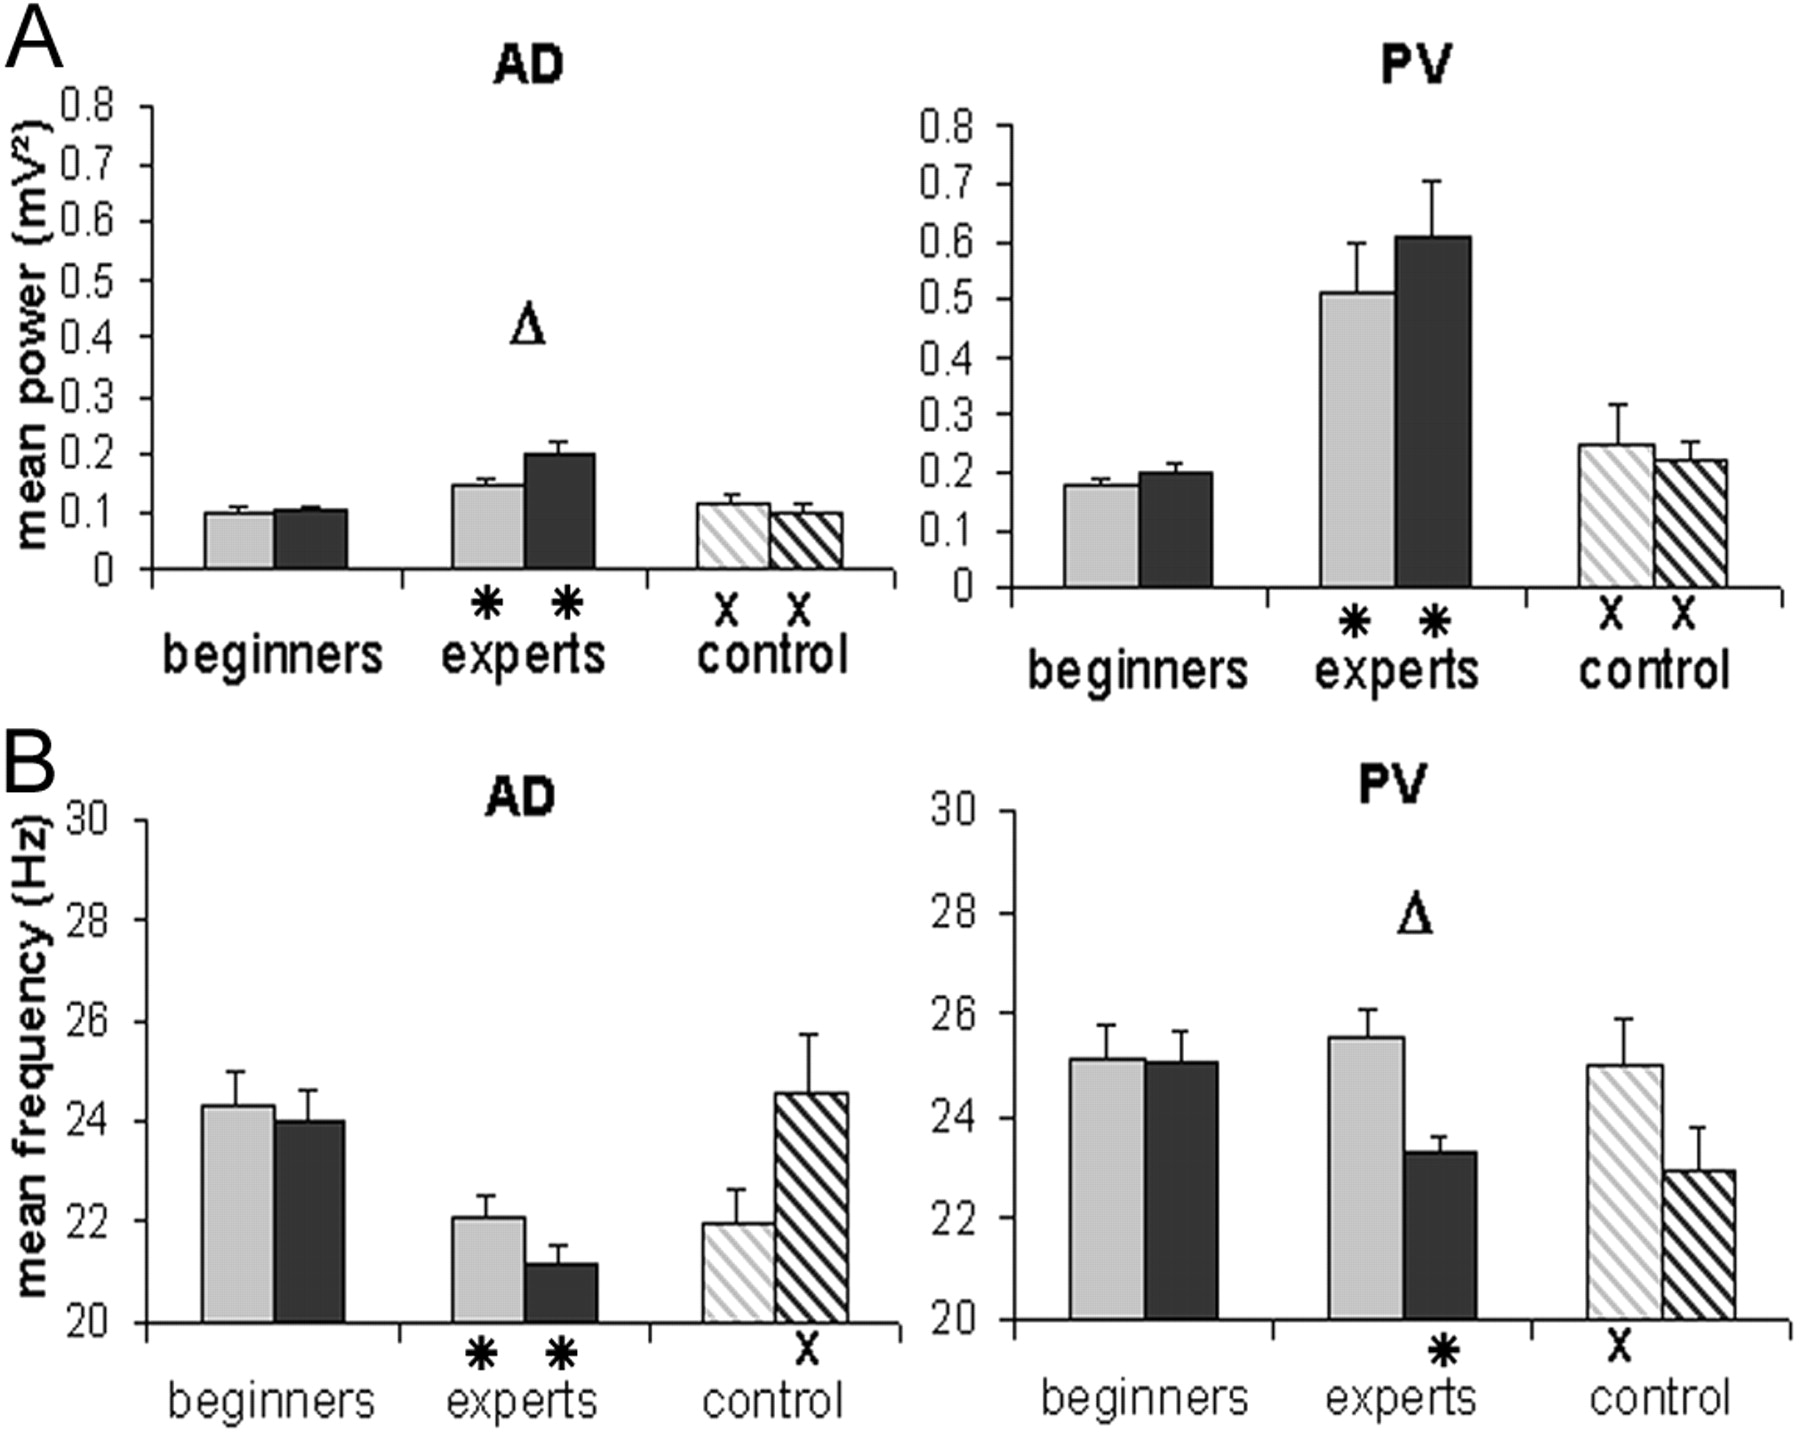
- Figure 5.
Effect of learning on power and frequency in the β band during odor sampling. Mean power (top) and frequency (bottom) of the peak of maximal energy recorded during odor sampling in anterodorsal site (left; n = 11) and posteroventral (right; n = 12) are shown. Values were extracted from time-frequency analysis. For each condition (beginners, experts, controls), data are represented separately for the two odors (eugenol and geraniol for beginners and experts; C8 and C10 in control condition). Each bar expresses the mean power (±SEM) (a) or frequency (±SEM) (b) during the odor period, 1000 msec after odor onset. *, Significant difference between beginners and experts; ▵, difference between the two odors; ×, significant difference between experts and controls. Changes in values in the three recording conditions occurred depending on the recording site and odors.
- Figure 6.
Changes in behavioral response and power in the β band from the early to late phase of training in the intermediate recording condition. a, Mean behavioral response latency (sec) after sampling of S+ (dashed line; n = 195 trials) and S- (black line; n = 212 trials). b, Mean power (±SEM; in mV2) for AD sites (white bars) and PV sites (gray bars). ×, Significant difference between the two sites; *, significant difference between early and late intermediate. Values are those corresponding to the peak of maximal energy during each sampling period. c, Mean maximal power (±SEM; in mV2) in response to eugenol and geraniol. Results of the two sites have been pooled together. *, Significant difference (p < 0.01) between the two odors.
- Figure 7.
Effect of the level of training and recording sites during the time of occurrence of the peak of maximal amplitude in the β band. Distribution of the time of occurrence of peaks between 0 and 1000 msec of the odor period by 100 msec bins is shown for beginners (top), experts (middle), and controls (bottom) for AD sites (open bars) and PV sites (filled bars). Each bar illustrates the percentage of peaks for each 100 msec bin relative to the total number of peaks during the odor period.


Tables
A. β modulation after learning B. Differences in β characteristics for the two learning levels Variable Tested Beginner Expert Power Increase Odor NS E < G Site AD < PV AD < PV Frequency Decrease Odor NS E > G for PV site Site NS AD < PV for odor E Latency Decrease Odor NS NS Site AD < PV AD < PV -
Modulation of the three variables (power, frequency, and latency) used to describe the β oscillatory response. Column A, Significant modulation of each variable compared between beginner and expert levels, independently of the odor identity and the recording site. Column B, Modulation of the variables within each level of learning (beginner and expert) according to two factors, odor identity (E, eugenol; G, geraniol) and recording site (AD, anterodorsal; PV, posteroventral). NS, Not significant; p > 0.05.
-


