

Article Figures & Data
Figures
- Figure 1.
Substance P evokes long-term metaplastic facilitation of EIN-evoked EPSPs. A, An example of the metaplastic facilitation evoked by substance P at a single EIN to motor neuron connection. The EIN input depressed in control (black circles; average of 9 spike trains) but was facilitated in substance P (white squares; average of 9 spike trains). In all cases, metaplasticity was examined using trains of 20 presynaptic spikes evoked at 20 Hz. B, Traces from another EIN to motor neuron connection showing the potentiation of the initial EPSP in the train and the metaplastic facilitation 10 min after the start of substance P (subs P) wash-off. Note that the potentiation of the initial EPSP amplitude, but not the metaplastic facilitation, had recovered after washing for 45 min. All traces are averages of 10 sweeps. Gray lines show the input after substance P and black lines the control response. C, Comparison of the initial EIN-evoked EPSP amplitude in different EIN to motor neuron connections before and 4 hr after substance P application. D, Graph showing the proportion of facilitating and depressing EIN connections before (n = 225) and 4 hr after (n = 35) substance P application. E, Schematic diagram showing the technique for stimulating identified EINS extracellularly. The traces show the synaptic input evoked by an EIN when a spike was evoked intracellularly on rebound from a hyperpolarizing current pulse, or when it was evoked by stimulating the cord (gray line; the stimulus artifact has been removed). The PSP in both cases was the same, suggesting that only the EIN recorded from had been stimulated. Fi, Graph showing the time course of the metaplastic facilitation (measured as the average of the 2nd to 5th EPSPs in the train) and the potentiation of the initial EPSP in experiments that used extracellular EIN stimulation (n = 4). Fii, Traces showing the initial EPSP amplitude and the metaplasticity in control and at different times after substance P application from a single experiment using extracellular EIN stimulation. The metaplastic facilitation is shown by the increase in the average of the second to fifth EPSPs in the train 3 hr after substance P application. Gi, Gii, Substance P did not evoke metaplastic facilitation of reticulospinal-evoked inputs. Instead, depression was usually enhanced. This may be because of the increased amplitude of the initial EPSP in the spike train. The black trace shows the control response and the gray trace the response in substance P. The bottom voltage value on the scale bar refers to action potential amplitudes and the top value to EPSP amplitudes.
- Figure 4.
A V-M analysis of EIN-evoked synaptic transmission to motor neurons in control (n = 7) and 4 hr after substance P (Subs P) application (n = 7). Ai, The relationship of the mean and variance of EIN-evoked EPSPs in normal Ringer's solution, high-calcium Ringer's solution, and low-calcium Ringer's solution is shown. Low-calcium Ringer's solution reduced the mean EPSP amplitude and variance, whereas high-calcium Ringer's solution increased the EPSP amplitude but reduced the EPSP variance. Each point represents the mean and variance of 100 EPSPs evoked at 0.2 Hz in one connection in control and in one connection after substance P application. A parabolic fit connects the points. Aii, Graph showing the absence of any activity-dependent change in the synaptic input over the 0.2 Hz stimulation period. The bargraphs show the release probability (pw; Bi), minimum number of release sites (Nmin; Bii), and the quantal amplitude (qw; Biii) in control connections and in connections examined 4 hr after substance P application.
- Figure 5.
Electron micrographs showing examples of synaptic morphology before and at different times after substance P application. A, Example of an asymmetric synapse with round vesicles in a spinal cord that had not been exposed to substance P. The solid black arrow indicates the PSD. B, An asymmetric synapse with round vesicles 30 min after substance P application. C, An asymmetric synapse with two perforations (open arrows) and round vesicles 3 hr after substance P application. Numbers 1-3 indicate regions of the PSD. A neighboring axon contains pleomorphic vesicles (p; vesicles with irregular shapes and sizes). D, An asymmetric synapse with round vesicles 5 hr after substance P application. a, Axon; d, dendrite; m, mitochondria; sv, synaptic vesicles. Scale bar, 250 nm.
- Figure 2.
The metaplastic facilitation shares the same induction properties as the burst frequency modulation. Because the substance P-evoked metaplasticity is not necessarily evoked in all connections in control, presumably because of the variable properties of EIN synapses to motor neurons, graphs here and in Figure 3 only show the connections where any metaplastic facilitation occurred. Ai, Graph showing the plasticity evoked over 20 Hz spike trains in the presence of the PKC antagonist chelerythrine (10 μm), in chelerythrine and substance P (Subs P), and in chelerythrine 30 min after the start of substance P wash-off (n = 5). Note that the metaplastic facilitation does not develop over the initial part of the spike train and recovers to control after washing for 30 min. Aii, Graph showing the effect of chelerythrine (Chel) and substance P on the initial EPSP amplitude (n = 8). Note that chelerythrine nonsignificantly (p > 0.05) increased the amplitude of the initial EPSP in the spike train and that the addition of substance P resulted in a nonsignificant reduction of the initial EPSP amplitude (p > 0.05). Bi, Graph showing the plasticity evoked over 20 Hz spike trains in the presence of the NMDA receptor antagonist AP-5 (100 μm; n = 5), in AP-5 and substance P (n = 5), and in AP-5 30 min after the start of substance P wash-off (n = 4). Bii, The effects of AP-5 and substance P on the amplitude of the initial EPSP in the train (n = 12; all effects were nonsignificant; p > 0.05). Ci, Graph showing the plasticity evoked over 20 Hz spike trains in low-calcium Ringer's solution, in low-calcium Ringer's solution and substance P, and in low-calcium Ringer's solution 30 min after the start of substance P wash-off (n = 5). Cii, The effects of low-calcium Ringer's solution and substance P on the amplitude of the initial EPSP in the spike train (n = 5).
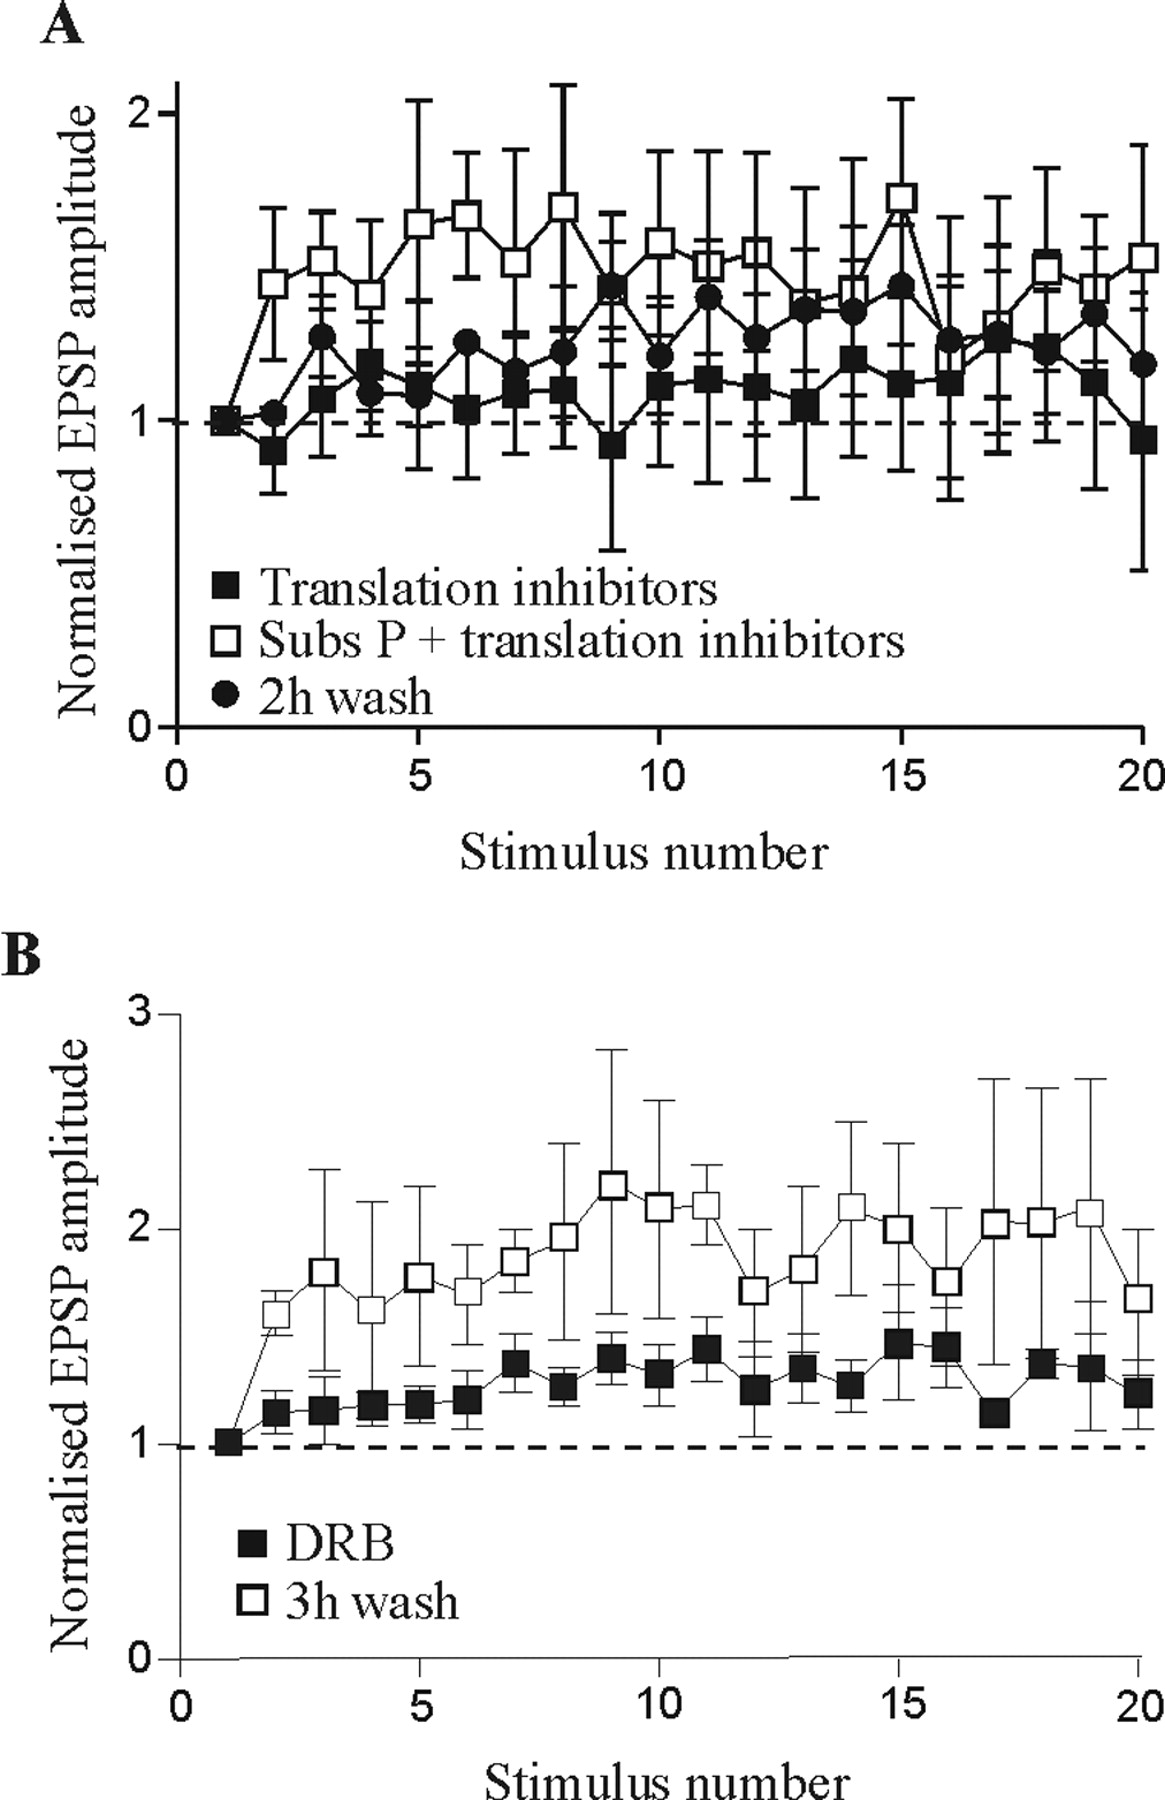
- Figure 3.
The metaplasticity is dependent on protein synthesis for its maintenance. A, Graph showing the plasticity evoked over 20 Hz spike trains in the presence of the translation inhibitors anisomycin or puromycin (10 μm), in anisomycin or puromycin and substance P (Subs P), and in anisomycin or puromycin 2 hr after the start of substance P wash-off (n = 5). B, Graph showing the plasticity evoked over 20 Hz spike trains in the presence of the transcription inhibitor DRB (10 μm) and in DRB 3 hr after the start of substance P wash-off (n = 4). Note that the metaplasticity persists 2-3 hr after substance P application after blocking transcription but does not persist at this time after blocking translation.
- Figure 6.
Substance P increased the number of docked vesicles and reduced the synaptic gap. A, Graph showing the number of docked vesicles at all synapses at different times after substance P application. Graphs showing the number of docked vesicles at synapses with round vesicles (B), asymmetric synapses (C), simple synapses (D), and synapses made onto dendritic shafts (E). F, Graph showing the distance across the synaptic gap at different times after substance P application. A-E, Pooled data: control, n = 4 animals; 30 min, n = 4 animals; 3 hr, n = 3 animals; 5 hr, n = 4 animals. F, Pooled data: control, n = 5 animals; 30 min, n = 4 animals; 3 hr, n = 4 animals; 5 hr, n = 4 animals. *p < 0.05; **p < 0.01; ***p < 0.001.
- Figure 7.
The effect of activity-dependent facilitation on the summed EIN synaptic input over physiologically relevant trains of five spikes at 20 Hz in 5-HT, which reduced the initial EPSP amplitude (Parker, 2000a), and in substance P (Subs P), which facilitated the connection without reducing the initial EPSP amplitude. The dashed lines with smaller symbols show the extrapolated summed input assuming no activity-dependent plasticity during the spike train. Note that the substance P-mediated facilitation results in a net increase in the glutamatergic input compared with control over all regions of the spike train, whereas the 5-HT-evoked facilitation is associated with a net reduction of the glutamatergic input over all regions of the spike train. Traces on the graph illustrate the effects of 5-HT (top set of traces) and substance P (bottom set of traces).


Tables
Time after substance P application Type of synapse Control 30 min 3 hr 5 hr All 33 (104) 42 (71) 52a (85) 42 (92) Symmetrical 33 (33) 43 (14) 50 (26) 38 (24) Intermediate 50 (14) 50 (16) 69 (13) 42 (19) Asymmetrical 28 (57) 39 (41) 48a (46) 45 (49) -
The numbers in parentheses indicate the total number of observations within the group.
-
↵ a Percentages of synapses perforated at 3 hr in both the All and Asymmetrical synapse groups were significantly greater (p < 0.05) than the corresponding controls, calculated using Fisher's exact test.
-


