

Article Figures & Data
Figures
- Figure 1.
Dual-color imaging of AP-evoked fluorescence responses in CA1 pyramidal cells transfected with GECIs. A, Molecular topology of GECIs used in this study. Binding Ca2+ causes changes in GECI fluorescence. Camgaroo2 (left) is based on the cpYFP (yellow fluorescent protein) molecule cpCitrine and has CaM inserted between the two halves of the cpCitrine barrel. GCaMP and Inverse Pericam (right) are based on cpGFP and contain CaM inserted C terminal to the cpGFP barrel and the CaM-binding peptide M13 inserted N terminal. B, CA1 pyramidal neuron expressing GCaMP (green; 9 d after transfection) and patched with a pipette filled with 500 μm X-Rhod-5F (red). The yellow region indicates overlapping green and red fluorescence. C, D, Magnified image of primary apical dendrite (boxed region in B; location of line scan, dashed white line), showing red X-Rhod-5F (C) and green GECI (D) fluorescence. E, F, Red and green fluorescence transients evoked by a train of 20 APs at 30 Hz. Fluorescence was averaged across the spatial extent of the dendrite (white dashed lines; top) to produce the fluorescence response (red and green traces; bottom) used for subsequent analysis.
- Figure 5.
Comparison of genetically encoded and synthetic Ca2+ indicator fluorescence saturation. Fluorescence saturation curves (Φ vs [Ca2+]; mean ± SEM) were fit (solid lines) to a general Hill model (Eq. 1). A, X-Rhod-5F fluorescence saturation measured simultaneously with [Ca2+] (using Fluo4-FF). The data show excellent agreement with the expected values for a synthetic Ca2+ indicator (Table 1). B-D, GECI fluorescence saturation measured simultaneously with [Ca2+] using X-Rhod-5F (Table 1).
- Figure 4.
Frequency response of genetically encoded and synthetic Ca2+ indicator fluorescence. Power spectra of fluorescence time series (from Fig. 3A-E) were calculated, and the spectra of X-Rhod-5F (A) and GCaMP (B) from a 20 Hz AP train are shown. A, X-Rhod-5F fluorescence power spectrum showing pronounced peaks at the AP train frequency (fundamental; 20 Hz) and its harmonics. B, GCaMP fluorescence power spectrum does not reveal a definite peak, even at the AP train frequency (20 Hz).
- Figure 6.
FRAP reveals that GECIs have mobilities similar to GFP. A, A region of the apical dendrite from a cell transfected with GFP used for FRAP measurement. B, A magnified image of the FRAPed spine (boxed region in A), with the region used for line scan FRAP indicated by a black line. C, Fluorescence across marked region in B showing bleaching (50 msec bleach time) and recovery in raw fluorescence traces. D, Normalized fluorescence across marked region in B before and after photobleaching. The recovery time constant is measured by fitting the fluorescence recovery to a single exponential. E, Cumulative probability distribution of recovery lifetimes (circles) for individual spines from cells expressing GFP, GCaMP, Camgaroo2, and Inverse Pericam. A Kolmogorov-Smirnov pairwise comparison revealed the distributions to be identical (p > 0.3). F, Mean recovery times were identical (ANOVA; p > 0.3) for all GECIs and were similar to GFP. Box plots (black lines) show mean value (central line) as well as 95% confidence intervals (black trapezoids above and below mean line).
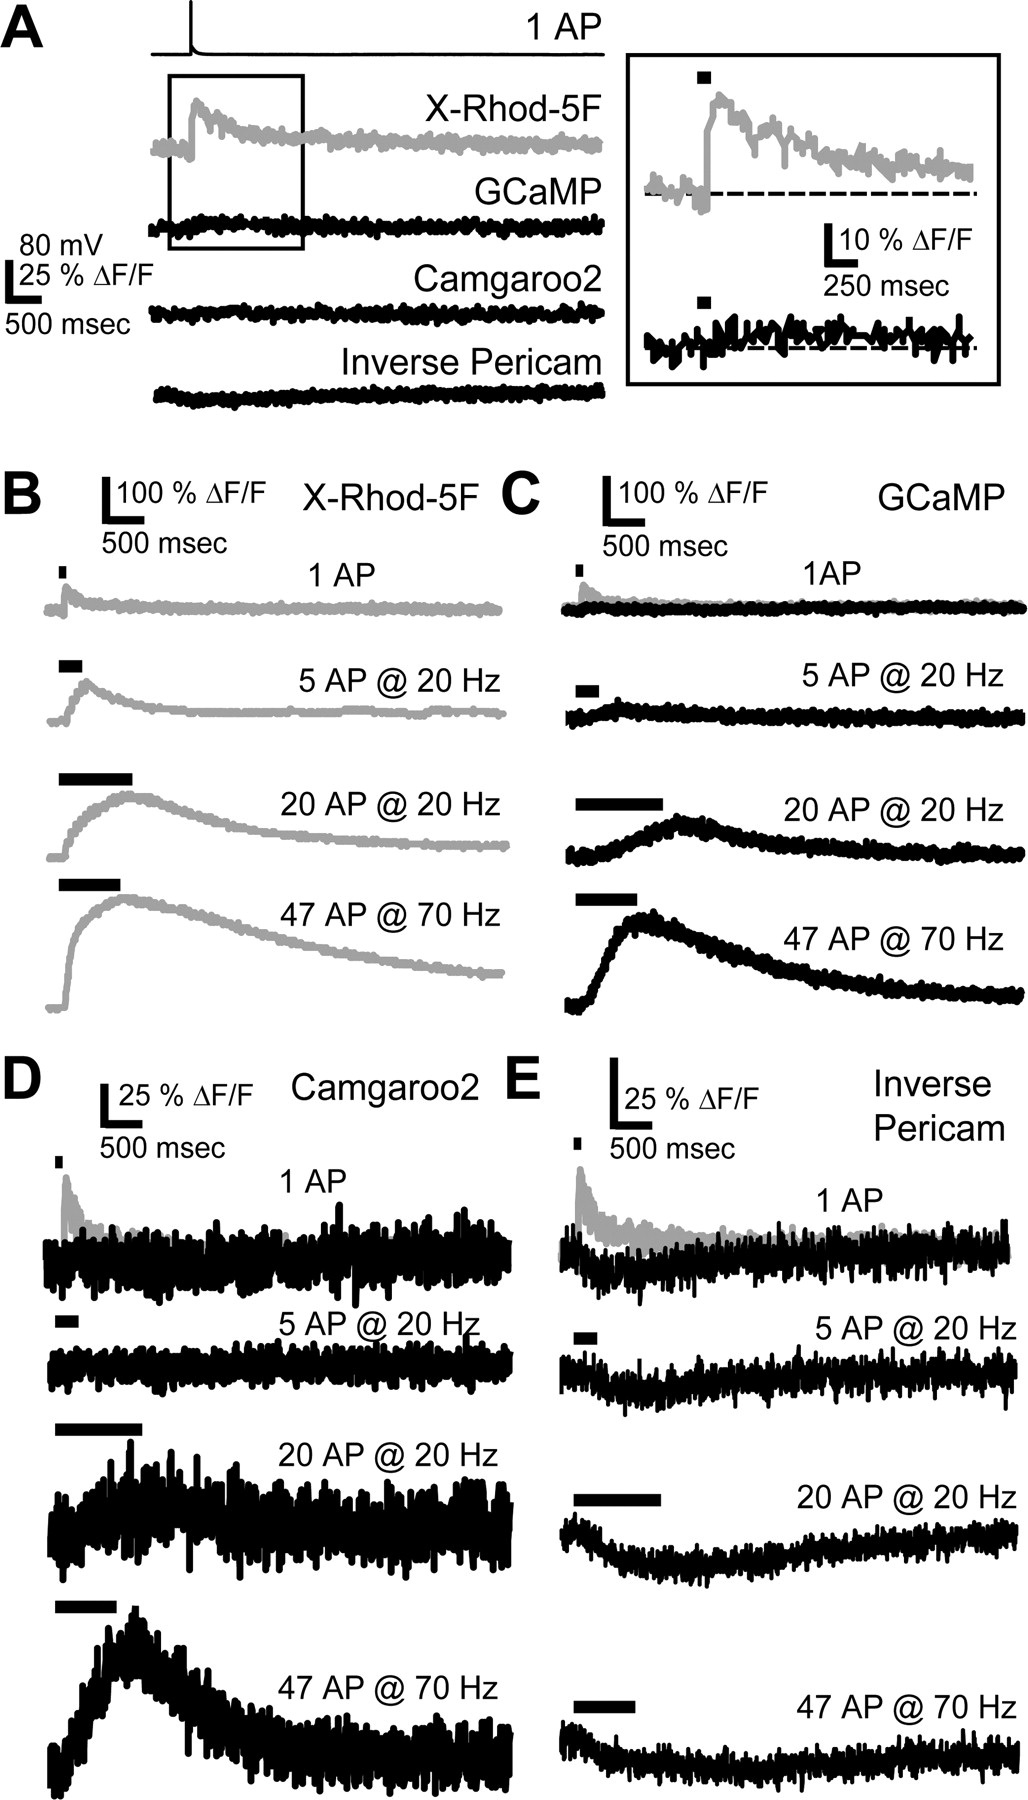
- Figure 2.
Fluorescence responses to APs. A, Single AP-evoked fluorescence transients averaged over 13 trials. The scale bar applies to all traces. Right, Expanded view (boxed region from left) of X-Rhod-5F and GCaMP responses to one AP (line above trace indicates stimulus duration). B-E, Responses to trains of APs for X-Rhod-5F (B), GCaMP (C), Camgaroo2 (D), and Inverse Pericam (E). A scaled copy of the X-Rhod-5F single AP fluorescence response has been overlayed on the single AP response in C-E (gray trace). Each trace is the average of four to eight trials from the same cell.
- Figure 3.
SNRs of fluorescence responses to APs. Data with additional AP trains (frequencies: 20, 30, 50, and 70 Hz) are in supplemental material (available at www.jneurosci.org). A-E, Fluorescence responses to trains of APs delivered at 20 and 70 Hz [black trace is the mean response, colored traces indicate the SEM, and dashed horizontal lines depict different SNRs; 1, blue; 2, green; 3, red]. The SNR is the ratio of ΔF/F to the SD, σ, of ΔF/F from the background fluorescence. The red (A; X-Rhod-5F; N = 8 cells) and green (B; Fluo4-FF; N = 8 cells) synthetic Ca2+ indicators respond to all stimuli, including single APs. GCaMP (C; N = 13 cells), Camgaroo2 (D; N = 6 cells), and Inverse Pericam (E; N = 9 cells) respond poorly (sublinear) to low-frequency AP trains and are supralinear for stronger stimuli. F-J, Left, Activity (AP number and frequency) necessary to elicit a given SNR (closed circles; same colors for SNRs as in A-E). If the indicator never reached a certain SNR, the value was set to the maximum number of APs delivered (open circles). The maximum number of APs delivered was as follows: 20 APs for 20 and 30 Hz, 33 APs for 50 Hz, and 47 APs for 70 Hz. Single APs can yield SNR ∼2 for synthetic Ca2+ indicators (F, G). GCaMP (H), Camgaroo2 (I), and Inverse Pericam (J) require stronger stimuli to obtain the same SNR as synthetic indicators. F-J, Right, Individual trials from single cells (colored lines; mean response in black; smoothed with a 50 msec averaging filter) for a stimulus with SNR ∼2.
- Figure 7.
GECI fluorescence changes are coupled to CaM structural transitions. A, Structural transitions of CaM associated with M13 peptide derived from x-ray scattering studies. The abrupt change in fluorescence saturation is coupled to the structural collapse [i.e., decrease in both the maximum size (solid line) and radius of gyration (dashed line); see Discussion for details] of the M13-CaM complex after Ca2+ loading. GCaMP fluorescence is plotted for comparison. Structural data (filled circles and squares) is from the study by Krueger et al. (1998). B, Structural transitions of free-CaM. The occupation of Ca2+-binding sites adds stability to the CaM structure, causing reorientation of the N- and C-terminal domains and increases α-helical content of central helix (Sun et al., 1999). This will cause an elongation of the free-CaM molecule after Ca2+ loading (increase in both the maximum size and radius of gyration; see Discussion for details). Camgaroo2 fluorescence is plotted for comparison. Structural data (filled circles and squares) is from study by Krueger et al. (1998). The solid line (maximum size) and dashed line (radius of gyration) are linear interpolations between the points reflecting the stepwise elongation of free-CaM after Ca2+ loading.


Tables
Indicator (ΔF/F)max Reported KD (μm) Measured KD (μm) Reported n Measured n Stimulus for SNR ~2 X-Rhod-5F (1) 2.5 1.9 1.3 ± 0.5 1 1.2 ± 0.21 1-2 APs Fluo4-FF (1) 22 10.4 n/a 1 n/a 1 AP GCaMP (2) 1.8 0.24 1.7 ± 1 3.3 3.3 ± 1.2 5 APs at 20 Hz Camgaroo2 (3) ~2 5.3 ± 0.3 8 ± 1.6 1.24 1.4 ± 0.42 33 APs at 50 Hz Inverse Pericam (4) −0.25 0.2 0.9 ± 1.4 1 3.8 ± 2.1 >20 APs at 30 Hz -
Data are from the present study and (1) Yasuda et al., 2004; (2) Nakai et al., 2001; (3) Griesbeck et al., 2001; and (4) Nagai et al., 2001. The reported values for the Hill coefficient (n) and dissociation constant (KD) are from the literature (references next to indicator name). All other values are from the present study.
-
Supplemental data
Files in this Data Supplement:
- supplemental material - Supplemental Figure 1. Calibration of [Ca2+] signals from 2 synthetic indicators in response to different trains of action potentials allows quantitation of indicator saturation and reliable measurement of ?[Ca2+]. (A) Determination of the degree of saturation (?) using trains of action potentials at different frequencies (30, 50 , and 70 Hz) with the same temporal duration. This method allows determination of the saturation during each experiment, which is critical for translation of fluorescence into [Ca2+]. (B) Model of the change in fluorescence for an unsaturated Ca2+ indicator using parameters derived from experiments in primary apical dendrites. (C-D) Plot of the normalized peak fluorescence ratio (Qnorm) of X-Rhod-5F (C) and Fluo4-FF (D) versus the normalized ratio of AP train frequencies (Vnorm). Error bars are � SEM. Black line indicates the same relationship for the ideal unsaturated (B; ? = 0; Qnorm = Vnorm). Percentages (red and green text) represent saturation (?) for the given AP train frequency (black text).
- supplemental material - Supplemental Figure 2. Buffering of influxing [Ca2+] only slightly perturbs amplitude and timecourse of GECI fluorescence. (A) Recordings made from cells during loading with X-Rhod-5F were monitored using single AP transients (red traces; bottom row; time after break-in indicated). The decay of the amplitude of the transients (from 60% to 15%) and the increase in decay time (from 880 msec to 2200 msec) reveals added buffering as cell fills, but single AP and AP train GECI responses (green traces; middle and top rows; time after break-in indicated) were only slightly perturbed in amplitude. There were also slight differences in the rise and fall of the GECI signal depending on buffering, but that were consistent with ?[Ca2+] as buffer was added.
- supplemental material - Supplemental Figure 3. AP trains delivered at 20, 30, 50, and 70 Hz reveal different responses between and GECIs and synthetic indicators and each other. Trains of action potentials delivered at 20, 30, 50 & 70 Hz (columns 1-4, all rows) yielded GECI responses much different from those observed with synthetic indicators. The black trace is the mean response across cells, and the light colored traces are the mean � SEM. Analysis of SNR is given in the main text, Figure 3. (A-E) The red (X-Rhod-5F; KD = 1.9 ?M; N = 8 cells) and green (Fluo4-FF; KD = 10.4 ?M; N = 8 cells) synthetic calcium indicators respond to all stimuli, including single APs, while the GECIs show weaker responses to low frequency stimuli, making it difficult to generate fluorescence above background.
- supplemental material - Supplemental Figure 4. Determination of synthetic calcium indicator biophysical parameters in situ. (A) Models of fluorescence saturation, ?, versus [Ca2+] with different Hill coefficients (n). When n = 1, the model is identical to a hyperbolic binding model. As n increases, the transition from low to high ? sharpens. (B) The Hill coefficient versus the log interval change in calcium between 10% and 90% fluorescence saturation, ?(log10([Ca2+])10%?90%. The larger the n, the narrower the [Ca2+] range over which the transition occurs. (C) Determination of the fluorescence saturation,?, of X-Rhod-5F as a function of [Ca2+] measured with Fluo4-FF. The 50% saturation point is the effective KD of X-Rhod-5F and this value agrees well with values determined for X-Rhod-5F in vitro (KD in situ = 1.32 ?M; KD in vitro = 1.9 ?M). (D) Hill plot of data from (C) allows the determination of n (slope of least-square fit line; n = 1.11 � .21). The value obtained is close to the expected value of 1 (since X-Rhod-5F is a stochiometric calcium buffer with hyperbolic saturation).
- supplemental material - Supplemental Figure 5. Calcium buffering by GECIs perturbs X-Rhod-5F decay like Fluo4-FF, but does not alter the peak response substantially. Single cell X-Rhod-5F responses (thin red lines) and means (thick black lines) to a train of 20 APs delivered at 30 Hz in different conditions. Responses were filtered using a 50 msec averaging window and scaled to have a maximum of 1. (A) GFP transfected cells (? = .76 sec) show similar X-Rhod-5F responses as un-transfected cells. Thus, transfection of neurons did not disturb their calcium handling, but rather expression of an endogenous calcium buffer (GECI) did. (B) Cells filled with Fluo4-FF and X-Rhod-5F (? = 1.92 sec) showed slower decay than cells expressing GFP [A] or filled with the Alexa 488. (C) Cells filled with Alexa-488 (? = .45 sec), which does not bind Ca2+, show similar decay times as GFP transfected cells. (D-F) Expression of GECIs slows decay of X-Rhod-5F signal like Fluo-4FF. (GCaMP ? = 1.18 sec; Camgaroo2 ? = 1.23 sec; Inverse Pericam ? = 1.33 sec). (G) Mean responses from [A-F] comparing decay times.
- supplemental material - Supplemental Figure 6. Model of [Ca2+] accumulation and GCaMP fluorescence saturation with different KDs Model of primary apical dendrite [Ca2+] accumulation (black trace) and GCaMP fluorescence saturation assuming different dissociation constants (green traces). The lower KD (.24 ?M) corresponds to the previously reported value (Nakai et al., 2001), while the higher one (1.7 ?M) was measured here. Our data and models of [Ca2+] in large apical dendrites, as shown here, are incompatible with a KD for GCaMP less than 1 ?M.
- supplemental material - Supplemental Materials and Methods


