

Article Figures & Data
Figures
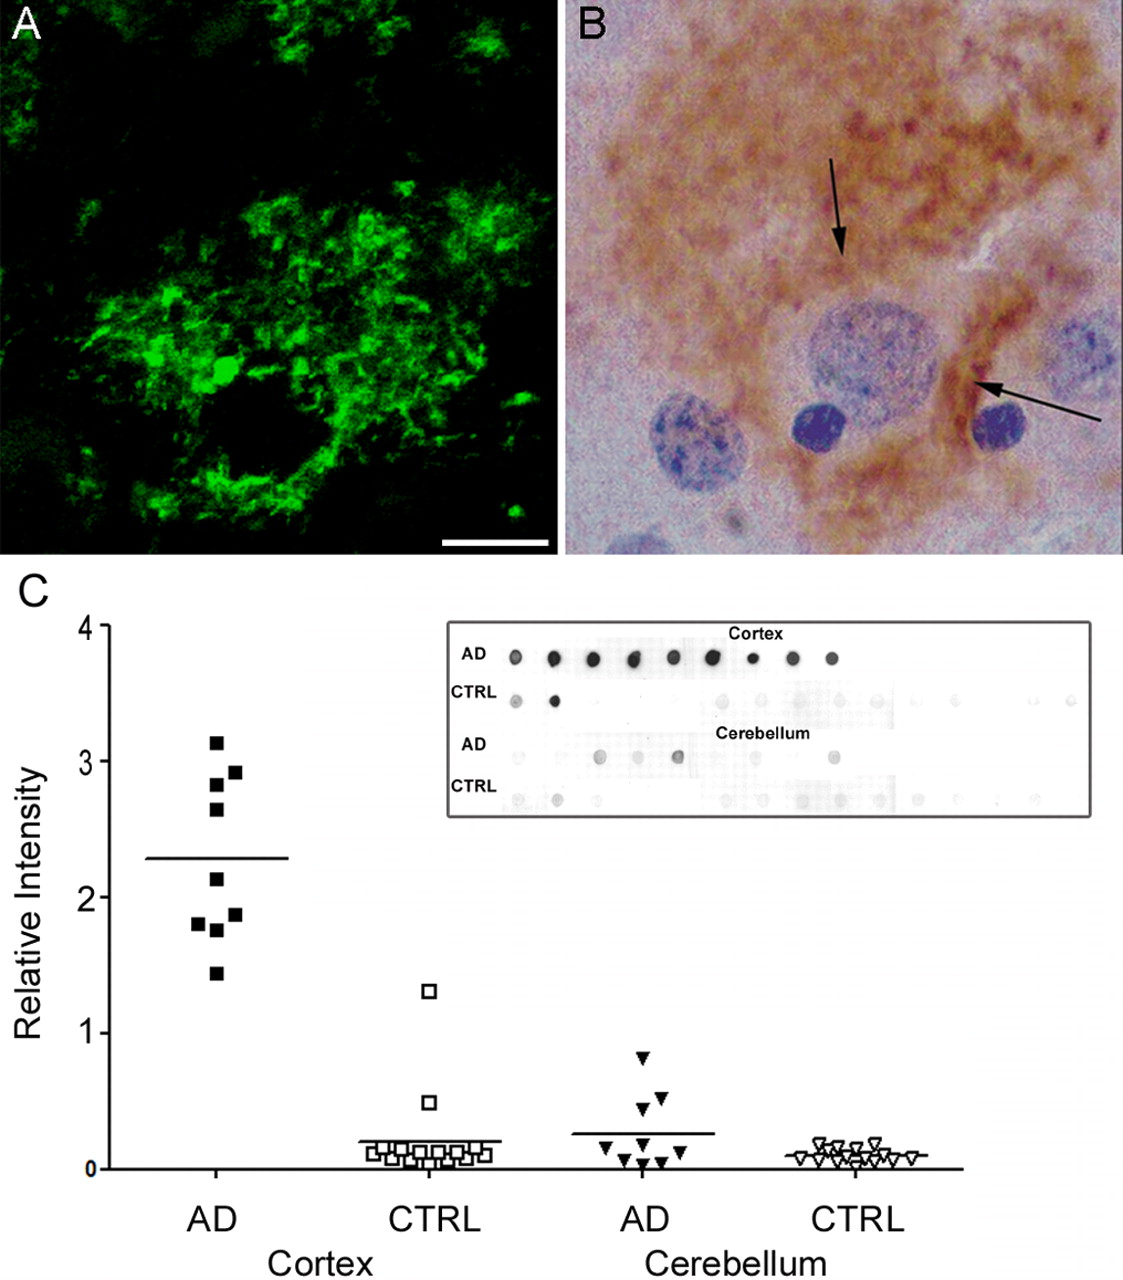
- Figure 1.
Aβ oligomers are deposited extracellularly around neurons and are highly elevated in Alzheimer's disease cortex. Sections from frontal cortex of AD brain were immunolabeled for ADDLs using M94 antibody and visualized with either fluorescent- or peroxidase-conjugated secondary antibodies (A and B, respectively). Note the diffuse synaptic-type labeling surrounding the cell body of a single pyramidal neuron in both labeling conditions (arrows). No immunoreactive deposits are observed in nondemented controls (data not shown). Scale bar: A, B, 10 μm. C, Scatter plot of soluble Aβ levels measured by dot blot from two brain regions [cortex (square) and cerebellum (triangle)] form 9 subjects with AD (filled symbols) or 15 subjects without AD diagnosis (CTRL; open symbols). Brain samples were assayed by dot blot (inset) and analyzed by densitometry. Each point is the relative intensity average of duplicate measurements. The bar indicates the mean of each group (AD cortex, 2.281 ± 0.202; CTRL cortex, 0.206 ± 0.083; AD cerebellum, 0.263 ± 0.090; CTRL cerebellum, 0.097 ± 0.013; values represent mean ± SEM). This plot shows that the scatter of Aβ levels in AD cortex is larger than in control cortex, as well as being significantly elevated over control (p < 0.0001; AD vs CTRL). For the cerebellum, however, the difference between AD and CTRL Aβ levels was not as pronounced and not quite significant (p = 0.1316; AD vs CTRL). Mann-Whitney test was used and a one-tailed p value was established to test for significance using GraphPad InStat 3 software.
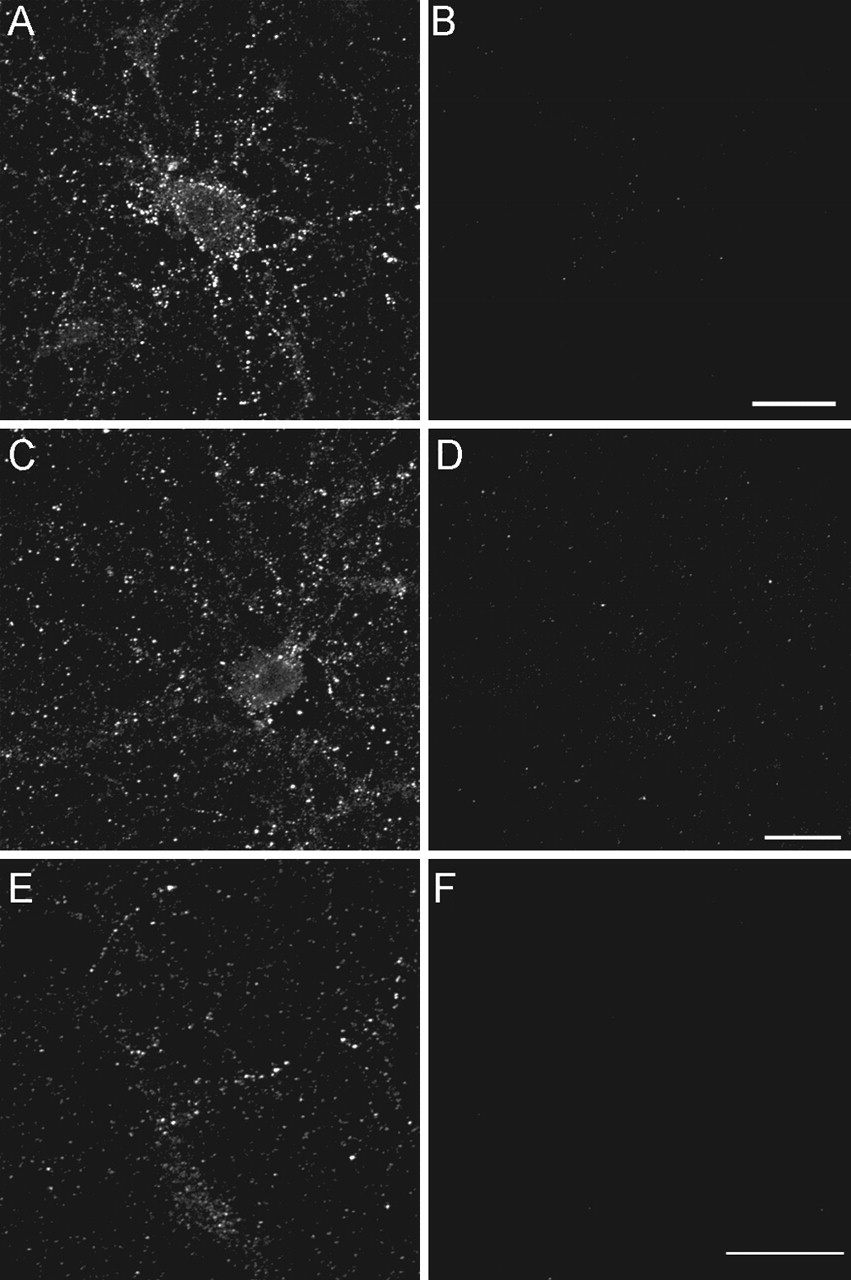
- Figure 2.
Aβ oligomers from AD brain bind neurons with punctate specificity. Primary hippocampal neurons were incubated for 30 min with soluble extracts from AD frontal cortex (A) or AD CSF (E). Some cultures were incubated with age-matched control cortical extract (B) or CSF (F). In some experiments, hippocampal neurons were incubated similarly with Centricon-fractionated soluble AD extract (see Materials and Methods) containing species with MW between 10 and 100 kDa (C) or species with MW ≤ 10 kDa (D). Unbound species were washed out, and ADDL attachment was assessed under nonpermeabilized immunolabeling conditions using the rabbit polyclonal oligomer-specific M94 antibody [as described by Lambert et al. (2001)]. Soluble extracts from AD brain (A) and CSF (E) contain ADDLs that bind selectively to neuronal surfaces with a punctate distribution. No labeling was detected with cortical extract (B) and CSF (F) from age-matched controls. Centricon filter fractionation of AD extracts containing species with an MW ranging from 10 to 100 kDa showed punctuate staining indistinguishable from unfractionated soluble extract, whereas binding species were not present in the fraction containing species with MW ≤ 10 kDa. Similar observations were obtained from three independent experiments.
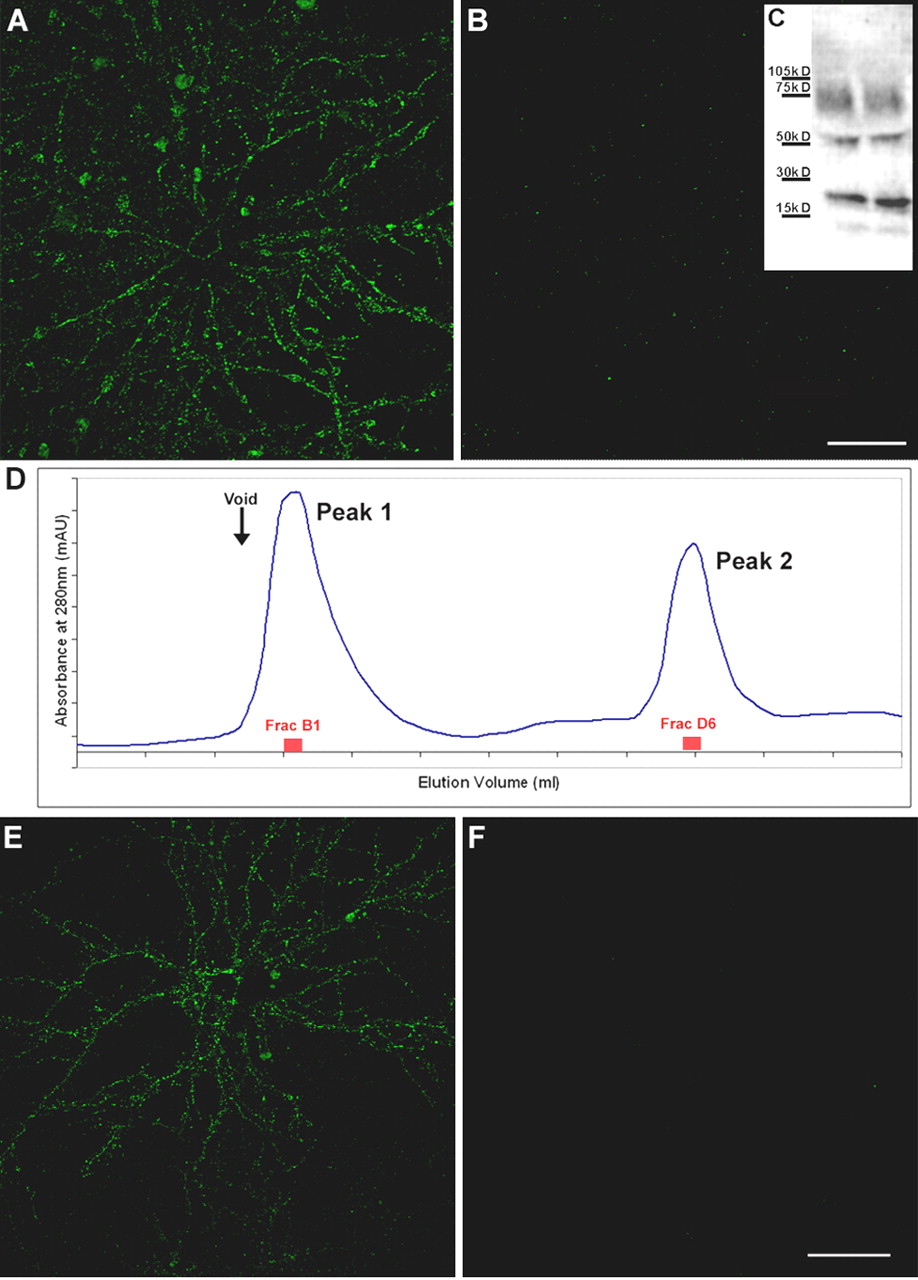
- Figure 3.
Synthetic ADDLs, but not low molecular weight species, bind neurons analogously to AD-derived species. Primary hippocampal neurons were incubated with synthetic ADDLs fractionated by a Centricon filter (A, B) or biotinylated ADDLs separated by size exclusion chromatography (E, F) for 30 min [as described in Chromy et al. (2003)]. After removing unbound species by washing with fresh media, cell-bound ADDLs were assessed under nonpermeabilized immunolabeling conditions using M94 and Alexa 488-conjugated anti-rabbit secondary antibody (A, B) or Alexa 488-conjugated streptavidin (E, F). Confocal images demonstrate that oligomer immunoreactivity is at the plasma membrane of neurons and predominantly within dendritic arbors, although some binding to cell bodies is also evident. Punctate binding is reminiscent of receptor clusters and analogous to that of Alzheimer's Aβ oligomers (Fig. 2). As with fractionated soluble oligomers from AD brain, incubation of hippocampal neurons with synthetic ADDL species ranging from 100 to 10 kDa shows immunoreactive puncta (A), where as species ≤ 10 kDa, which would contain monomer and dimer, do not (B). Inset, Western blot of ADDL species present in the culture media after a 6 hr incubation with hippocampal neurons demonstrated that ADDLs are stable and contain no species with molecular weight >100 kDa (C). Lanes represent two separate culture media. Separation of biotinylated ADDLs (∼14 nmol of a 70 μm ADDL preparation) by SEC on Superdex 75 yielded two peaks (D). Histogram of elution volume versus absorbance at 280 nm depicted peak 1 at 8.1 ml with an absorbance at 16.9 mAU and peak 2 at 13.9 ml with an absorbance at 11.7 mAU. Fractions B1 and D6 with respective protein concentrations of 6.5 and 4 μm were incubated for 1 hr with mature hippocampal cells at a final concentration of 500 nm in parallel to an SEC-control fraction (taken between peaks 1 and 2). Binding of biotinylated species was detected with Alexa Fluor 488-conjugated streptavidin. Hot spots of fluorescence were observed exclusively with peak 1 fraction B1 (E), consistent with species of molecular weight >50 kDa such as 12-mers. No fluorescence was seen with the peak 2 fraction D6 (F) or the control fraction (data not shown). Confocal images were acquired with constant confocal microscope settings (laser power, filters, detector gain, amplification gain, and amplification offset). Images are representative of three different experiments. Scale bar, 40 μm.
- Figure 4.
ADDL binding is cell specific. Double-labeling immunofluorescence studies were performed on mature hippocampal neurons (21 DIV) with mouse monoclonal anti-αCaM kinase II and rabbit polyclonal anti-ADDL (M94) and visualized with Alexa Fluor 594 (red) and Alexa Fluor 488 (green) secondary antibodies, respectively (A, B). Similar double-labeling experiments were conducted with mouse monoclonal anti-PSD-95 (C, red) and anti-ADDL (green). Overlays (B, C) of three-dimensional reconstructed images of confocal z-series scans (taken at 0.5 μm steps) show that ADDLs bind selectively to some αCaMKII-positive neurons (overlap appears yellow), depicted here after 6 hr incubation with ADDLs. Similar cell selectivity was observed with the PSD-95 labeling. Note that only one of the two neurons is targeted by ADDLs. Similar cell-specific binding and colocalization between ADDLs and αCaMKII- or PSD-95-positive neurons was observed after 30 min incubation of ADDLs (data not shown). DIV, Days in vitro. Scale bar, 20 μm.
- Figure 5.
ADDLs specifically target a subset of PSD-95-positive terminals. Hippocampal neurons treated with ADDLs were double immunolabeled for PSD-95 (A, red) and ADDLs (B, green). Overlay of the confocal reconstructed z-series scans shows that dendritic clusters of ADDL-immunoreactive puncta colocalized almost completely with PSD-95, as seen by the amount of yellow puncta in the merged image (C). The degree of colocalization between ADDLs and PSD-95 was quantified using MetaMorph software. Bar graphs show the number of PSD-95 sites targeted by ADDLs (E) and the number of ADDL binding sites colocalized with PSD-95 (F) for 14 different fields (40× objective). Graph (E) shows that many PSD-95 sites are unoccupied by ADDLs (yellow bar, PSD-95 colocalized with ADDLs; red bar, PSD-95 without ADDLs) (mean total oligomer binding sites per field was 1062 ± 125; mean oligomer sites that colocalized with PSD-95 was 971 ± 105). Graph (F) shows for each field the proportion of ADDL puncta localized to PSD-95 synaptic sites. The number of ADDLs at PSD-95 sites (yellow bar) greatly exceeds ADDLs at nonsynaptic sites (green bar). Pie charts illustrate the distribution summed for all fields, showing the fraction of PSD-95 sites occupied by ADDLs (G) and the fraction of ADDL binding sites colocalized with PSD-95 (H). Results are presented as an average percentage ±SEM for all 14 different fields (mean total sites per field was 1960 ± 174, with 50 ± 2% not associated with oligomer binding sites). In summary, one-half of PSD-95 puncta are targeted by ADDLs (G), whereas >90% ADDL puncta colocalize with PSD-95 (H). Analyses verify that ADDLs specifically localize to a subset of synaptic sites. Scale bar, 10 μm. D, Inset, Image of hippocampal neurons showing ADDLs (green) juxtaposed to presynaptic marker, synaptophysin (red), rather than superimposed, as above.
- Figure 6.
Localization of ADDL binding sites to dendritic spines. Highly differentiated hippocampal cells (21 DIV) treated with synthetic ADDLs for 1 hr were double immunolabeled for ADDLs (green) and αCaMKII (red). An ADDL-bound αCaMKII-positive neuron is pictured (A). Higher magnification illustrates that many of the ADDL-IR puncta codistributed with αCaMKII-enriched dendritic spines (B). As indicated by arrows, ADDLs mainly targeted dendritic spines. Image is representative of three separate trials. Scale bars: A, 40 μm; B, 8 μm.
- Figure 7.
Rapid ADDL-induced synaptic expression of the immediate-early gene Arc. Hippocampal neurons were exposed to synthetic ADDLs for 5 min and then labeled for Arc (red) and ADDLs(green). Merging of the images shows points of colocalization between ADDL puncta and Arc-positive synapses (yellow). Scale bar, 8 μm.
- Figure 8.
ADDLs promote sustained upregulation of Arc. Hippocampal cells treated with vehicle (A, C) or ADDLs (B, D) for 1 hr (A, B) or 6 hr (C, D) were fixed, permeabilized, and labeled for Arc protein. Immunofluorescence demonstrated a large ADDL-induced increase in Arc expression throughout the dendrites and dendritic spines of a subset of neurons; in vehicle-treated cells, Arc expression is restricted to the eneuronal cell body. Inset represents extracts from hippocampal cells treated with vehicle (-) or ADDLs (+) for 1 hr that were immunoblotted after SDS-PAGE using an Arc polyclonal antibody. Immunoblots show increased concentration of Arc in ADDL-treated (+) compared with vehicle-treated (-) cell extracts. Cylophilin B (cyclo) was used to normalize with respect to protein loading; ratio of Arc to cyclo IR was 0.70 ± 0.11 in controls and 3.51 ± 0.76 in oligomer-treated samples (n = 4; p = 0.01 using t test; paired 2 sample for means). Blot is representative of four independent experiments. Hippocampal cells also were treated for 6 hr with vehicle (C) or ADDLs (D) and permeabilized and labeled for Arc. High-magnification confocal images of vehicle-treated neurons show that Arc-immunoreactive puncta were localized to the dendritic shaft with only a few spine heads reaching an intensity level higher than that found in the dendritic shaft. The dendrites of ADDL-treated neurons show a punctate pattern of intense Arc-IR concentrated in dendritic spine heads as well as upregulated Arc-IR throughout the dendritic shafts and spines. Controls for the primary antibodies showed no labeling. Identical results were obtained in three independent trials. Scale bars: A, B, 20 μm; C, D, 6 μm.


