

Article Figures & Data
Figures
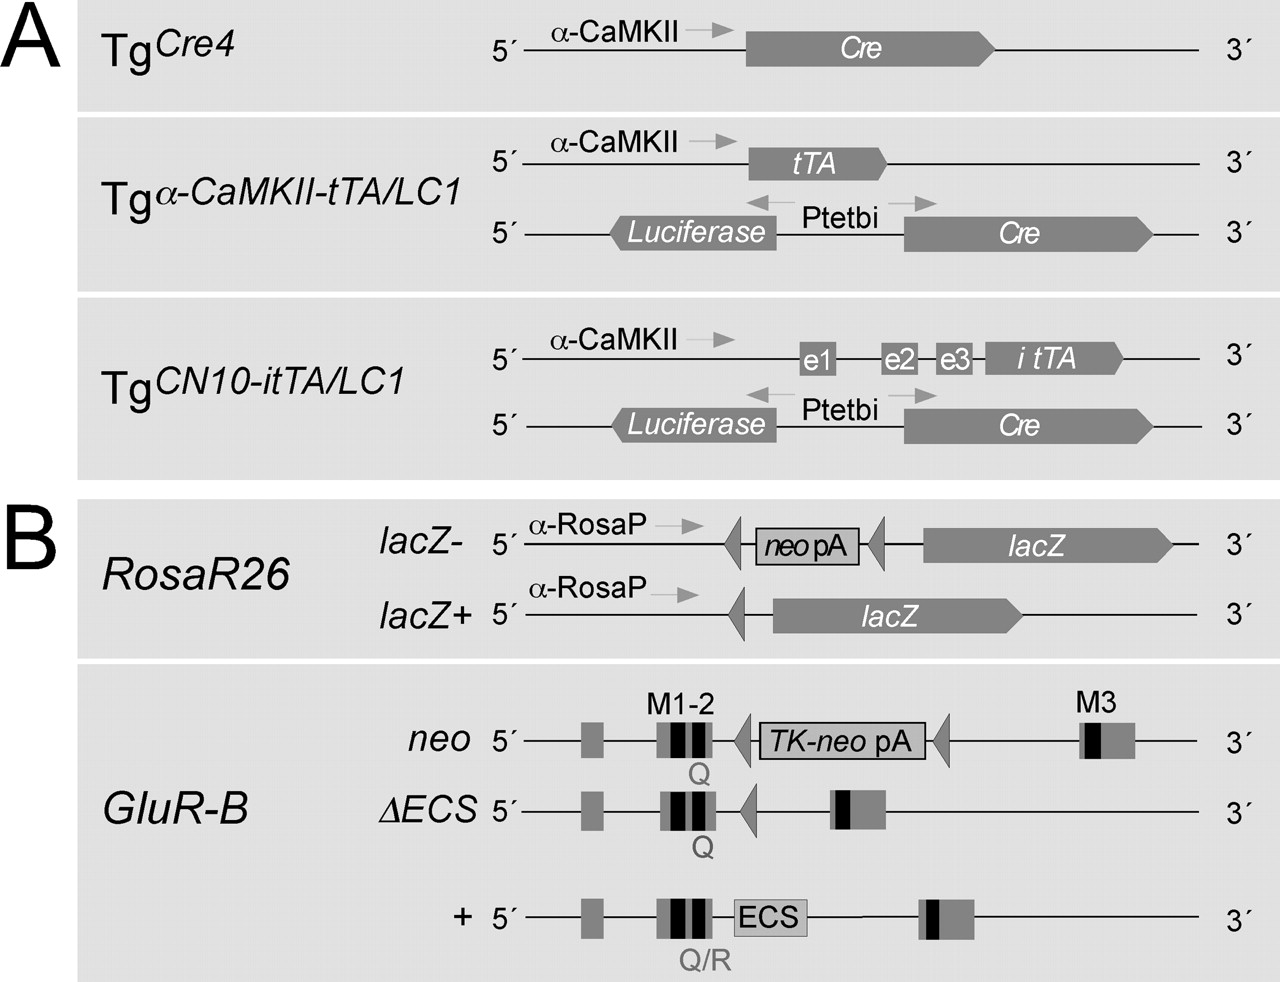
- Figure 1.
Schematic view of the genetic elements used for the conditional gene switch. A, Different transgenic lines were used for conditional expression of Cre in the mouse brain. In line Tgα-CaMKII-Cre [line “TgCre4” (Mantamadiotis et al., 2002)] is directly controlled by a 8 kb promoter fragment from the gene for the α-subunit of CaMKII. In line TgLC1 (Schonig et al., 2002), Cre expression requires activation by the transcription factor tTA, which has to be provided by other transgenes, such as from line Tgα-CaMKII-tTA. Dox inhibits DNA binding of tTA, which, without Dox, binds to the bidirectional tTA-dependent promoter (Ptetbi) to induce luciferase and Cre expression from the transgenic LC1 locus. We used the forebrain-specific tTA expression provided again by the 8 kb promoter fragment of the α-CaMKII subunit gene of mouse line Tgα-CaMKII-tTA (Mayford et al., 1996) to direct Cre expression to the forebrain. In addition, we used line TgCN10-itTA with the itTA expressed from the α-CaMKII promoter combined with the NRSE comprising three untranslated exons (e1-e3) of the NR2C gene (Suchanek et al., 1997). B, The different target genes for Cre are the targeted Rosa26 locus harboring a lacZ gene silenced (lacZ-) with a floxed transcriptional terminator sequence (neo pA) (Soriano, 1999) and the GluR-Bneo allele silenced by a floxed thymidine kinase and neomycin gene (TK-neo pA) in intron 11 (Feldmeyer et al., 1999). Exons 10-12, with 11 and 12 encoding membrane-spanning segments M1-M3 of GluR-B, are indicated together with the ECS in intron 11 of the wild-type allele, present in these mice. Cre activity excises the floxed sequences and activates the expression of the newly formed alleles Rosa26Δ (lacZ+) and GluR-BΔECS.
- Figure 2.
Regulation of Cre expression in mouse forebrain. A, Cre-immunolabeled (αCre) and corresponding X-gal-stained (lacZ) coronal brain sections and sagittal X-gal-stained cerebellar sections of TgCre4, Dox-naive (no Dox), and prenatally Dox-treated (Dox till P0) Tgα-CaMKII-tTA/LCR and TgCN10-itTA/LC1 mice. All sections were taken between P30 and P60 from mice that carried the Cre-indicator lacZ gene Rosa+/R26R to permit the visualization of Cre activity by X-gal staining. CA1, CA1 stratum pyramidale; pcx, piriform cortex. B, Confocal analysis of Cre- and NeuN-immunolabeled neurons in hippocampal CA1, DG neurons, and striatum in prenatally Dox-treated Tgα-CaMKII-tTA/LC1/Rosa+/R26R mice at P30. C, Ratios of Cre-positive to NeuN-positive neurons, in several brain regions (CA1 and CA3 stratum pyramidale, dentate gyrus, striatum, and somatosensory cortex layer 5/6). Ratios (error bars, mean ± SD) were assessed by confocal analysis (see B) from four sections of three Dox-naive and three prenatally Dox-treated mice. Note that prenatal Dox exposure increases the extent of mosaic expression substantially in some regions.
- Figure 3.
Survival curves of GluR-B(Q)-expressing mice. TgCre4/GluR-B+/neo mice showed high mortality, and, by P60, 60% died from seizures (gray line, open squares). Tgα-CaMKII-tTA/LC1/GluR-B+/neo mice (dark lines) lived seemingly normal lives with life-long Dox administration (filled circles). Without Dox (open triangles), the mice did not survive P20. When Dox exposure was confined to prenatal stages (filled squares), periodic mild seizure attacks were observed, but most mice survived. Postnatal Dox administration (open circles) prevented seizure-related death in less than half of the mice until P60. In Dox-naive mice, therapeutic phenobarbital (Pb) administration (open stars) prolonged survival, and mice surviving P50 died from seizures within 10 d after drug removal. The number of mice (n) observed for each treatment and genotype is indicated on the right.
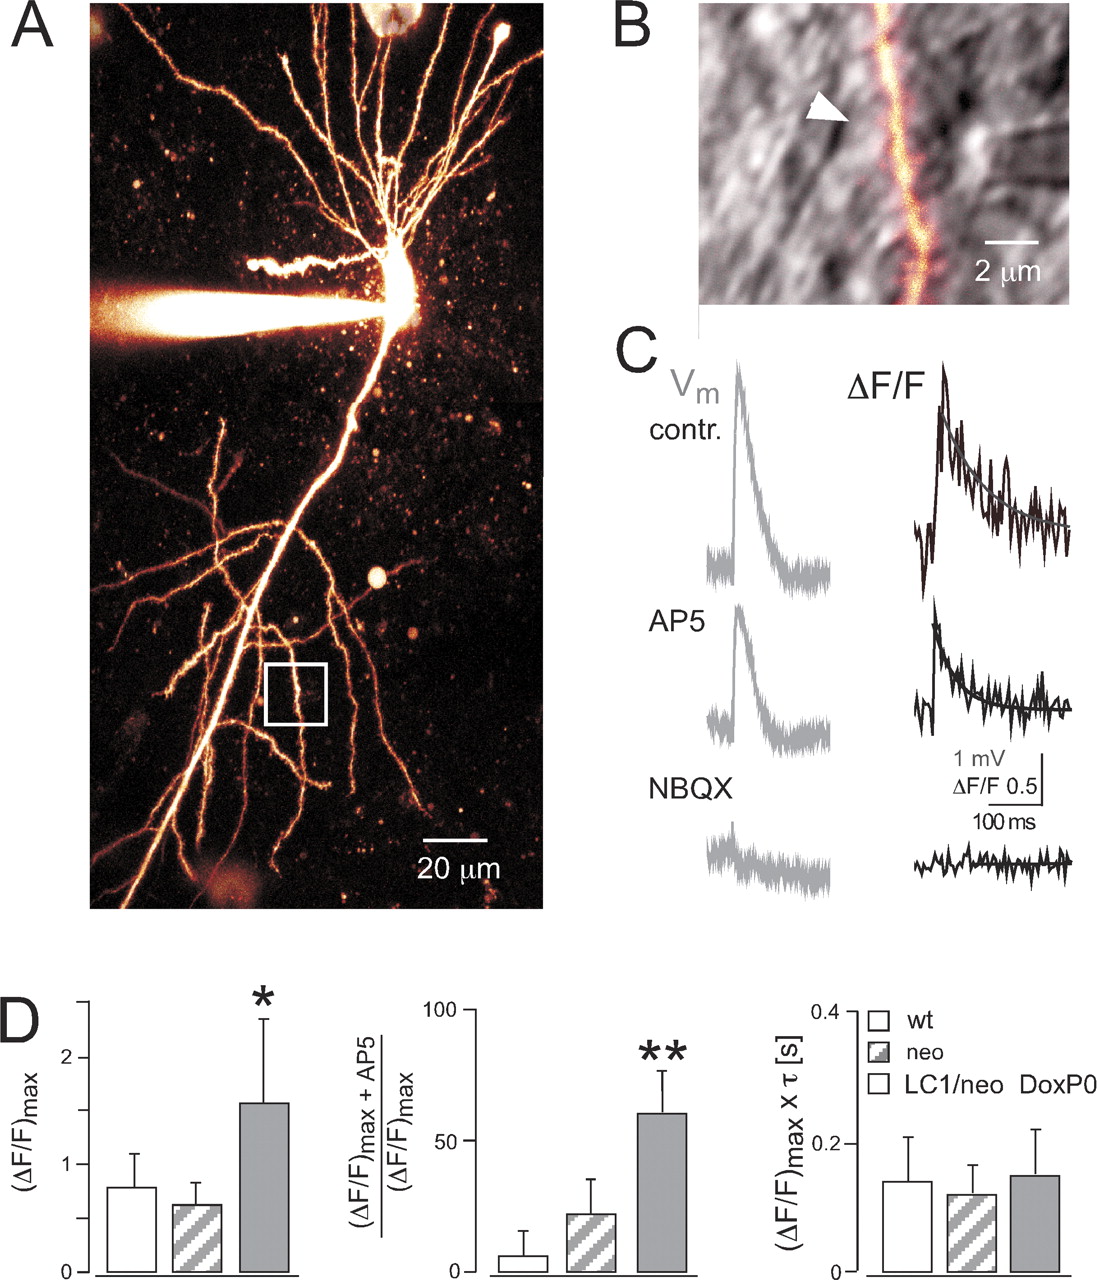
- Figure 4.
Spinous Ca2+ transients mediated by altered AMPA channels. A, Two-photon excitation image of CA1 pyramidal neuron filled with Oregon Green BAPTA-1 from prenatally Dox-treated P30 Tgα-CaMKII-tTA/LC1/GluR-B+/neo mouse. B, Enlarged view of dendritic region indicated by white box in A. The fluorescence channel is overlaid with the infrared-scanning grading contrast channel to show position of bipolar stimulation pipette close to dendrite. The white arrow indicates spine with clear Ca2+ transient after subthreshold synaptic stimulation. C, Somatic voltage recordings (Vm, membrane potential) and fluorescence changes (ΔF/F) in spine head indicated in B. Bath application of the NMDA receptor blocker AP-5 (25 μm) decreased Ca2+ influx (AP5), which could be abolished by additional application of the AMPA receptor blocker NBQX (10 μm, bottom trace). Ca2+ transients were fitted with single exponential (solid line), yielding the peak amplitude (ΔF/F)max and decay time τ. D, Left, Averaged peak amplitudes of Ca2+ transients. *p<0.05 compared with wild type (wt) and neo. Middle, Reduction of peak Ca2+ transient amplitudes by bath application of AP-5. **p < 0.005 compared with wild type (wt) and neo. Right, Averaged time-integrated spinous Ca2+, calculated by multiplication of peak amplitude with decay time. Values represent mean ± SD.
- Figure 5.
Increased synaptic excitability in hippocampal slices from GluR-B(Q)-expressing mice. A, Top traces, Means of five consecutive synaptic responses elicited by different stimulation strengths recorded in stratum radiatum in slices from wild-type (wt, left) and GluR-B(Q)-expressing (right) mice. The prevolleys preceding the fEPSPs are indicated by a filled circle. Bottom traces, Recordings from stratum pyramidale elicited by paired-pulse stimulation (50 msec interstimulus interval). Arrowheads indicate population spike threshold, and arrows indicate the appearance of multiple population spikes. B, Stimulation strength (in nano-coulombs) necessary to elicit a prevolley of a given amplitude (0.5, 1.0, and 1.5 mV) and fEPSP amplitudes as a function of prevolley amplitude. C, Paired-pulse facilitation ratio (PPF) in the two genotypes at an interstimulus interval of 50 msec. D, fEPSP amplitude necessary to elicit a just detectable population spike (1) and a population spike of 2 mV amplitude (2). Data are shown as mean ± SEM. *p < 0.01. Number of experiments ranged from 23 to 48.
- Figure 6.
Abnormal EEG patterns by Q/R site-unedited GluR-B. A, Spikes (example taken from depth-electrode recordings), spike series, polyspikes, and sharp waves characterize interictal patterns in epidural electroencephalogram of Tgα-CaMKII-tTA/LC1/GluR-B+/neo mice treated with phenobarbital or prenatally with Dox. Interictal spikes in two prenatally Dox-treated mice (1, 2) started in hippocampus (H) and propagated to cortex (C) with constant propagation time of 12 msec (see delayed cortical peaks in relation to hippocampal peaks, calibrated by broken lines). B, Number of spikes per day, counted in epidural EEG recordings of three experimental groups (neo, GluR-B+/neo; LC1/neo +Pb, Tgα-CaMKII-tTA/LC1/GluR-B+/neo mice withdrawn from phenobarbital; and LC1/neo DoxP0, prenatally Dox-treated Tgα-CaMKII-tTA/LC1/GluR-B+/neo mice) indicated by similar symbols, with the individual mice shown in different shades of gray. Note that the number of spikes increased 1-3 days before seizure attacks but that this increase does not correlate with seizure severity.
- Figure 7.
Seizure phenotypes. Long-term EEG recordings by epidural electrodes and synchronous video observation (A-C) monitored seizures in adult Tgα-CaMKII-tTA/LC1/GluR-B+/neo mice, either prenatally Dox-treated (P69; A) or withdrawn from phenobarbital (P54; B), and in adult TgCN10-tTA/LC1/GluR-B+/neo mice (P123; C). Different phenotypes are given (m, myoclonic jerks; c, clonic; t, tonic seizures; a, complex-motor; h, hypermotor behavior; and e, exploratory activity), and durations are indicated by segments. Five fold-expanded EEG traces in B represent spike discharges during the corresponding numbered seizure phenotypes. Clinical seizure phenotypes were most severe in mice withdrawn from phenobarbital (B) were mild and of shorter duration in prenatally Dox-treated mice (A) and absent in TgCN10-tTA/LC1/GluR-B+/neo mice (C). D, EEG recordings with four depth electrodes (H1, H2, hippocampal electrodes; C1, C2, cortical electrodes) in prenatally Dox-treated Tgα-CaMKII-tTA/LC1/GluR-B+/neo mice. A seizure attack in a P92 mouse is traced by EEG recording, shown in four blocks. The seizure started in hippocampus with a 2 Hz spike pattern (block 1), followed by 40 Hz low-amplitude, fast-activity superimposed on basic α-activity (block 2), a 9-10 Hz pattern (block 3), and high-amplitude spike activity (block 4), again pronounced in hippocampus.


Additional Files
Supplemental data
Files in this Data Supplement:
- supplemental material - Supplementary Figure 1. Regulated Cre expression and activity in mouse forebrain. Cre expression and Cre-induced lacZ expression in Tga-CaMKII-tTA/LCR mice, which carried the Cre-indicator lacZ gene Rosa+/R26R to permit the visualization of Cre activity by X-Gal staining. At embryonic day 12.5 (E12.5) X-Gal staining was observed in telencephalon (te), mesencephalon (me) and spinal cord (sc) in whole embryos as well as hippocampus (hi) cortex (cx) and brain stem (pons and medulla) in paraffin sections of embryos. At postnatal days 0 (P0), P42, P20 and P52, the Cre expression pattern was dependent on the treatment of the mice with doxycycline (Dox). Cre expression was visualized by anti-Cre antibodies (Cre) and Cre activity by X-Gal staining (lacZ) in coronal brain sections containing piriform cortex (pi), amygdala (am), striatum (st) and the hippocampus (hi). Higher magnifications show the cellular Cre expression in the cortex and hippocampus (CA1, DG). Without Dox, Cre expression was abundant in the entire forebrain and substantially increased from P0 to P42. Cre expression could be suppressed by Dox treatment (P42 Dox). When Dox was present only during prenatal development (DoxP0), Cre expression by P20 was restricted to some cells in cortex, and to CA1 and DG regions in the hippocampus, but became more pronounced by P52, with Cre activity readily visible in CA1 and striatum, and to a lesser extent in the cortex and DG
- supplemental material - Supplementary Figure 2. Electrode positions after depth electrode EEG recording. Cryostat brain sections from mouse number two (see Results) show the cell damage (arrows) in cortical layers 5/6 caused by the rostral cortical (C1) and the caudal cortical electrode (C2), positioned above the striatum and the hippocampus, respectively. The tip of the bipolar hippocampal electrode (H1/H2) was located in the dentate gyrus (arrow).


