

Article Figures & Data
Figures
- Figure 1.
Responsive and unresponsive cells. We used in vivo whole-cell methods to record subthreshold responses of single neurons in auditory cortex A1. Action potentials were blocked pharmacologically. A, B, Responses of two cells to conventional pure-tone stimuli. Evoked membrane potentials are shown for an array of frequencies and intensities (the loudest tones are on the top row). Both cells exhibited robust responses to pure tones, with typical V-shaped tuning, and had similar characteristic frequencies (CFs) of 3.2 kHz (A) and 4 kHz (B). C, D, Spectrogram of a 5 sec segment of the call of a Knudsen's Frog (stimulus KF). E, F, Responses of these two cells to this sound were strikingly different. In E, this stimulus evoked robust and reliable responses, whereas in F, after a transient onset response, the cell was completely unresponsive. The cell in F was similarly unresponsive to all six natural stimuli tested (data not shown). G, This stimulus contained power at the CFs of both cells (arrows show CFs; colors match traces in A, B, E, and F). In fact, stimulus power was greater at the CF of the unresponsive cell. H, Most cells in our sample had CFs of 1–5 kHz. Arrows show CFs of the two cells in A, B, E, and F. I, Responsiveness to natural stimuli varied across cells. Here, responsiveness is quantified by the SD of the membrane potential evoked by natural stimuli (note that nonstimulus-evoked activity also contributes to this measure). Arrows show the different responsiveness of the two cells in E and F.
- Figure 2.
Natural stimuli and responses. Most of the stimuli used in this study were animal communication signals and environmental noises. A, Power spectrum of natural sounds. The sets of natural sounds tested on different cells usually varied slightly. The figure shows the mean (black line) of the power spectra of these different ensembles as well as their SD (red lines). B, Distribution of sound intensities (modulation amplitudes; same format as in A). The small peaks on the left correspond to moments of relative silence in the stimuli. C, Power spectrum of the modulation amplitudes (same format as in A). D, Spectrograms of three short stimulus sections. The spectrograms illustrate some of the diversity and complexity of the natural signals used in this study. E, Subthreshold membrane potential responses. The traces show highly reliable stimulus-locked activity to 10 repetitions of the corresponding stimuli as well as some spontaneous events. The level of spontaneous activity was stimulus dependent; note the very low level in the central panel.
- Figure 7.
Prediction success and failures. A–C, Spectrogram, measured and predicted responses for the same data as shown in Figure 2. In A, the prediction (red) captures the gross features of the mean response (black) but not the fine details. In B, the STRF rightly predicts the occurrence of most PSPs but markedly fails to predict their overall size (arrows). In C, the STRF not only underestimates the size of PSPs but, at times, completely fails to predict their overall occurrence (arrows), hinting at more complicated nonlinearities. D–F, Coherence between measured and predicted responses (solid lines), corresponding to the data shown in A–C, respectively. The coherence functions underpin the observation that the STRF succeeds at best in capturing slower temporal components. For comparison, the dashed lines replot the coherence between a single trial and the mean (compare Fig. 3B), which provide an upper bound. G–I, Calibration plot (same data as in A–C, respectively). Plotting the predicted versus the actual response reveals any static, systematic errors inherent to the linear model. The black lines show the baselines of the actual responses. Although the plot in G suggests an overall linear relationship between actual and measured responses, the plots in H and I demonstrate the presence of nonlinearities. The vertical alignment of the clouds of dots indicate failures of the STRF to predict PSPs or strong underestimation of the PSP amplitude.
- Figure 3.
Reliability of responses. A, Mean response compared with a single trial for a natural stimulus (same data as in Fig. 2 D, E, left panel). The overall correspondence between the two traces shows that the amount of spontaneous activity is relatively small. B, Average coherence functions between the mean response and a single trial for the data shown in Figure 2, D and E. The curves demonstrate that the average level of background activity depends on the stimulus. C, Noise level for different cells. The noise level was quantified as the average deviation of the single response trials from the mean response. Although the noise level differed between cells and stimuli, it was always small compared with the size of the PSPs, which typically ranged between 10 and 30 mV.
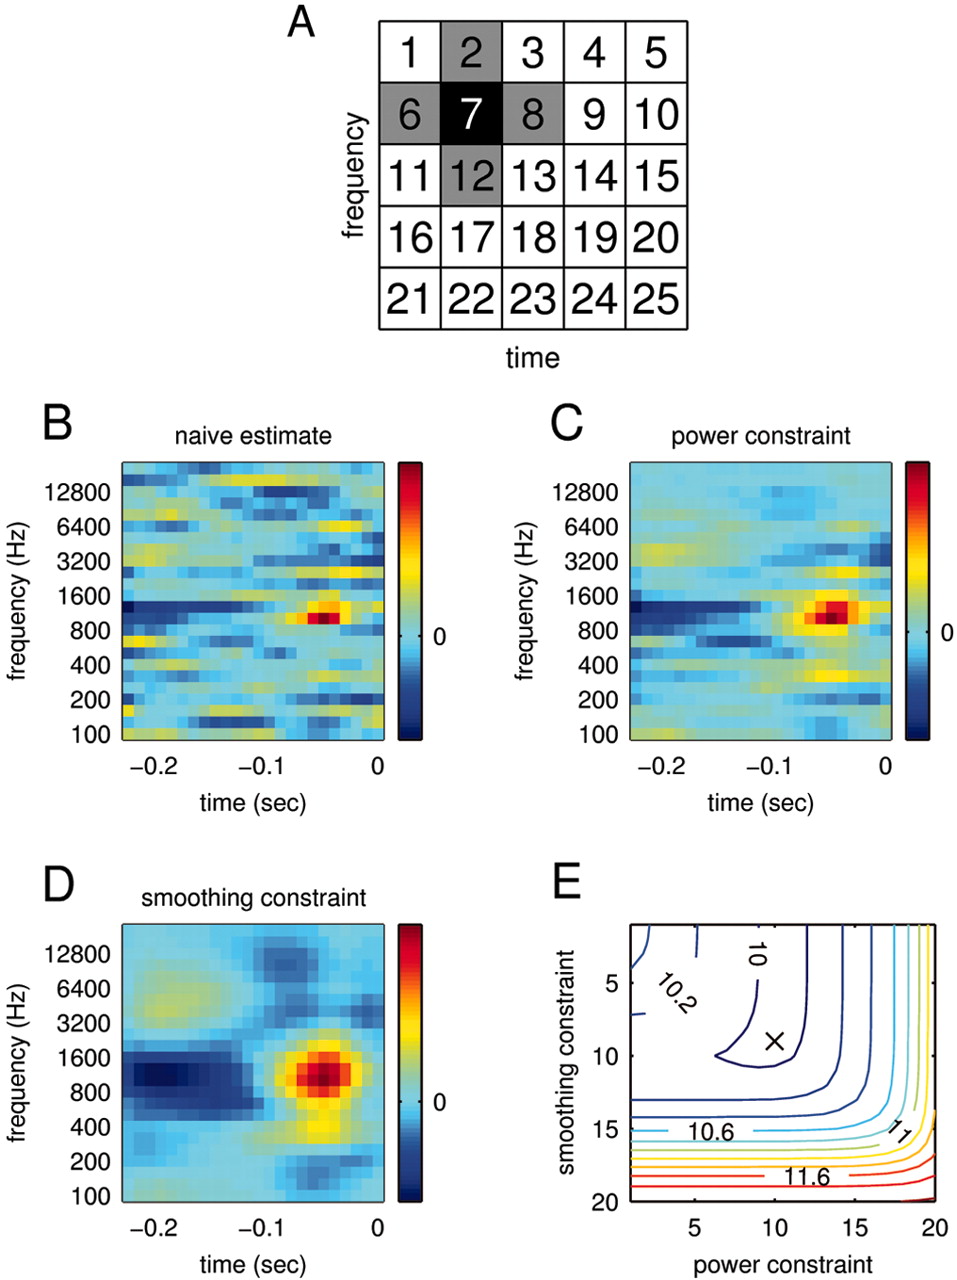
- Figure 4.
STRF estimation. To estimate a relationship between stimulus and response, we computed the STRFs of the recorded neurons. To circumvent estimation problems deriving from the usage of natural stimuli, we subjected the STRF estimation to a smoothing and power constraint. A, Range of smoothing constraints. The smoothing constraint enforces that the values of neighboring bins do not deviate too strongly. The neighbors of bin 7, for example, are shown in gray. B, Naive estimate of the STRF via linear regression. An estimate without any constraints achieves a mean square error ϵ = 5.6 mV2 between actual and predicted response on the data used for the STRF estimation (training) and an error ϵ = 10.69 mV2 on new data (prediction). The large difference indicates strong overfitting, which is also visible in the noisy structure of the STRF. C, Optimal estimate of the STRF subject to a power constraint. Here, the power constraint was chosen to minimize the prediction error. Indeed, whereas the training error increases (ϵ = 6.95 mV2), the prediction error is now considerably lower (ϵ = 9.97 mV2). D, Optimal estimate of the STRF subject to smoothing constraint. Both training error (ϵ = 7.08 mV2) and prediction error (ϵ = 10.01 mV2) are similar to those for the power constraint. E, Prediction error for different combinations of smoothing and power constraints. For this cell, combining the two types of constraints does not significantly enhance the prediction success. The absolute minimum (ϵ = 9.97 mV2) is denoted by the black cross. The STRFs inside the trough (blue contours) are therefore equally valid estimates; showing the “extremes” in C and D allows an assessment of the robustness of the estimates.
- Figure 8.
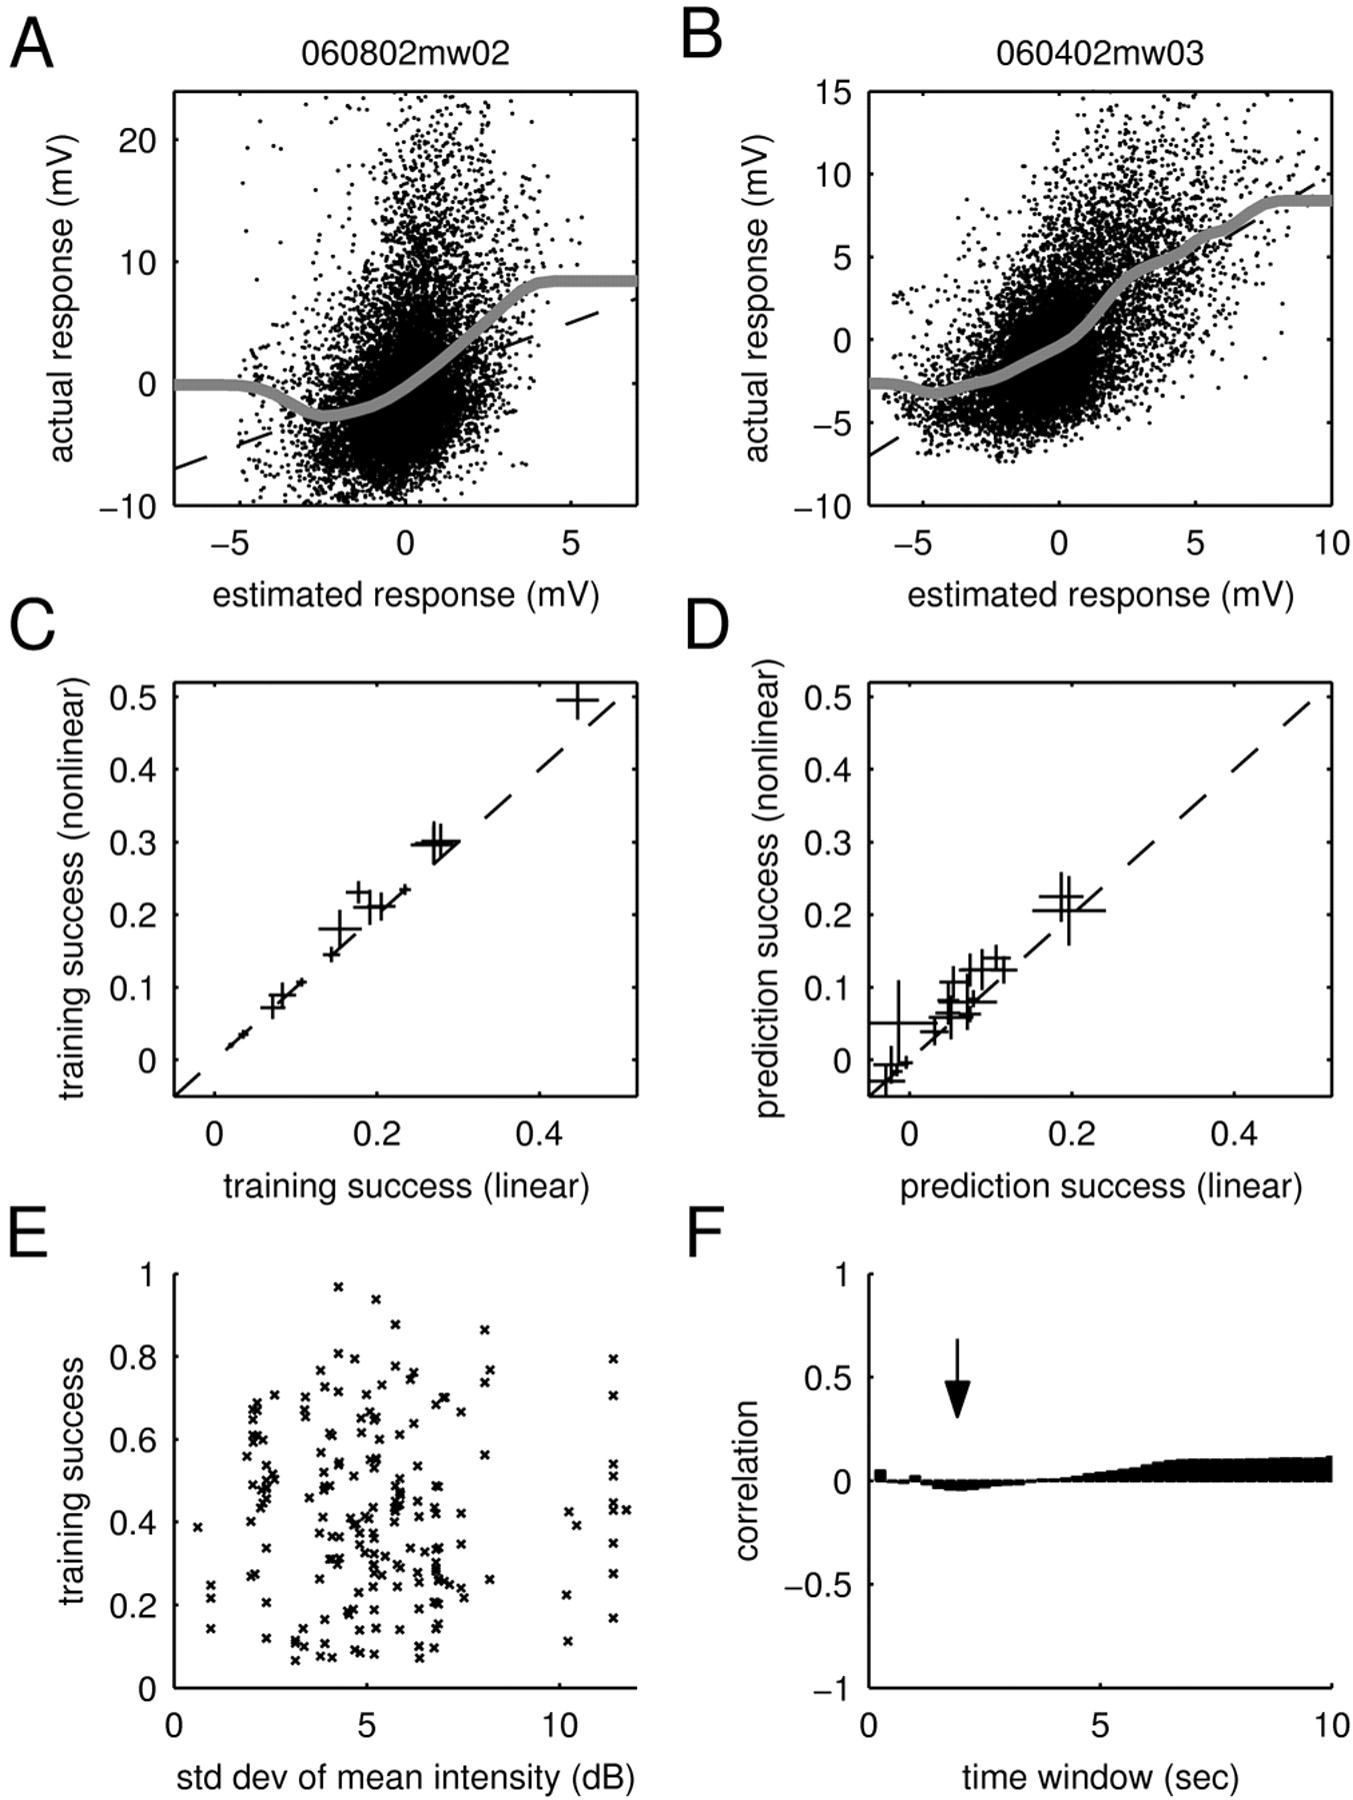
Static nonlinearities and adaptation to mean intensity. A, B, Fits of static nonlinearities to the calibration plots. Shown are scatter plots of the estimated response and the actual response (training data). The dashed lines denote the identity line, and the gray lines show fits of the static nonlinearities (see Materials and Methods). The fitted function in A deviates from the identity line within the cloud of dots, showing weak rectification. In comparison, the cell in B closely adheres to the identity line within the cloud of dots, demonstrating that this cell does not feature any static nonlinearities. C, D, Training and prediction success of the linear and nonlinear models. To assess the importance of static nonlinearities, these were incorporated into the model (see Materials and Methods). For all (n = 19) cells, the plots show the average training (C) and prediction (D) success as well as the SE. Accordingly, static nonlinearities lead to small increases in the training and prediction success in some of the cells. However, they fail to explain the dramatic shortcomings of the linear model. E, Scatter plot of the training success for different stimuli versus the respective SD in mean intensity (measured in T = 2 sec time windows). No systematic dependency is visible, demonstrating that the training success of the linear STRF model is independent of variations in the mean intensity of the stimuli for this time window. F, Correlation coefficients for different time windows (T). The arrow shows the correlationforT = 2 sec; all time windows show only a small correlation (<0.1). Because adaptation to mean intensity can only be a strong effect when the mean intensity changes strongly, the figure demonstrates that the training success is not significantly influenced by adaptation to mean intensity.
- Figure 5.
STRFs and tuning curves. A–D, STRFs for four different neurons obtained using smoothing constraints. The STRFs feature both negative (inhibitory) and positive (excitatory) contributions to the response displayed by dark blue and yellow–red, respectively. All STRFs show a sequence of inhibitory and excitatory fields; this characteristic predicts positive responses to sound onsets. E, F, Tuning curves. The STRFs predict a specific frequency tuning shown as solid red lines for the STRFs in C (panel E) and D (panel F). Overall, this prediction is in accord with the frequency sensitivity measured with pure tones. For comparison, two tuning curves recorded at 82 dB SPL (blue) and 62 dB SPL (green) are displayed. G, Comparison of best frequencies as measured by the tuning curve and the STRF. The conventional tuning curve exhibits a range of best frequencies at different intensities displayed as black bars. The characteristic frequency (best frequency at the lowest intensity) of the cells is shown as a red cross. Overall, the best frequencies predicted by the STRF (abscissa) are in good agreement with those measured with pure tones (ordinate). Some cells with incomplete tuning curves were excluded.
- Figure 6.
Summary of training and prediction success. Each point in the main panel represents the success of the STRF model in estimating the response to an individual stimulus (15 sec). For the training success (x-axis), the same individual stimulus was used for both estimating and testing the STRF. For the prediction success (y-axis), the STRF was tested on the individual stimulus but trained on all others. To permit the individual points on the graph to be resolved, only a subset of the stimuli (n = 10; chosen randomly for each neuron) is shown. Although the prediction success provides a lower bound on the capability of the model to estimate the response, the training success yields an upper bound. Surprisingly, some of the stimuli are consistently better than others across neurons [compare JC (squares) and BW (circles)]. Hence, the STRF is able to capture a significant part of the response to some stimuli, yet it fails to predict the response to others. The distribution of training and prediction success is displayed as a histogram on the top and the right, respectively. Averaged over all stimuli and cells, the training success was 39%, and the prediction success was 11%. Hence, the responses of cortical neurons to natural stimuli are dominated by nonlinearities.


