

Article Figures & Data
Figures
- Figure 1.
A, Histological verification of injection site. Cresyl violet-stained cross section of the rostral medulla. A spot of alcian blue dye (indicated by arrow) marks the location of the injection site within the IO. B, Extracellular recording of spontaneous and MCtx-evoked CS activity. MCtx stimulation evokes a short-latency field potential (*; mediated by a pathway not involving the olivocerebellar system) followed by a CS (**). C, Autocorrelogram of spontaneous CS activity from a typical Purkinje cell recorded for 20 min. The presence of an ∼11 Hz rhythmicity is demonstrated by the peaks at ∼90 msec intervals. Autocorrelogram bins are 5 msec. Central peak is truncated. The absence of counts in the bins immediately surrounding the center is caused by the spike detection routine in which a “dead time” of 30 msec is imposed after the detection of the initial deflection in the CS, so that each CS is detected as a single event.
- Figure 2.
The IO preferentially transmits ∼10 Hz afferent activity from MCtx. A, PSTHs of CS activity evoked by MCtx stimulus trains of different frequencies in one Purkinje cell. Each PSTH shows the percentage of stimuli that evoked a CS response for stimulus trains of a particular frequency. Stimulus frequency is indicated by the value in the top right corner of each PSTH. PSTH bins are 2 msec. B, Unimodal frequency-response curve. The frequency-response curve was generated by plotting the peak responses of the PSTHs shown in A as a function of stimulus frequency. Dashed trace is the Gaussian fit to the data.
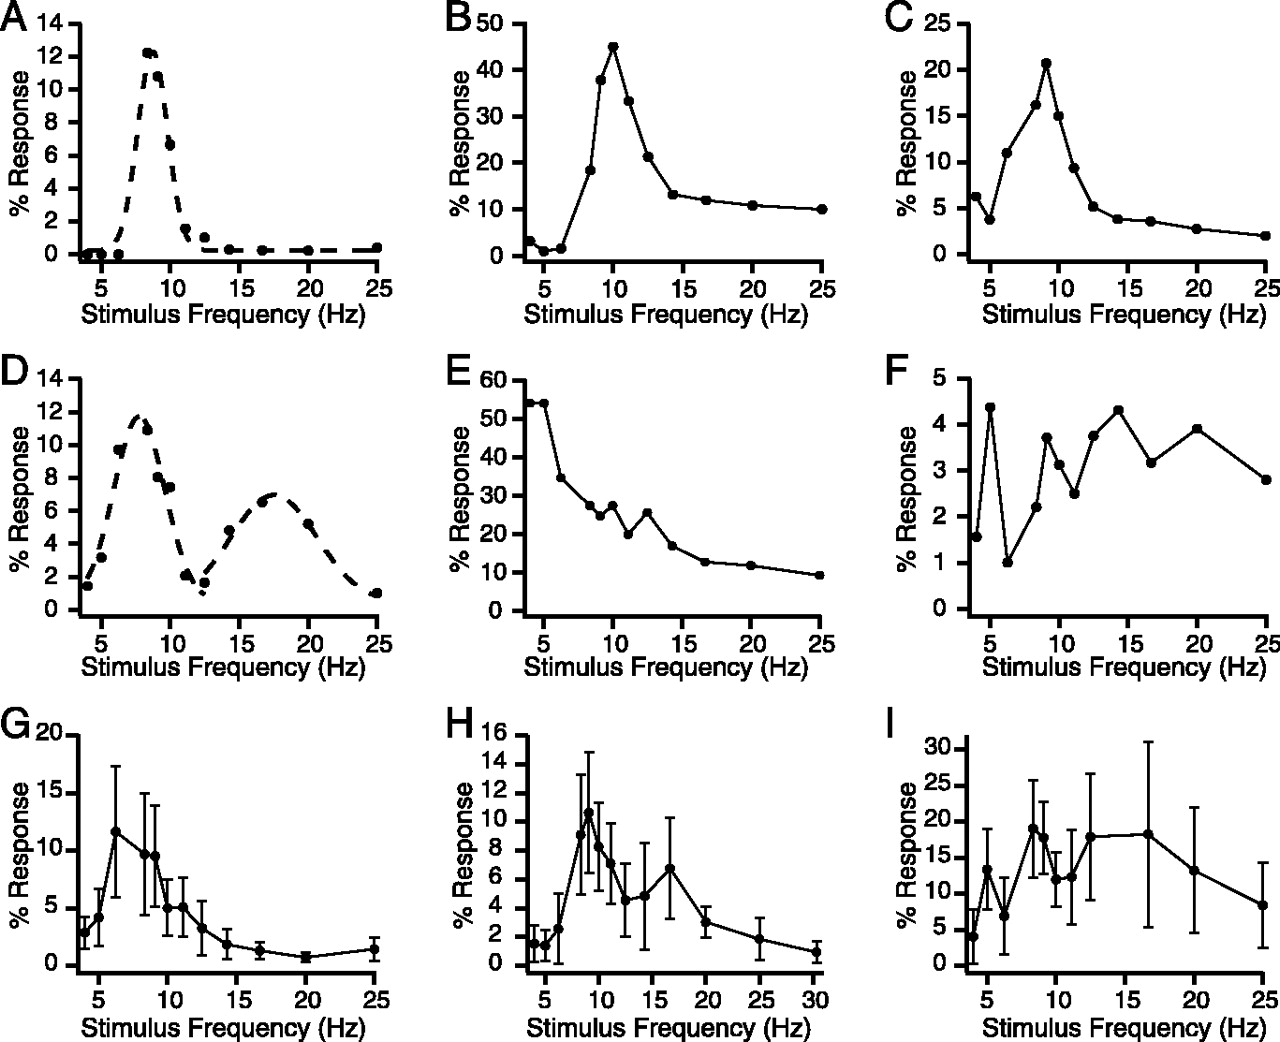
- Figure 3.
Additional varieties of frequency-response curves. A, A unimodal frequency-response curve, the most commonly observed type of curve. The dashed line shows the Gaussian fit to the data. B, C, Examples of unimodal curves with a high-frequency tail (B) and a low-frequency tail (C). D, Bimodal response curve. Dashed lines show Gaussian fits to the primary and secondary peaks of the curve. E, F, Steadily declining (E) and multimodal (F) response curves that were placed into the Other category. G-I, Population frequency-response curves from three experiments (n = 17, 24, and 29 cells) with a unimodal (G), bimodal (H), and multipeaked (I) shape. Error bars represent 1 SD.
- Figure 4.
Quality factor of the peak does not vary with resonant frequency. Plots of quality factor versus resonant frequency for cells with unimodal (A) and bimodal (B) frequency-response curves. In B, the plot shows the relationship for both the primary (filled circles) and secondary (crosses) peaks of the bimodal curves. Regression lines show that there is little to no relationship between the two variables.
- Figure 5.
Intra-IO apamin injection reduces the frequency selectivity of CS responses to MCtx stimulation. A, B, Autocorrelograms of spontaneous CS activity in control (A) and after injection of apamin to the IO (B). Note how apamin caused a decrease in the autocorrelogram peak amplitude and an increased baseline. Autocorrelograms compiled from 20 min recording sessions. Bin size = 5 msec. Central peak is truncated. C-F, Frequency-response curves in control (filled circles) and apamin (open circles) conditions. The non-normalized curves for two cells are shown in C and E, with their respective normalized versions in D and F.
- Figure 6.
Charybdotoxin selectively enhances CS responses to ∼10 Hz afferent activity from the MCtx. A, B, Autocorrelograms of spontaneous CS activity from a Purkinje cell in control (A) and after intra-IO injection of charybdotoxin (B). Autocorrelograms compiled from 20 min recording sessions. Bin size = 5 msec. Central peaks are truncated. C-F, Frequency-response curves in control (filled circles) and charybdotoxin (open circles) conditions. The non-normalized curves for two cells are shown in C and E, with their respective normalized versions in D and F.
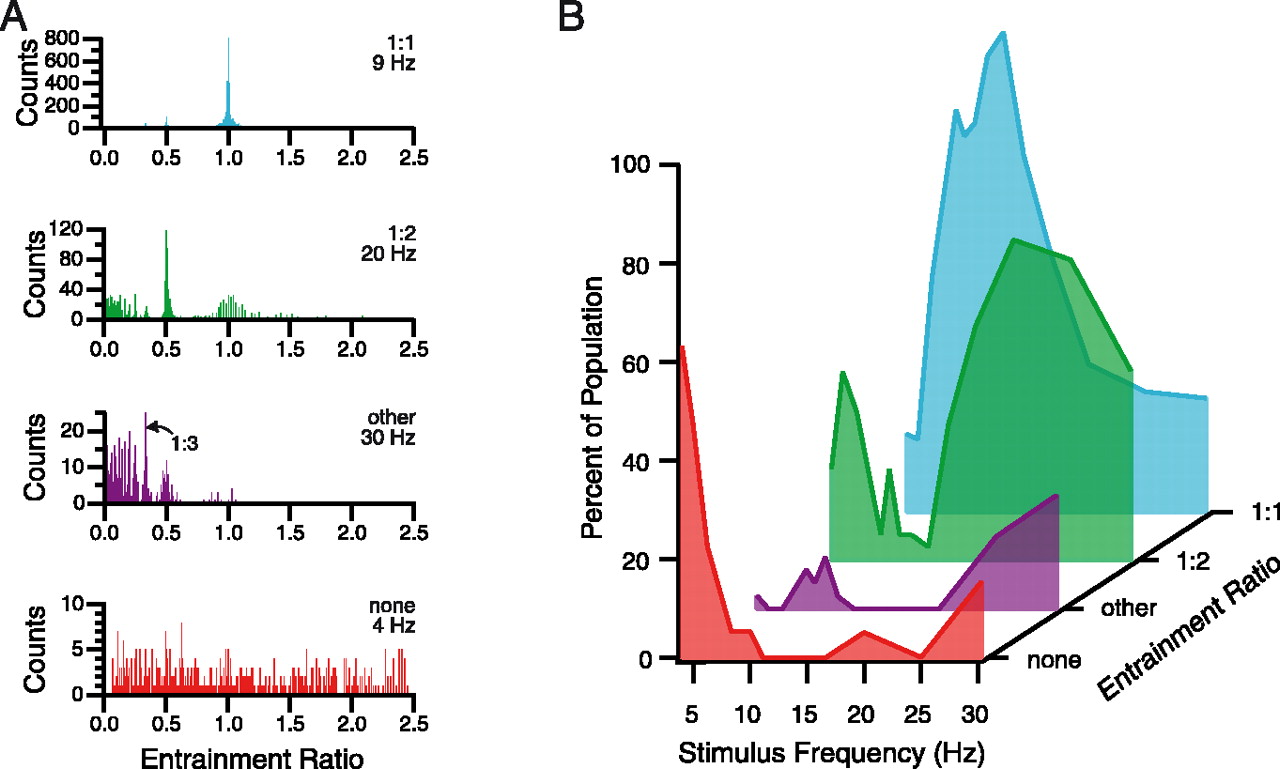
- Figure 7.
Population instantaneous frequency histogram patterns vary with stimulus frequency. A, Instantaneous frequency histograms showing the four main entrainment categories that were observed (1:1, 1:2, other, and none). Instantaneous firing frequency divided by stimulus frequency (entrainment ratio) is plotted on the abscissa of each histogram. Stimulus frequency is given in the top right corner of each histogram just below the entrainment category label. The “other” category included histograms with a peak at 0.33 (1:3, arrow in second from top histogram), and those with peaks indicating ratios of 1:4 and 1:5. B, Distribution of entrainment categories as a function of stimulus frequency. The distributions are color coded to the example histograms shown in A. Each trace shows the percentage of the population that fell into that category at each stimulus frequency. Percentages were determined by counting the population histograms in each category for each stimulus frequency. If the two largest peaks in a histogram were of approximately the same amplitude (within 20% of each other), the counts of appropriate categories were each incremented by a value of one-half. This splitting was necessary for only relatively few cases (16%; 39 of 239 histograms), and their inclusion did not change the overall distributions significantly.
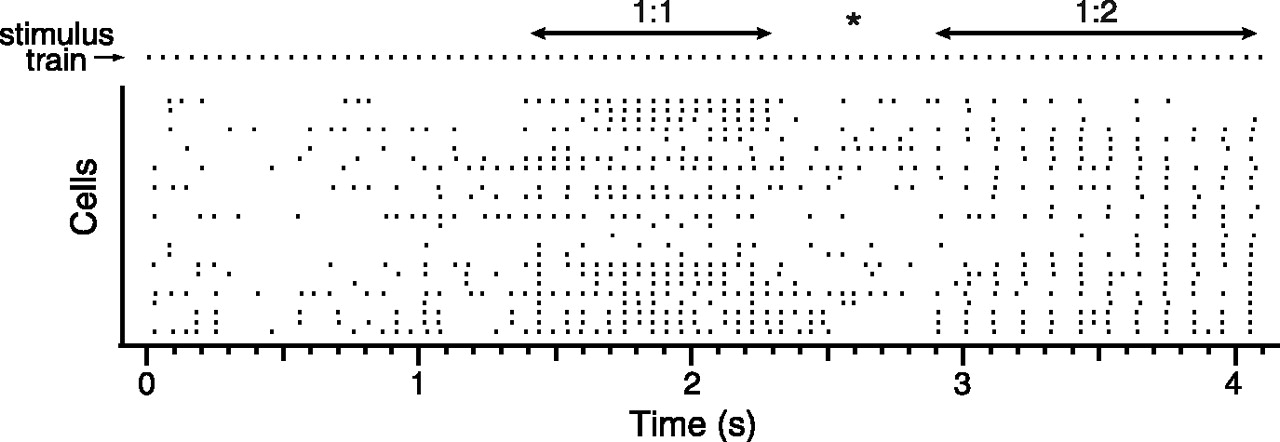
- Figure 8.
CS responses switch between entrainment patterns during MCtx stimulation. Raster display of CS activity during one 4 sec, 20 Hz MCtx stimulus train. Each row represents the CSs from a single Purkinje cell. Stimulus times are shown in top row (stimulus train). During this train, there was one period each of 1:1 and 1:2 entrainment, as indicated on the figure. Asterisk indicates transition period between 1:1 and 1:2 entrainment.
- Figure 9.
Dominant entrainment pattern varies with stimulus frequency. A, Autocorrelograms of CS activity during MCtx stimulation at various frequencies for one cell. Each autocorrelogram reflects the typical entrainment pattern from one of the three frequency ranges. The 5 and 25 Hz histograms show alternating peak amplitude patterns characteristic of the low- and high-frequency ranges. The peaks of the 9.1 Hz histogram gradually decline in amplitude, rather than alternating in size, reflecting 1:1 entrainment. B, Autocorrelograms from the CS activity of a second cell during intermediate-frequency (8.3 and 10 Hz) and high-frequency (20 Hz) stimulus trains. Note how the spacing of the peaks in the 10 and 20 Hz autocorrelograms is identical, because this cell showed only a 1:2 pattern in response to 20 Hz stimulation. Bin size = 5 msec.
- Figure 10.
Peak ratio distributions for different stimulus frequencies. The histograms show the distributions of the primary to secondary autocorrelogram peak ratio for CS activity during MCtx stimulation. Each histogram shows the distribution for a different stimulus frequency, indicated above the histogram; n indicates the number of CS autocorrelograms from which the histogram was compiled. Note that for low-frequency (5 Hz) and high-frequency (20 Hz) stimulation, a large percentage of cells have a 0% ratio, whereas for the intermediate frequencies the distribution is centered on the ∼100% bin.
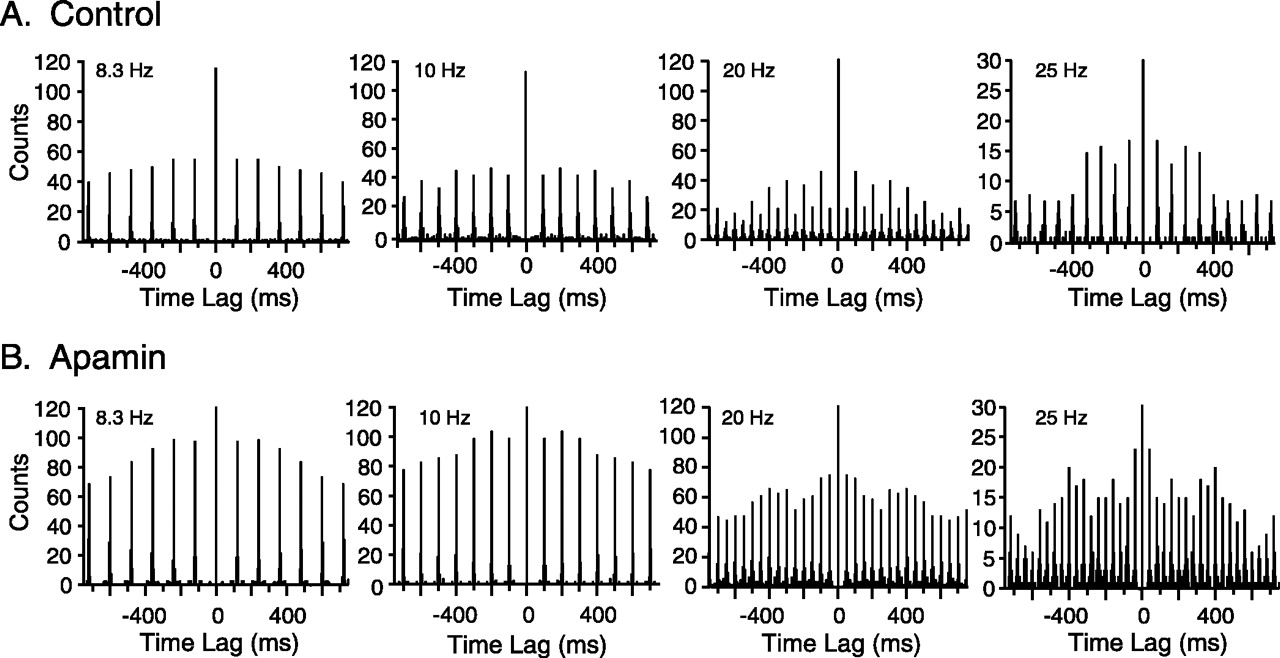
- Figure 11.
Apamin weakens 1:2 entrainment to high-frequency stimulation. A, B, Autocorrelograms of CS activity evoked by MCtx stimulation of different frequencies in control (A) and apamin (B) conditions. Stimulus frequencies are indicated on each autocorrelogram. In control (A), autocorrelograms show typical peak amplitude patterns. After injection of apamin (B), the alternating amplitude patterns to the higher stimulus frequencies are mostlyabolished. Bin size = 5 msec.
- Figure 12.
Charybdotoxin enhances 1:2 entrainment to high-frequency stimulation. A, B, Autocorrelograms of MCtx-evoked CS activity under control (A) and charybdotoxin (B) conditions. Autocorrelograms show the CS response patterns to stimulus trains of different frequencies (indicated on autocorrelograms) for one cell. This cell showed a relatively modest peak amplitude alternation at 20 and 25 Hz in control (A). Injection of charybdotoxin greatly enhanced the alternation pattern. Note the near zero amplitude of alternate peaks at 25 Hz. Bin size = 5 msec.


