
Abstract
We have shown previously that the corticospinal tract (CST) with functional connections can be reconstructed in vitro in slice cocultures. Using that system, we stimulated the deep cortical layer and recorded field EPSPs (fEPSPs) along a 100 μm-interval lattice in the spinal gray matter. The specific, spatial synapse distribution on the dorsal side at 14 d in vitro (DIV) basically corresponded to the in vivo area in which CST axons terminate. Anterograde labeling of corticospinal axons with biocytin showed a similar terminal distribution on that side. In vitro development of synapse spatial distribution was investigated. fEPSPs were recorded all across the gray matter at 7 DIV, but amplitudes began to decrease on the ventral side at 9 DIV, dorsal-dominant distribution being nearly complete at 14 DIV. Anterograde labeling showed that the decrease in fEPSP amplitudes was associated with a decrease in the number of axon terminals on the ventral area. Decreases in the synaptic responses and terminals were blocked by applications of d-2-amino-5-phosphonovaleric acid and tetrodotoxin, whereas 6-cyano-7-nitroquinoxaline-2,3-dione had a partial effect. These findings suggest that this regressive event, which occurs during development, is activity and NMDA dependent. Retrograde labeling with two colors of beads and an electrophysiological study that investigated the axon reflex showed that at 7 DIV most corticospinal neurons project to both the ventral and dorsal spinal cord, indicating that synapse decrease on the ventral side is attributable primarily to axon branch elimination rather than to death of cortical cells that send axons solely to that side.
- corticospinal tract
- slice culture
- synapse formation
- development
- activity dependence
- synapse elimination
- NMDA receptor
Introduction
The corticospinal tract (CST), the major efferent pathway from the cerebral cortex, is essential for voluntary control of movement. It often is damaged in a wide range of neurological diseases and traumas. Its role in motor control has been investigated extensively, but fewer studies have been done on its biological properties. Compared with the major afferent pathways to the cerebral cortex, including visual input, relatively little is known about CST development (Stanfield, 1982; Joosten et al., 1994). Using cerebrocortical and spinal slices, we recently developed an in vitro preparation of corticospinal synapses (Takuma et al., 2002). The excellent accessibility of various experimental procedures and preservation of the cytoarchitecture make slice culture a very promising tool for the study of synaptic development. Here, we report on the development of corticospinal synapses in this in vitro preparation.
Corticospinal axons reach the decussation point on postnatal day 0 (P0) (Rager et al., 1979; De Carlos and O'Leary, 1992) and the upper cervical cord on P1 (de Kort et al., 1985; Schreyer and Jones, 1988). After a waiting period, these axons enter the gray matter in the upper cervical cord on P3 (Gribnau et al., 1986), and that in the lower cervical cord on P4 (Curfs et al., 1994), primarily by collateral sprouting (Kuang et al., 1994; see also O'Leary and Terashima, 1988). Several previous in vitro studies of cerebral cortex and spinal cord slice cultures made with this system showed topographical specificity along the rostrocaudal neuraxis, where axons enter the spinal gray matter (Cowan et al., 1984; Joosten et al., 1993; Kuang et al., 1994), but how corticospinal synapses are formed after they invade the gray matter is not known.
Our in vitro corticospinal synapse preparation can reliably record field EPSPs (fEPSPs) (the extracellular manifestation of EPSPs) from the spinal cord in response to cortical stimulation (Takuma et al., 2002). Furthermore, recording of fEPSPs along a 100 μm lattice in the spinal gray matter allows quantitative evaluation of the formation of synapses and their spatial distribution. Previously, we studied corticospinal cocultures at 16-24 d in vitro (DIV), at which time synapses are considered to be established and the forelimb cortex to make synapses preferentially with the cervical to lumbar cord. However, a detailed quantitative analysis of the spatial distribution of synapses has yet to be reported. We systematically and quantitatively studied the spatial distributions of synapses and axon terminals at 14 DIV, as well as the development of their distributions.
Materials and Methods
Organotypic slice culture. Details have been described previously (Takuma et al., 2002). In brief, blocks of brain and spinal cord were excised from postnatal day 0 (P0) to P1 Wister rats. Coronal slices (400 μm) of the sensorimotor cortex and axial slices (400 μm) of the cervical cord in chilled Hank's solution (Invitrogen, Grand Island, NY) were sectioned with a Microslicer (Dosaka EM, Kyoto, Japan). Forelimb areas of the cortex were excised from each section with a razor blade. White matter was removed from the cortical slices and the spinal cord slices facing the cortical slices to avoid possible suppression of axon growth by the white matter (Caroni and Schwab, 1988; Takuma et al., 2002). The cortical and spinal cord slices were placed ∼500 μm apart on a collagen-coated membrane (Transwell-Col, 3.0 μm pore; Costar, Cambridge, MA). Serum-free, hormone-supplemented medium (DMEM/Ham's F-12 with 100 μg/ml transferrin, 20 nm selenium, 20 nm hydrocortisone, 20 nm progesterone, and 5 μg/ml insulin) was used and exchanged twice a week. Fetal bovine serum (5%) was present in the medium for the first 3 d. Cultures were maintained at 37°C in humidified 95% air and 5% CO2. The culture medium was adjusted to come just below the surface of the explants (Yamamoto et al., 1989).
Electrophysiological study. Slices from the culture insert together with its membrane were placed in a recording chamber and perfused with standard medium containing the following (in mm): 119 NaCl, 2.5 KCl, 1 NaH2PO4, 26 NaHCO3, 1.29 MgSO4, and 2.42 CaCl2 and equilibrated with a 95% O2 and 5% CO2 gas mixture. They were then submerged and perfused with medium at 1.1-1.8 ml/min, the temperature being maintained at 37.0 ± 0.5°C (Sakurai, 1987). The stimulating bipolar electrode was placed in the deep layer of the cortical slice, and current pulses (amplitude 500 μA, width 100 μsec) at 2 Hz were used to stimulate axons that projected to the spinal cord. A glass micropipette filled with 2 m NaCl (2-3 MΩ) was used to record fEPSPs (Ito et al., 1982) along a 100 μm-interval lattice within the spinal gray matter ipsilateral to the stimulating electrode. Responses were monitored on an oscilloscope. Signals at 10-20 kHz were sampled with an analog-to-digital converter. Data collected were analyzed online with personal computer-based software (AxoScope, Axon Instruments, Foster City, CA). fEPSPs were recorded on 3, 4, 5, 6, 7, 9, 14, and 21 DIV.
In some experiments (see Fig. 6A), another stimulating electrode was placed in the ventral area of the spinal gray matter to study interference between responses evoked by two stimulation loci. In that type of experiment, the spinal explant was placed with its dorsal side facing the cortex. The stimulation current was kept under 400 μA to avoid current spread. fEPSPs were recorded from the dorsal part.

Elimination of axon branches from the ventral side. A, Schematic drawing of the two possible mechanisms for corticospinal synapse regression from the ventral spinal cord. a, Death of cortical cells that send axons to the ventral side. b, Elimination of axon branches and synapses. S1, Stimulation to the deep layer of the cortical explant; S2, stimulation to the ventral part of the spinal explant; Rec1, recording from the dorsal part of the spinal explant; Rec2, recording from the ventral part. The arrow shows the axon reflex pathway by S2 stimulation. B, fEPSP responses to single-pulse stimulation. Response to ventral area stimulation (S2) was recorded from the dorsal area (Rec1) at 7 but not at 14 DIV. C, fEPSP responses to paired-pulse stimulation. RI and RII are the first and second synaptic responses recorded from Rec1 and are elicited by S1. RI′ is the response to S1 stimulation after S2 stimulation. At 7 DIV there is significant facilitation not only in the responses recorded from Rec1 to the paired S1 stimuli (RI and RII) and paired S2 stimuli, but to the paired S2-S1 stimuli (RI and RI′). In contrast, at 14 DIV there is facilitation of responses recorded from Rec1 to paired S1 stimuli, whereas responses to S2 are barely detectable at Rec1. Furthermore, there is no facilitation of responses recorded from Rec1 to paired S2-S1 stimuli. D, Comparisons of the normalized fEPSP amplitudes of RI, RII, and RI′ at 7 and 14 DIV. ***p < 0.001; n.s., not significant (p > 0.5).
Morphological study. After 5, 7, and 12 DIV, small clusters of biocytin powder (Sigma, St. Louis, MO) were placed on the deep layer of the cortical slice for anterograde labeling of the axons and to examine their extension into the spinal cord during development (Takuma et al., 2002), after which the cultures were incubated for 48 hr. Slices were fixed with 4% paraformaldehyde and 0.5% glutaraldehyde in 0.1 m sodium phosphate buffer, washed twice for 10 min with 1% Triton X-100 in 0.05 m Tris-buffered saline (TBS), left to react in an avidin/biotinylated enzyme solution (ABC Kit; Vector Laboratories, Burlingame, CA) in TBS with 0.1% Triton X-100 and 0.1% BSA at 4°C with gentle shaking overnight, then washed twice for 10 min in TBS. Labeled cells were made visible with nickel-intensified diaminobenzidine (Dojindo, Kumamoto, Japan) and β-d-glucose/glucose oxidase (Llewellyn-Smith et al., 1992).
As the measure of regional axonal arborization, counts of the number of cortical fibers crossing a line that traversed the dorsal or ventral spinal cord were obtained by changing the plane of focus. To do this, a line was drawn that divided the spinal cord along the dorsoventral axis 2:8 (traversing the dorsal part) or 7:3 (traversing the ventral part) (see Fig. 5C). Fiber density was calculated by dividing the number of fibers counted by the line length.

Anterograde labeling and quantitative analysis of cortical efferent axons treated with biocytin. Cocultured explants of the cortex and spinal cord. Dorsal sides face the cortex. Biocytin powder was placed on the cortical explant at 7 DIV in the drug-free culture (A) and at 14 DIV in the culture with APV. A, At 7 DIV, axon terminals are spread throughout the spinal gray matter. B, The terminals are still present in the ventral area at 14 DIV. Scale bar, 200 μm. C, Schematic drawing showing the fiber counting method. A 20% line was used to count axons in the dorsal area and a 70% line those in the ventral area. D, Ventrodorsal ratio of the numbers of cortical fibers per 1 mm. **p < 0.01.
For retrograde double labeling, fluorescent latex microspheres (red and green beads) (Lumafluor, Naples, FL) were injected to the ventral and dorsal areas of the spinal gray matter at 7 and 14 DIV (Katz et al., 1984; Katz and Iarovici, 1990). To control the positive pressure, injection was done carefully with glass pipettes (tips broken to 30 μm) connected to a syringe attached to a manipulator under a dissecting microscope to separate the two colors of beads by at least 150 μm to avoid mixing during expansion. Slices were fixed with 4% paraformaldehyde in 0.1 m sodium phosphate buffer after incubation for 48 hr. Labeled cells were viewed under a Nikon (Tokyo, Japan) fluorescence microscope (Eclipse E800). A rhodamine filter was used for the red beads, a fluorescein filter for the green ones.
Pharmacological treatment. To examine the role of neural activity in synapse formation, an NMDA receptor antagonist, 50 μm 2-amino-5-phosphonopentanoic acid (APV; Sigma); a non-NMDA receptor antagonist, 10 μm 6-cyano-7-nitroquinoxaline-2, 3-dione (CNQX; Tocris Cookson, Bristol, UK); and the Na channel blocker, 3 μm tetrodotoxin (TTX; Wako, Osaka, Japan), were present in the culture medium from day 1 until the end of culture. The drug-added culture medium was changed to drug-free medium 24 hr before the electrophysiological study, and the slices in the recording chamber were washed with the perfusate for >60 min.
Results
Corticospinal synapse distribution
Systematic, quantitative analysis showed the specific distribution of synapse formation on the dorsal not the ventral side of the spinal cord (Fig. 1A). Amplitudes of 10 points obtained from the dorsal and ventral areas (Fig. 1A, second plus third rows in the dorsal and ventral areas), respectively, were 173.3 ± 62.4 and 15.4 ± 4.9 μV (mean ± SD; n = 32; p < 0.001). (Unless otherwise stated, Student's t test was used for statistical analysis.) Because the sizes of the cultured spinal explants varied somewhat, the ventralmost row may have been outside of the gray matter in some cultures. In those cases, synapse formation on the ventral side could have been underestimated. To avoid this, we omitted the first row from the analysis. This fEPSP distribution coincides well with the spatial distribution of CST terminals in vivo (Rexed's laminae IV-VI) (Brown, 1971; Antal, 1984; Valtschanoff et al., 1993). There was also a significant mediolateral gradient. fEPSP amplitudes were higher on the medial than on the lateral side. The mean amplitude from the second to the medialmost row in Figure 1A was 98.5 ± 37.2 μV, and from the fifth to medialmost row 67.2 ± 34.5 μV (n = 32; p < 0.01). In this study, attention was focused on the dorsoventral gradient.

fEPSP spatial distribution at 14 DIV. fEPSPs recorded along a 100 μm-interval lattice in the spinal gray matter (representative recordings for two cultures) (left). Averaged fEPSP amplitude at each point (right). The dorsal side of the spinal cord explant faces the cortex (n = 32) (A), the ventral side the cortex (n = 16) (B). Amplitudes are higher in the dorsal area in both explantpositionings.
Biocytin was used for the anterograde labeling of neuronal cells in the deep cortical region and the axons to clarify the distribution of axon terminals morphologically. At 14 DIV, labeled terminals were distributed mainly in the dorsal part of the spinal explant, where fEPSP amplitudes were significantly high (Fig. 2A).

Anterograde labeling of cortical efferent axons with biocytin at 14 DIV. Cocultured cortex (Cx) and spinal cord (SC) explants. Small clusters of biocytin powder were placed on the cortical slice. A-B, Branched terminals are distributed mainly in the dorsal part of the spinal cord, both when the dorsal (A) and when the ventral (B) side faces the cortex. C, Explants were bisected at the midline. One piece was placed with the dorsal side, the other with the ventral side facing the cortex. In both cases, axon terminals are distributed mainly in the dorsal area. D, Higher magnification of the box in C. Scale bars, 20 μm.
This dorsal distribution of densely stained axon terminals and the high fEPSP amplitudes could have been caused by the close proximity of the dorsal side to the cortex. To exclude this possibility, we also placed explants with their ventral sides facing the cortex. Both groups had similar fEPSP distributions, with high amplitudes in the dorsal area (n = 16) (Fig. 1B). However, absolute fEPSP amplitudes were lower when the ventral side faced the cortex. The mean amplitude of 10 points in the dorsal area (second and third rows to the dorsalmost row in Fig. 1B) is 94.1 ± 37.2 μV, and for the same number in the ventral area (second and third rows to the ventralmost row), 44.1 ± 18.2 μV (n = 16; p < 0.001).
In the morphological study, both types of cultures, in which the dorsal (n = 12) or ventral (n = 8) side faced the cortex, had densely stained axon terminals in the dorsal area (Fig. 2A,B). Moreover, when the spinal explant was bisected at the midline, so that one half had the dorsal and the other the ventral side facing the cortex, axon terminals in both parts were distributed in approximately the same area on the dorsal side (Fig. 2C) (n = 5). The quantitative study (see Materials and Methods) showed that the number of cortical fibers per 1 mm was higher in the dorsal (117.0 ± 13.3) than in the ventral (26.2 ± 10.8) area, the ventrodorsal ratio being 0.23 ± 0.09 (n = 8) (see Fig. 5).
Developmental change in synapse distribution
Spatiotemporal development of the synapse distribution described above was studied. fEPSPs were distributed throughout the spinal gray matter at 7 DIV (Fig. 3A,B). fEPSP amplitude on the ventral side began to decrease at 9 DIV, with fEPSP distribution gradually becoming restricted to the dorsal side. This reorganization basically was complete at 14 DIV (Fig. 3C,D). Figure 3E shows the dorsoventral gradient of the normalized, averaged fEPSP amplitudes of five mediolateral points obtained at three time points during development. There are significant differences in ventral points between 7 and 14 and between 9 and 14 DIV (p < 0.001; ANOVA followed by the Dunnett test for multiple comparisons). This developmental change in fEPSP distribution occurred in both types of culture configurations, in which the dorsal or ventral side faced the cortex.
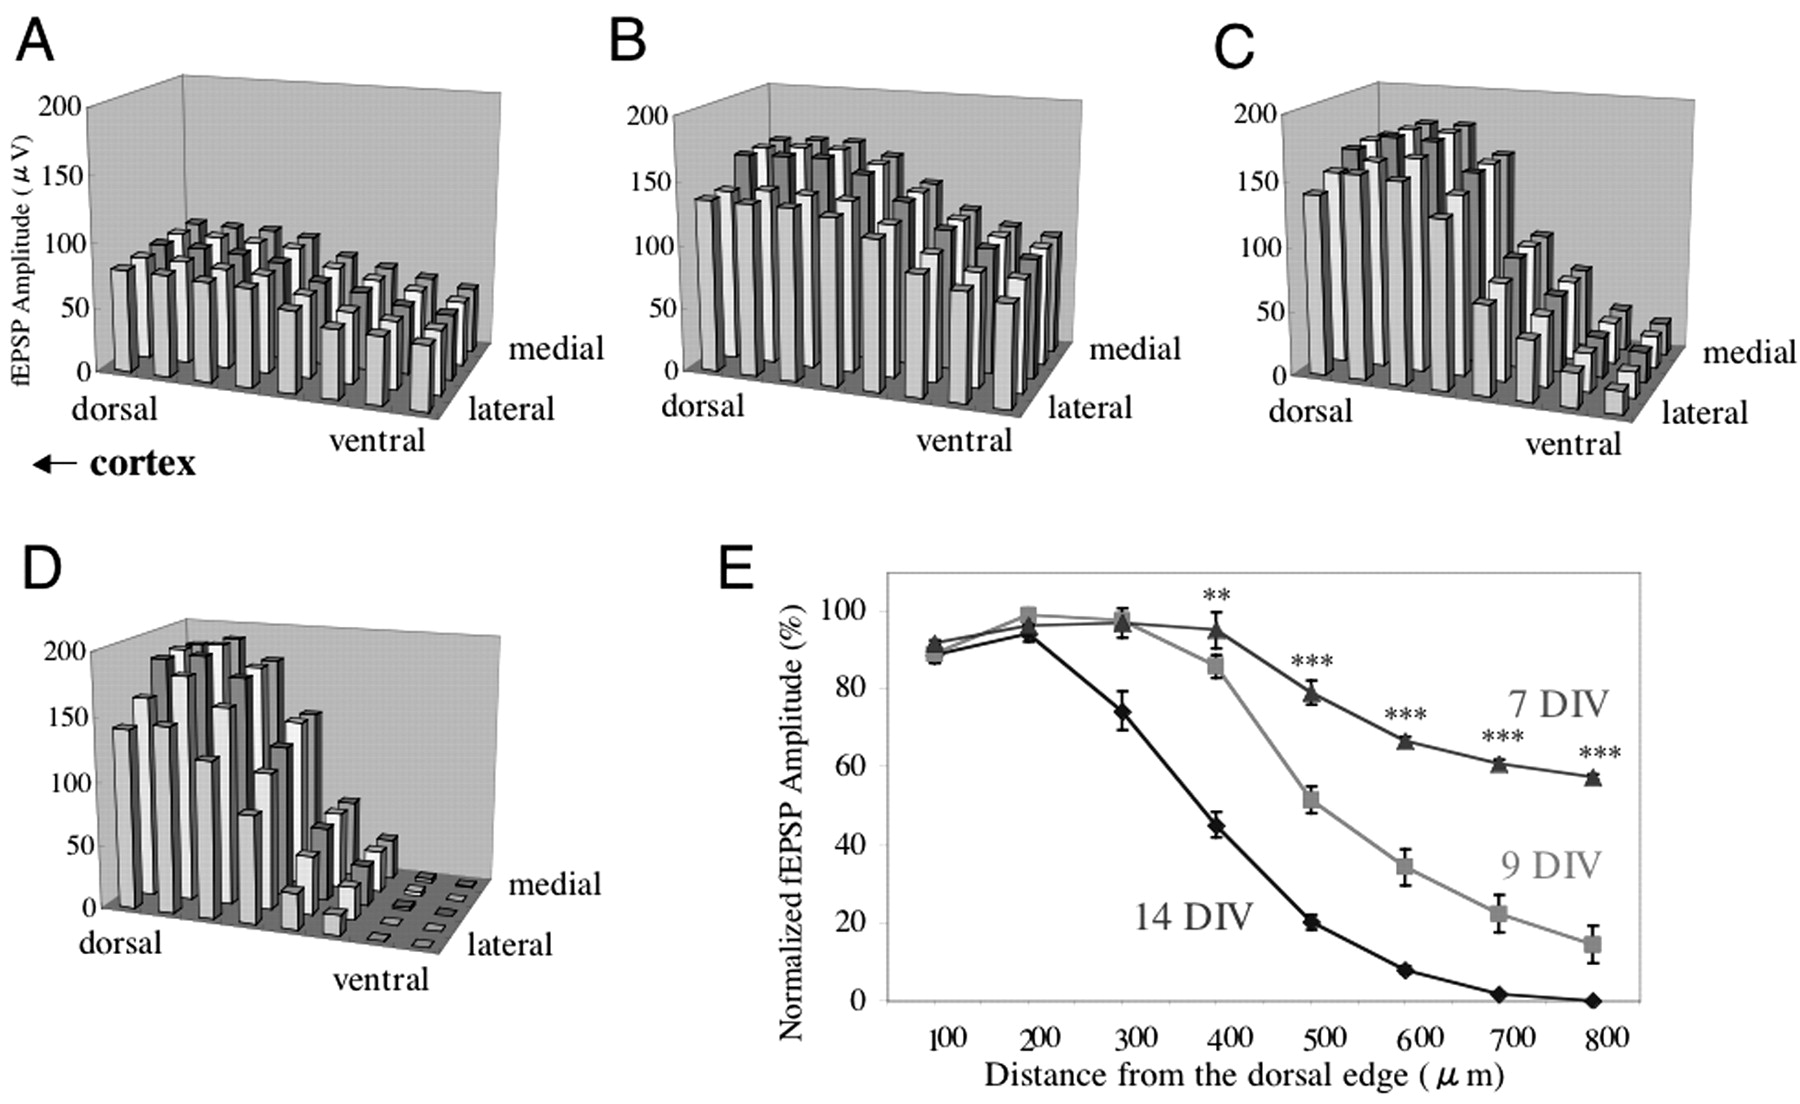
Developmental change in fEPSP distribution recorded along a 100 μm-interval lattice in the spinal gray matter. The dorsal side of the spinal cord explant faced the cortex. A, fEPSPs at 6 DIV (n = 10). B, fEPSPs are distributed diffusely throughout the spinal gray matter at 7 DIV (n = 12). C, fEPSP amplitude starts to decrease in the ventral side at 9 DIV (n = 10). D, Synapse redistribution at 14 DIV (n = 32). E, Dorsoventral gradient of the normalized average fEPSP amplitude of five mediolateral points for 7, 9, and 14 DIV. There are significant differences in the normalized fEPSP amplitudes of the five ventral points between 14 and 7 and between 14 and 9 DIV. **p < 0.01; ***p < 0.001.
Developmental distribution change also was studied by anterograde labeling with biocytin. Axonal growth into the spinal gray matter is visible from 5 DIV. Axons have continued to grow and are spread widely throughout the gray matter at 7 DIV (see Fig. 5A). Axon terminal density has begun to decrease from the ventral side, in which the regressive event is complete at ∼14 DIV (Fig. 2A). The same type of morphological change occurred when the ventral side faced the cortex. At 7 DIV, the number of cortical fibers per 1 mm of the dorsal area was 113.3 ± 19.1, and of the ventral area 71.2 ± 15.9 (n = 6). The ventrodorsal ratio at 7 DIV (0.63 ± 0.08) was significantly higher than at 14 DIV (p < 0.01) (see Fig. 5).
Activity-dependent developmental redistribution of synapses
Some regressive events during neural development are reported to be activity dependent (Cline et al., 1987; Kleinschmidt et al., 1987; Constantine-Paton et al., 1990; Hahm et al., 1991; Rabacchi et al., 1992; Fox et al., 1996; Sanes and Lichtman, 1999). Therefore, we tested whether our observed developmental events also were activity dependent. TTX or APV was added to the medium. Both prevented synapse elimination, and terminals remained widely spread even after 14 DIV (Fig. 4A,C). Mean amplitudes of 10 points in the dorsal and ventral areas (second and third row from the dorsalmost vs the ventralmost row in Fig. 1A) in the culture with APV were 166.5 ± 27.2 versus 105.8 ± 29.3 μV(n = 15). TTX had a similar effect (Fig. 4C). Mean amplitudes of 10 points in the dorsal and the ventral areas for TTX were 128.7 ± 28.7 versus 84.8 ± 20.6 μV (n = 10). The effect of CNQX was much weaker than that of APV (Fig. 4B) (n = 10). Figure 4D shows the dorsoventral gradient of normalized, averaged fEPSP amplitudes for five mediolateral points in the drug-free control, and the APV-, CNQX-, and TTX-treated cultures. There are significant differences in the ventral points for APV, TTX, and the control (p < 0.001; ANOVA followed by the Dunnett test) (Fig. 4E). The difference between ventral points in the APV- and CNQX-treated cultures also is significant (p < 0.01; ANOVA followed by the Dunnett test).

Spatial fEPSP distribution at 14 DIV when APV, CNQX, or TTX was added. A, APV in the medium prevented synapse elimination (n = 30). B, CNQX had much less effect than APV (n = 10). C, TTX had an effect similar to that of APV (n = 10). D, Dorsoventral gradient of the normalized average fEPSP amplitude of five mediolateral points in the drug-free control, APV, CNQX, and TTX. There are significant differences between the normalized fEPSP amplitudes of the control and those of the APV-, TTX-, or CNQX-treated slices at the five ventral points; moreover, there are significant differences between CNQX and APV or TTX. **p < 0.01; ***p < 0.001.
Anterograde labeling with biocytin showed that an addition of APV kept axon terminals spread widely throughout the gray matter, even at 14 DIV, similar to the control culture distribution at 7 DIV (Fig. 5B). This was confirmed by a quantitative study that showed that the mean number of cortical fibers per 1 mm in the dorsal area was 101.2 ± 38.2, in the ventral area 62.6 ± 27.4, and that the ventrodorsal ratio was 0.62 ± 0.09 (n = 6). There was a significant difference between the control and APV-treated cultures at 14 DIV (p < 0.01) (Fig. 5D).
Evidence for axon terminal elimination
Two major possible mechanisms could account for the disappearance of synaptic terminals from the ventral spinal cord: (1) Cell death of cortical neurons that send axons only to the ventral spinal cord (Fig. 6Aa). (2) Elimination of axon branches that extend to the ventral side, with branches to the dorsal side remaining intact (Fig. 6Ab). Electrophysiological experiments to detect the axon reflex were done to examine these possibilities. fEPSP responses in the dorsal area (Rec1) evoked by stimulation from the ventral area (S2) at 7 DIV had disappeared at 14 DIV (Fig. 6B). This suggests that the axon reflex pathway is present at 7 but not at 14 DIV. Results also confirm that fEPSPs evoked by stimulation to the ventral area (S2) are not caused by current spread to the dorsal side. Furthermore, at 7 DIV in the majority of cocultured slices, paired-pulse stimulation to the cortex (S1) separated by 50 msec produced significant facilitation of the second fEPSP recorded in Rec1 (Fig. 6C). The first mean fEPSP amplitude was 147.4 ± 45.7 and the second 186.7 ± 43.6 μV (n = 20). Stimulation to the ventral side (S2) produced fEPSPs on the dorsal side (Rec1), which are thought to be mediated by the axon reflex (Fig. 6Ab). This response also showed paired-pulse facilitation, the first fEPSP amplitude being 102.7 ± 20.6 and the second 128.3 ± 29.3 μV. fEPSPs of Rec1 elicited by cortical stimulation (S1) were facilitated significantly by previous stimulation to the ventral side (S2). The paired-pulse facilitation in Rec1 by S1 followed by S2 means that the two stimulating electrodes activated the same axons, evidence for Figure 6Ab, rather than 6Aa. The mean fEPSP amplitude (Rec1) to S1 after S2 stimulation was 165.1 ± 44.5 μV. Figure 6D shows that at 7 DIV the normalized fEPSP (Rec1) amplitude to S1 after S2 was significantly larger than that to S1 alone (p < 0.001), but not at 14 DIV. Figure 6B shows a clear response through the axon reflex recorded at 7 DIV, which at 14 DIV is scarcely detectable.
We made a morphological study to test the two possibilities further. Rhodamine- and fluorescein-conjugated latex microspheres (red and green beads) were inserted in the ventral and dorsal sides, respectively, or vice versa, for retrograde double staining (Fig. 7A). Because these beads are taken up only from axon terminals (Katz et al., 1984; Katz and Iarovici, 1990), the parent cells of axons making synapses in the dorsal and ventral areas could be identified. We studied selected slices, in which the expansions of the injected red and green beads were separate and limited to the spinal cord (Fig. 7A). Many neurons in the deep cortical layer were double-stained (Fig. 7). When green beads were inserted in the dorsal side, at 7 DIV the mean numbers of neurons stained were: green, 65.6 ± 12.8; red, 58.4 ± 13.0; double-stained, 52.4 ± 13.0 (mean ± SEM; n = 5). In contrast, at 14 DIV, double- as well as red-stained cells were greatly decreased (green, 58.2 ± 12.0; red, 9 ± 2.0; double, 6 ± 1.4) (n = 5) (Fig. 7C). Essentially the same result was obtained when the injection sides of the beads were reversed (red, 52.7 ± 14.7; green, 45.3 ± 14.5; double, 37.7 ± 13.6 at 7 DIV) (n = 3).

Cortical cells double-labeled retrogradely with green- and red-fluorescent latex microspheres (beads). A, Green beads were injected to the dorsal area, red ones to the ventral area of the spinal explant. Labeled cells are visible in the deep cortical layer. B-D, Higher magnification of the labeled cells in A, labeled with green beads (B), red beads (C). D, Merged image of B and C. E-G, A typical double-labeled pyramidal neuron (B-D, arrowheads). Scale bars, 200 μm. H, Numbers of cortical neurons stained green, red, and doubly (green beads were injected to the dorsal side) at 7 and 14 DIV. At 14 DIV, double- as well as red-stained neurons have greatly decreased.
In another experiment, uptake, if any, from passing or broken fibers in the dorsal area was confirmed to be negligible. A coculture was done with the ventral side facing the cortex, in which cortical axons passed through the ventral side and arborized on the dorsal side (Fig. 2B). When green beads were inserted in the ventral side, the mean numbers of neurons stained at 7 DIV were: green, 39.4 ± 12.3; red, 46.2 ± 12.9; double, 35.2 ± 12.2, whereas at 14 DIV the numbers were: green, 11.4 ± 1.9; red, 40.3 ± 13.1; double, 7.2 ± 1.7 (n = 5).
These electrophysiological and morphological findings indicate that a considerable number of cells in the deep cortical layer, if not all, send branching axons to both the ventral and dorsal parts of the spinal cord at 7 DIV and that branches to the ventral side are eliminated thereafter.
Discussion
In a previous study (Takuma et al., 2002), the fEPSP amplitude recorded from spinal cord slices, in which the dorsal side faced the cortex, was more than twice that when the ventral side faced the cortex, indicating that a greater number of synapses are formed when cortical axons enter from the dorsal side. The present findings show that axons from the sensorimotor cortex formed synapses in the dorsal area in both types of explants, whichever side faced the cortex (Fig. 2A,B), evidence that dorsal-side dominance of synapse formation is not explained solely by distance from the cortex, but rather that CST axons have a greater affinity to form synapses in the dorsal area. However, the fact that fEPSP amplitudes were lower when the ventral side faced the cortex suggests that distance from the cortex also has an effect.
Our study showed that synapse formation (recorded as fEPSPs) initially was diffuse in the spinal gray matter at ∼7 DIV, was restricted to the dorsal area from 9 DIV, and was nearly complete at 14 DIV. Such regressive events during neural development are thought to be central to the refinement of neural networks (Cowan et al., 1984). One of two mechanisms might account for the decrease in axon terminals on the ventral side: cell death of cortical neurons or elimination of axons that branch to the ventral side. We made considerable effort to differentiate between these mechanisms because solid evidence for either one received relatively little attention in previous reports on regressive events during neural development of the CNS. During retinocollicular projection in the rat, fine supernumerary axon branches are eliminated by parent cell death in an activity-dependent manner (O'Leary et al., 1986). Furthermore, when the NMDA receptor blocker, (+)-5-methyl-10,11-dihydro-5H-dibenzo [a,d] cyclohepten-5,10-imine maleate (MK-801) was applied systemically during the first to third postnatal weeks, more corticospinal neurons survived, which suggests that MK-801 prevents the death of parent nerve cells projecting to the CST (O'Donoghue et al., 1993). Both electrophysiological and morphological evidence obtained in careful experiments with our system suggest that synaptic withdrawal cannot be explained solely by cortical cell death, but rather the main cause is the elimination of axon branches and synapses (Figs. 6, 7). There is another logically possible explanation for cortical cell death. Cortical cells that project to both the dorsal and ventral sides die, whereas those that project solely to the dorsal side survive. That possibility is not ruled out by the results of the electrophysiological experiments. However, our retrograde, double-labeling experiment findings are strong evidence against it because if that were so, the decrease in green-stained cells that project to the ventral side from 7 to 14 DIV would have been much greater, and the number of double- and red-stained cells projecting to the ventral side markedly decreased.
Layer V neurons present in broad areas of the cerebral cortex, and even those in the occipital cortex, send axons to the pyramidal tract, most of which are later eliminated (Stanfield et al., 1982). That phenomenon, however, differs from our findings. Our cortical slices were obtained from the sensorimotor cortex, the source of CST axons in adults, rather than the ectopic cortex. Ectopic cortical axons do not invade the spinal gray matter, although they enter the CST (Kuang et al., 1994). Moreover, in our study axon branches were eliminated within the spinal gray matter, whereas ectopic axons were eliminated in the white matter. Therefore, axon branch elimination may take place at least at two levels along the proximal-distal axis of CST axons, before and after entering the spinal gray matter.
NMDA receptor blockade increases sprouting in the superior colliculus (Lin and Constantine-Paton, 1998; Colonnese and Constantine-Paton, 2001) and in hippocampal slice cultures (McKinney et al., 1999; Luthi et al., 2002). However, our findings are not explained by a general increase in sprouting caused by NMDA receptor blockade because in general APV did not increase fEPSP amplitudes; those of the dorsal side remained almost unchanged, whereas those of the ventral side were slightly decreased but much less so than in the control (Fig. 4A).
Footnotes
- Received August 22, 2003.
- Revision received November 2, 2003.
- Accepted November 3, 2003.
This work was supported by Ministry of Education, Culture, Sports, Science and Technology of Japan Grant-in-Aid 15300137 (M.S.) and Grant-in-Aid for Scientific Research on Priority Areas 15016097 (M.S.). We thank Drs. T. Mizuno and H. Takuma for their technical advice and Dr. H. Takagi for his help with the statistical analysis.
Correspondence should be addressed to Dr. M. Sakurai, Department of Physiology, Teikyo University School of Medicine, Kaga 2-11-1, Itabashi-ku, Tokyo 173-8605, Japan. E-mail: msakurai{at}med.teikyo-u.ac.jp.
Copyright © 2004 Society for Neuroscience 0270-6474/04/241377-08$15.00/0