

Article Figures & Data
Figures
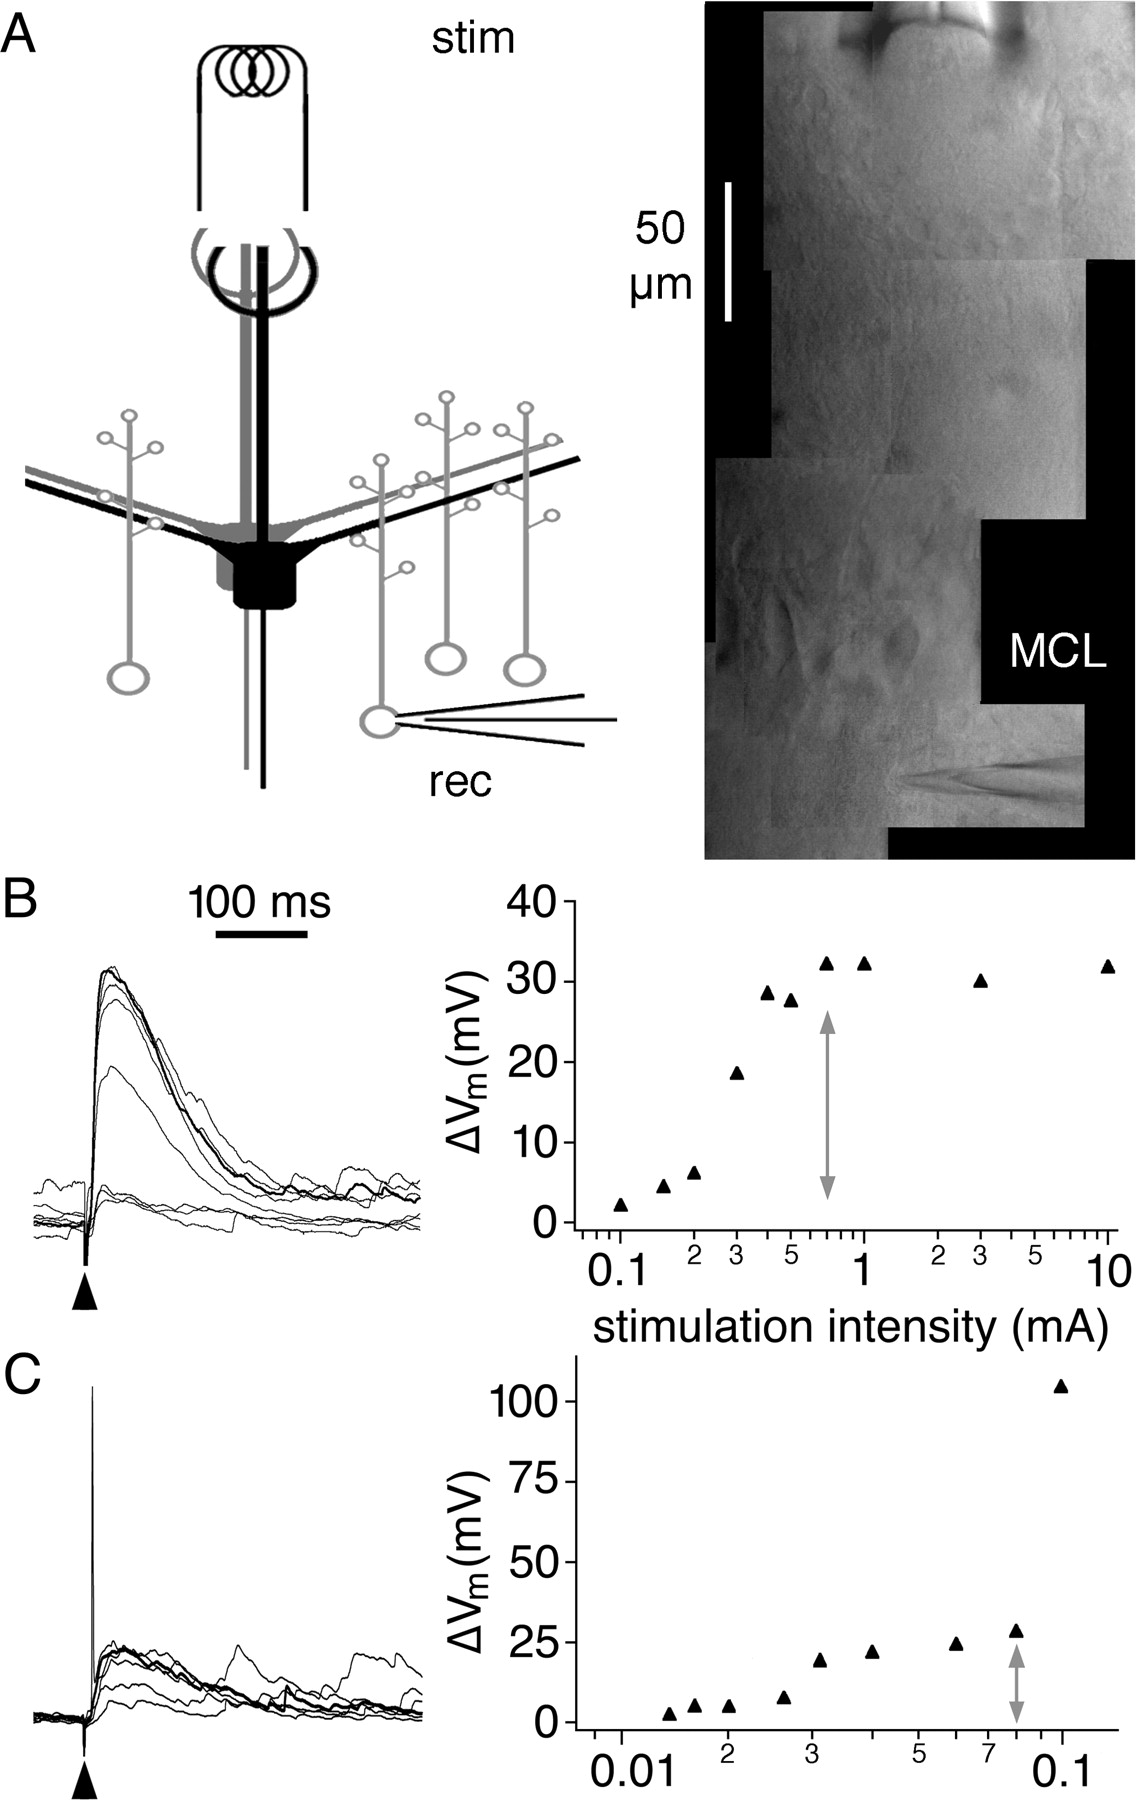
- Figure 1.
Glomerular stimulation allows for specific activation of M/TC inputs to GCs. A, Schematic and DIC video image of stimulation paradigm. To achieve stimulation of M/TC inputs, a stimulation electrode (stim) was placed into a glomerulus (note the faint ring of periglomerular cells in the video image). The direction of MC apical dendrites within the slice was then used to find the region in the MCL that would likely project to the glomerulus. A GC below this region was then patched (rec) and filled with calcium dye. B, Left, EPSPs in a GC recorded at the soma in response to increasing stimulation strength. Same voltage scale as on y-axis of the right panel. Black arrow, Stimulation artifact, clipped. Right, Input-output relationship for this GC. The gray arrow marks the stimulation strength that just saturates the response. This stimulation strength was then used during the course of experiment. “10 mA” corresponds to the maximal stimulation strength. C, Same as in B but for a GC that responded with action potentials at stronger synaptic stimulation. Same time scale as in B. The gray arrow marks the stimulation strength that was then used during the course of the experiment.
- Figure 2.
Single M/TC inputs activated by glomerular stimulation result in local Ca2+ influx into GC spines. A, Left, Scan of an individual granule cell with locations of spines tested for synaptic responses. MCL marks the position of the mitral cell layer. Gray arrowheads mark unresponsive spines, and colored arrowheads mark responsive spines. Nineteen spines were tested. Right, Snapshots of the responsive spines and one unresponsive spine shown at the magnification used for line scans (calibration below) and, to the right, averaged (ΔF/F)syn recorded from these spines. For every spine, averaged successes and failures are shown. Because the “white spine” represents an unresponsive spine, all respective recordings were averaged. The black trace at the bottom shows the averaged EPSP recorded at the GC soma. B, Individual line scans recorded in the “red spine.” Calibration as in A. Both successes and failures are shown. Gray traces are recorded in the adjacent dendrite, illustrating the localization of synaptic responses to the spine head. The bottom plot summarizes the amplitudes of all recorded traces in the red spine versus the amplitudes of the same events in the adjacent dendrite. C, Mean response amplitude (ΔF/F)syn of all active spines in this study versus their distance from the MCL. D, Scatter plot of decay time constants of AP-evoked signals (ΔF/F)sAP versus half-duration of synaptic signal (ΔF/F)syn in the same spines. Filled data points, Half-duration of synaptic signal at least twofold longer than the decay time constant of AP-mediated transient. Data points left of 2.5 s on the y-axis, Synaptic spine signal (ΔF/F)syn too slow for measurement of half-duration (within a time window of 1 s per line scan). E, Scatter plot of all mean response amplitudes (ΔF/F)syn in active spines versus in their respective adjacent dendrites.
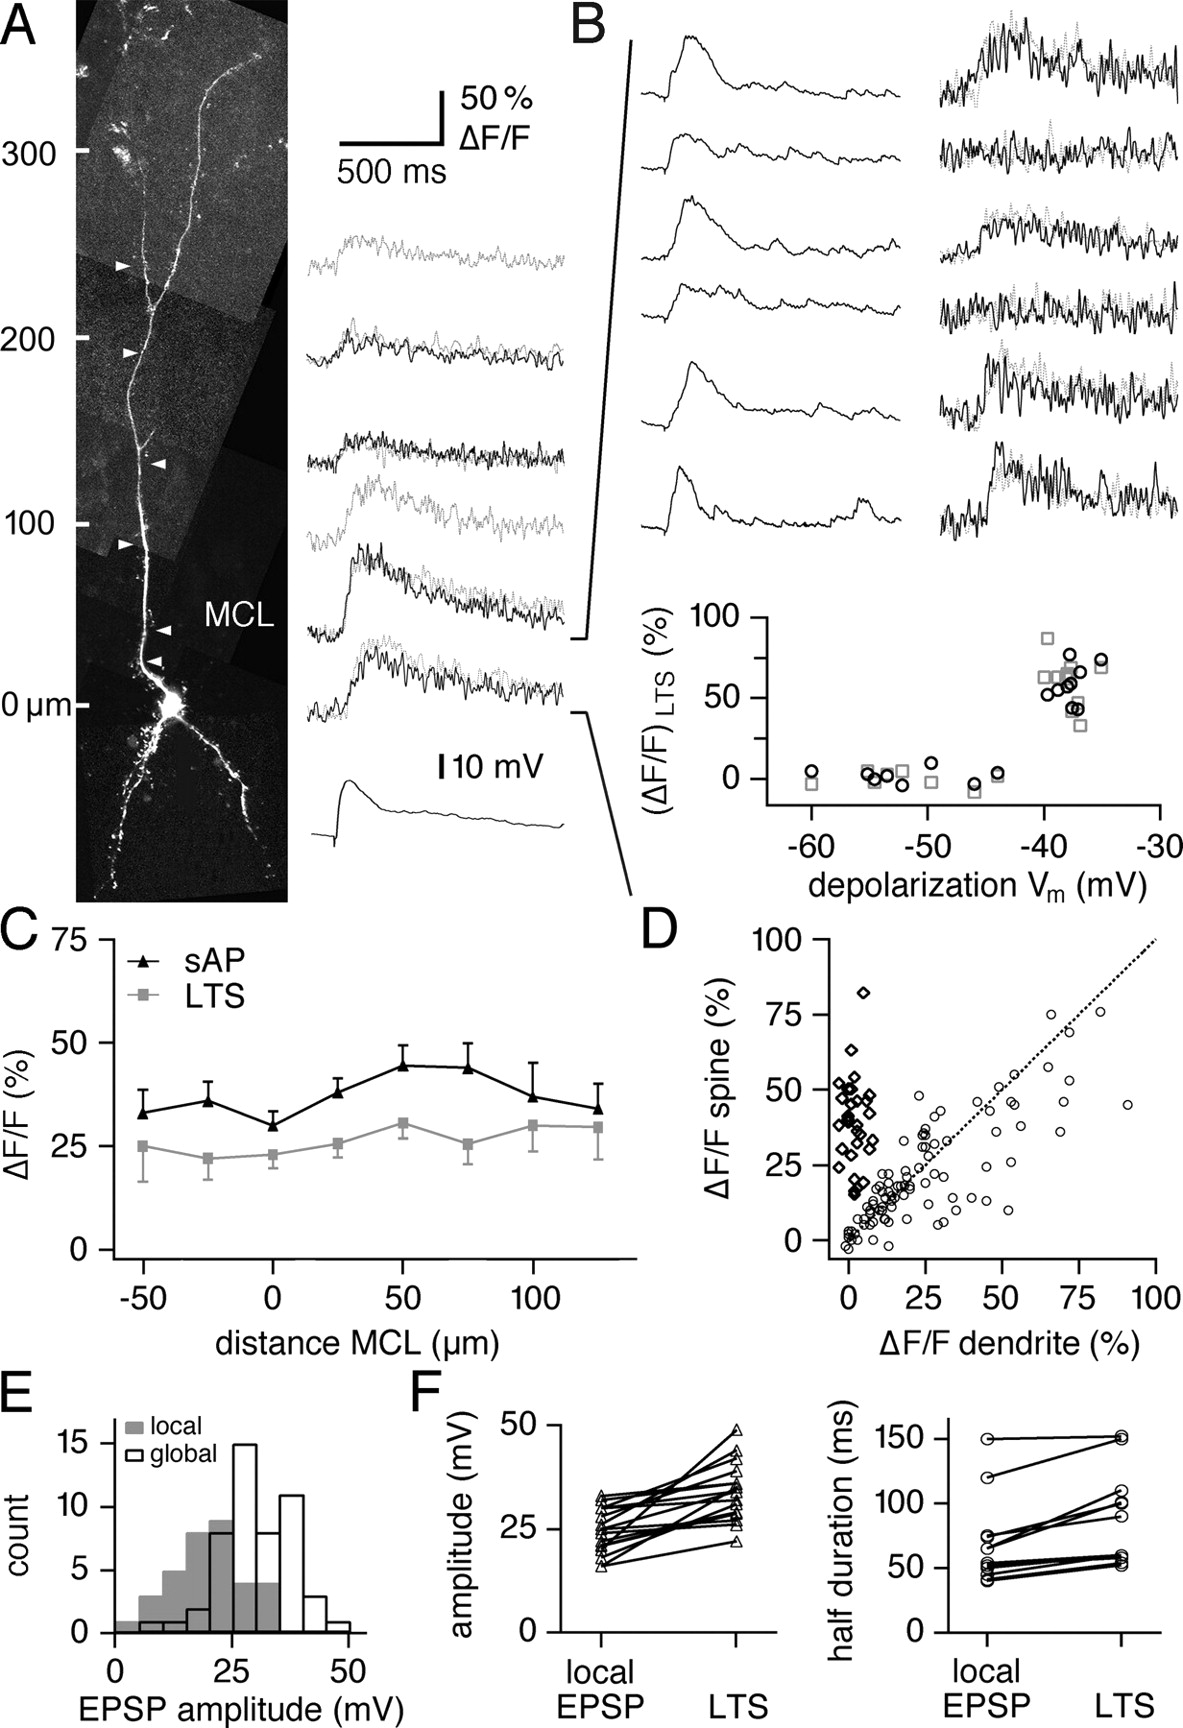
- Figure 3.
Large EPSPs evoked by glomerular stimulation cause global Ca2+ influx. A, Left, Scan of an individual granule cell with locations of line scans (white arrowheads). MCL marks the position of the mitral cell layer. Right, Averaged line scans of ΔF/F transients in spines (black) and dendrites (gray) recorded at the locations marked to their left. The black trace at the bottom shows the averaged EPSP recorded at the soma. B, Consecutive individual EPSPs and corresponding line scans recorded at the most proximal location. Calibration as in A. Note the correlated fluctuations in EPSP amplitude and ΔF/F transient amplitudes. The bottom plot summarizes the amplitudes of all ΔF/F transients at this location versus the maximal depolarization obtained by the concomitant EPSPs. C, Averaged ΔF/F transients caused by LTSs (gray markers) and sAPs (black markers), binned according to the distance of the recording site to the mitral cell layer. Data are from 48 cells and 137 dendritic locations. The analogous profiles for spines do not differ significantly. D, Scatter plot of all mean response amplitudes (ΔF/F)LTS (open circles) and (ΔF/F)syn (diamonds) in spines versus the respective adjacent dendrites. E, Distribution of all mean EPSP amplitudes used in the experiments. The gray bars represent cells in which only local responses were found, and the white bars represent cells in which a global LTS signal was observed. F, Changes in mean EPSP amplitude and half-duration that accompanied stochastic fluctuations between EPSPs that were linked to global LTS calcium signals and those that were not, at constant stimulation strength (as in B). n = 12 cells, several EPSPs averaged for each condition.
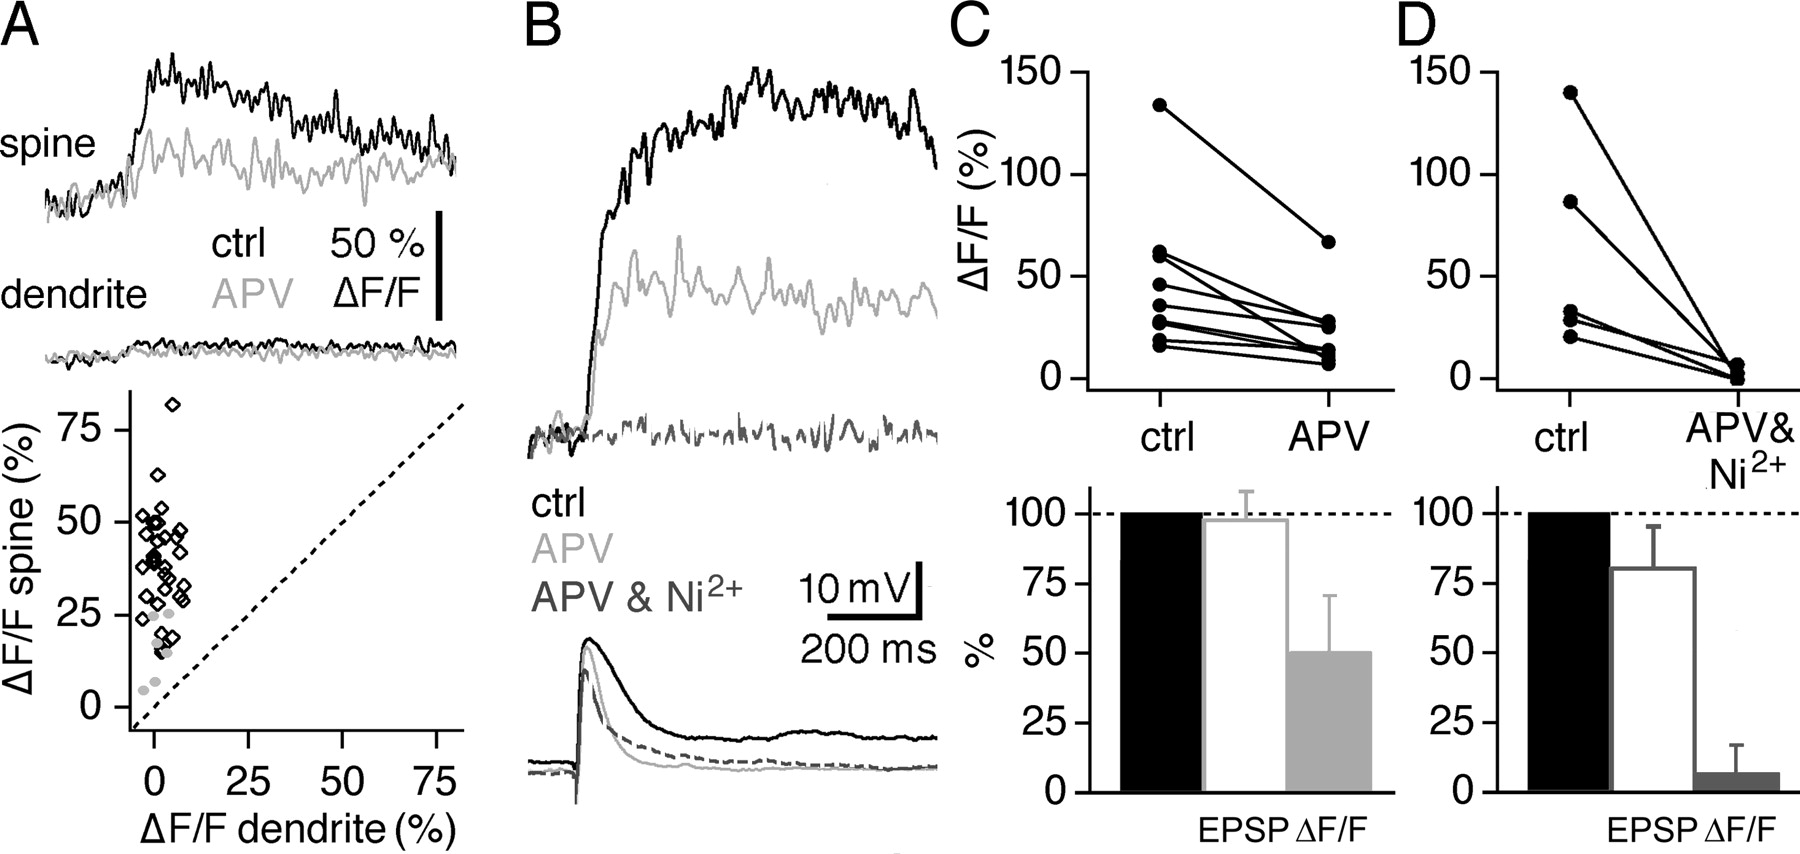
- Figure 5.
The local synaptic signal (ΔF/F)syn is governed by a variety of Ca2+ sources, including NMDA-Rs and VDCCs. A, Individual experiment in a responsive spine. Top, (ΔF/F)syn in the spine. Middle, (ΔF/F)syn in the adjacent dendrite. Black traces show averaged control responses (ctrl), and gray traces show those in 10 μm APV. Bottom, Scatter plot of local synaptic response amplitudes in spine versus dendrite. Black diamonds, Experiments under control conditions (similar to Fig. 2 E). Gray circles, Data in the presence of 10 μm APV. B, Individual experiment in responsive spine. Top, (ΔF/F)syn in the spine. Black traces show averaged control responses, gray traces show those in 10 μm APV, and black dashed traces show those in 10 μm APV and 100 μm Ni2+. The relatively large size of (ΔF/F)syn and its slow kinetics in this experiment were also observed in a few other GC spines. Bottom, Corresponding averaged EPSPs. C, Cumulative display of the effect of APV on (ΔF/F)syn (n = 9 spines), shown in absolute values (top) and as mean percentage change of control (gray bar, bottom). The effect of APV on EPSP amplitudes is also shown as mean percentage change of control (white bar, bottom). D, Display of five individual experiments showing the absolute effect of coapplied 10 μm APV and 100 μm Ni2+ on synaptic (ΔF/F)syn in spines, shown in absolute values (top) and as mean percentage change of control (gray bar, bottom). The effect of coapplied APV and Ni2+ on EPSP amplitudes is shown as mean percentage change of control (white bar, bottom).
- Figure 4.
T-type voltage-dependent Ca2+ channels mediate the global LTS signal. A, Individual experiment in a dendrite, showing the dendritic (ΔF/F)LTS. Black traces show averaged control responses (ctrl), and gray traces show averaged responses in 10 μm mibefradil (Mib). B, Cumulative display of the effect of mibefradil on (ΔF/F)LTS [n = 14 locations in dendrites (9, □) and spines (5, ○)], shown in absolute values (top) and as mean percentage change of control (gray bar, bottom). The effect of mibefradil on LTS EPSP amplitudes is shown as mean percentage change of control (white bar, bottom). C, Individual experiment in a dendrite, showing the dendritic (ΔF/F)LTS. Black traces show averaged control responses, and gray traces show averaged responses in 10 μm APV. Bottom, Corresponding averaged EPSPs. D, Cumulative display of the effect of APV on (ΔF/F)LTS [n = 8 locations in dendrites (5, □) and spines (3, ○)], again shown in absolute values and as mean percentage change of control (gray bar). The effect of APV on LTS EPSP amplitudes is shown as mean percentage change of control (white bar).
- Figure 6.
The local synaptic signal is governed by a variety of Ca2+ sources, including release from internal stores. A, Individual experiment showing the effect of 10 μm thapsigargin (Tha) on (ΔF/F)syn in a responsive spine and the corresponding averaged EPSP. B, Cumulative display of the effect of thapsigargin on (ΔF/F)syn (n = 5 spines), shown in absolute values (top) and as mean percentage change of control (ctrl) (gray bar, bottom). The effect of thapsigargin on EPSP amplitudes is shown as mean percentage change of control (white bar). C, Display of six experiments showing the effect of coapplied 10 μm thapsigargin and 10 μm APV on (ΔF/F)syn in a spine in absolute values and as mean percentage change of control (gray bar, bottom). The effect of coapplied thapsigargin and APV on EPSP amplitudes is shown as mean percentage change of control (white bar).
- Figure 7.
The voltage dependence of local synaptic transients is only in part governed by NMDA receptors. A, Individual experiment. Top, Averaged (ΔF/F)syn responses at various holding potentials. Bottom, Corresponding averaged EPSPs. Note the reduction in absolute maximal depolarization by the EPSP with hyperpolarization. B, Plot of individual (ΔF/F)syn response amplitudes recorded in the same cell as in A. C, Cumulative (ΔF/F)syn amplitude data from nine spines in seven cells. First, data from individual spines were normalized to the amplitude values (ΔF/F)syn in that spine at the resting membrane potential (-70 mV). Data from all spines were then averaged within a bin width of 10 mV.
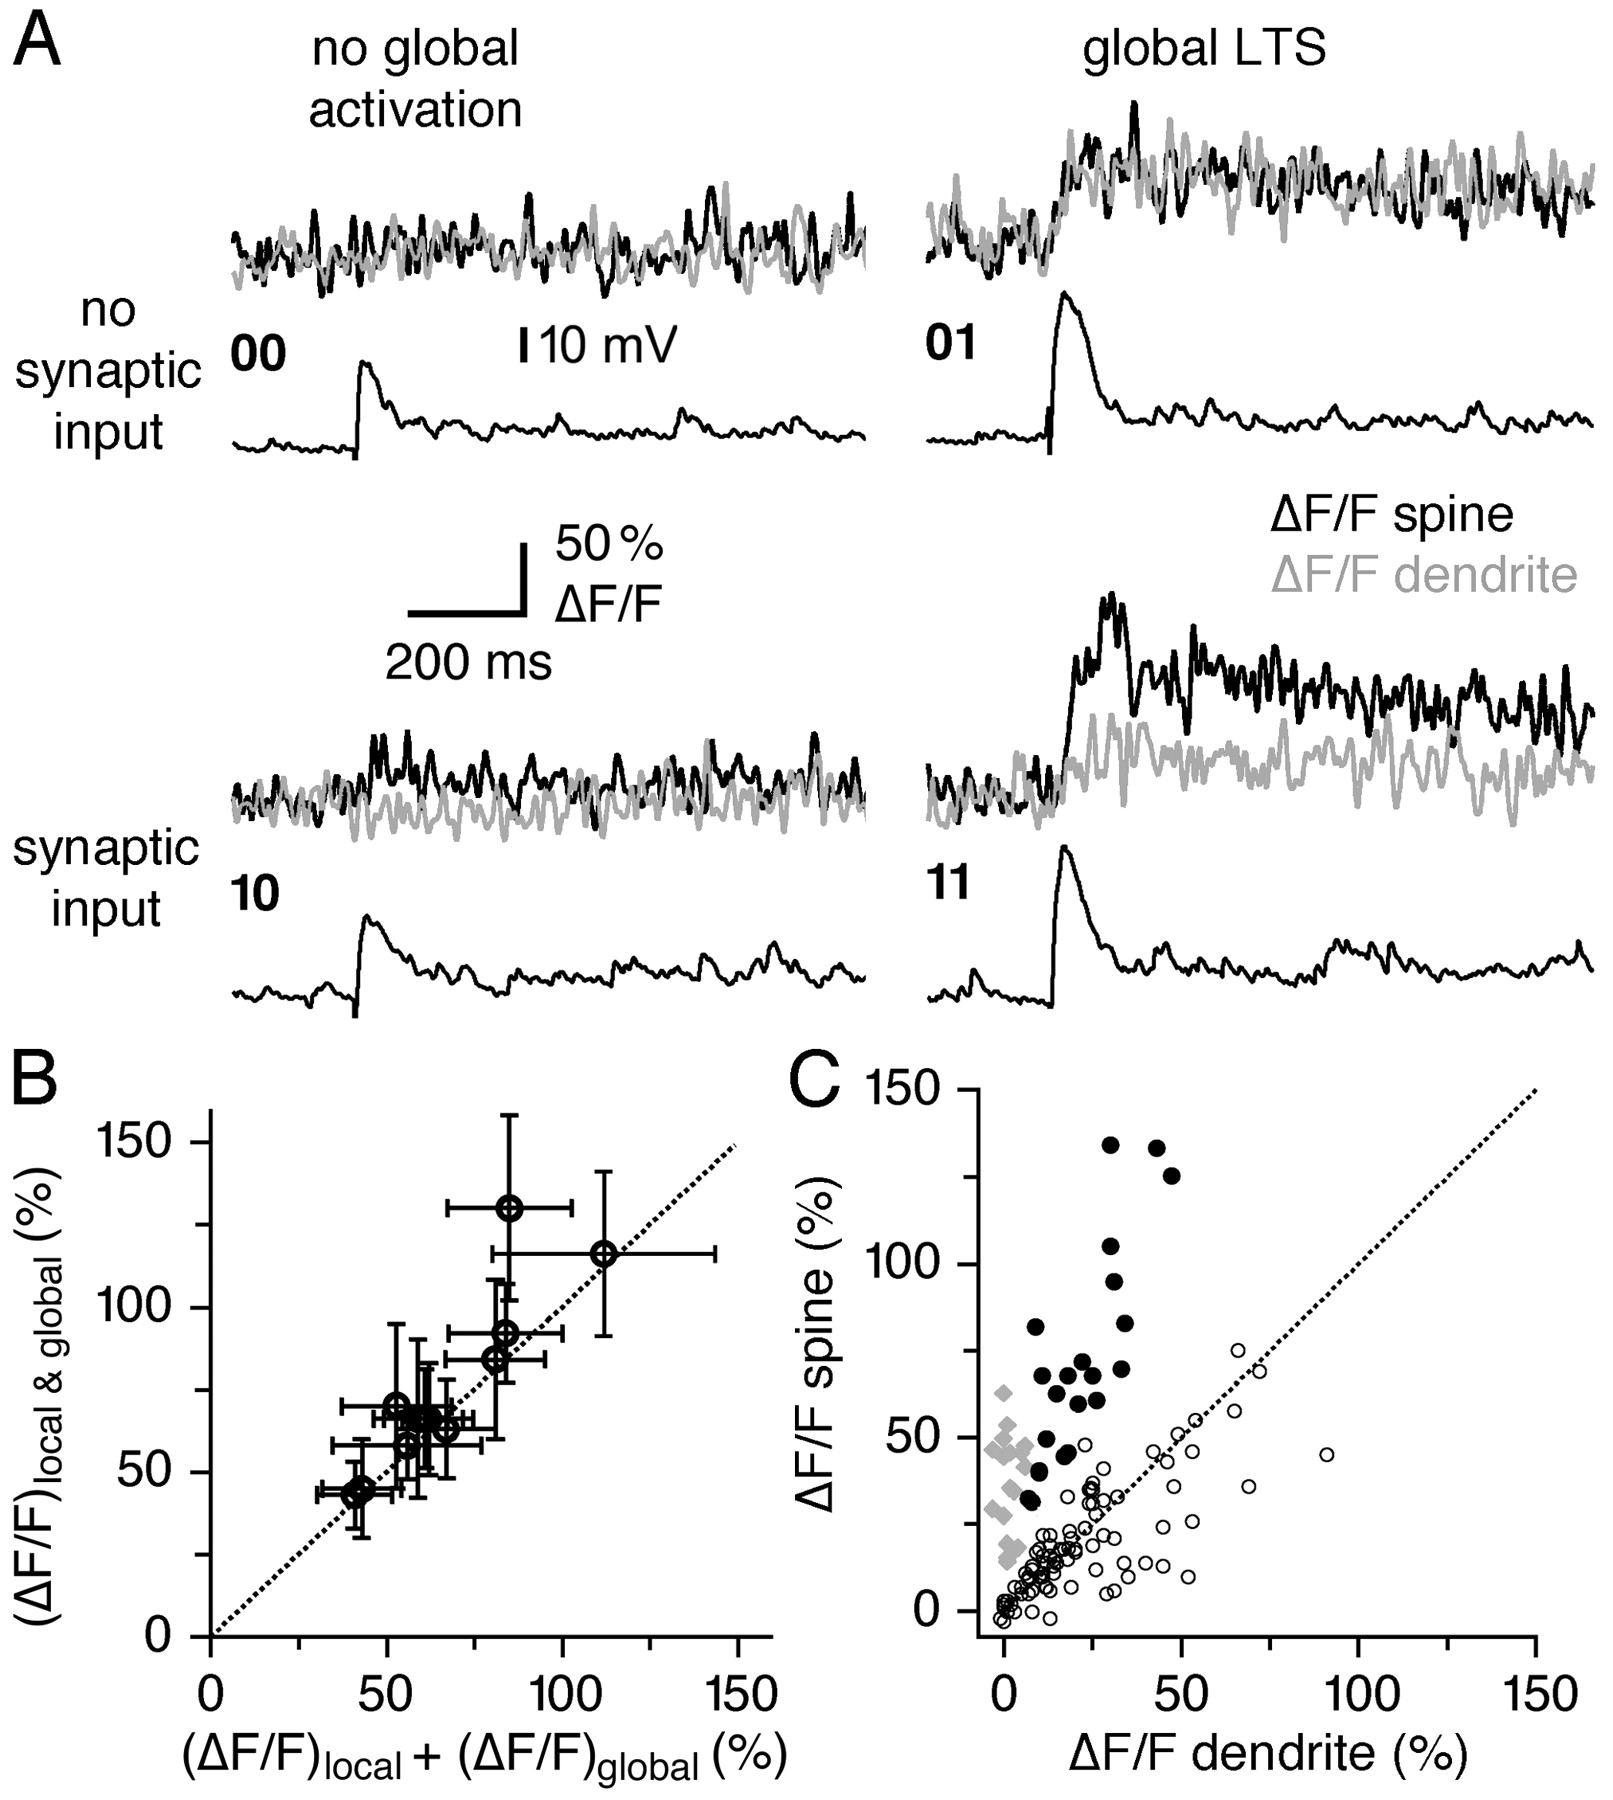
- Figure 8.
Global and local Ca2+ signals summate in individual spines. A, Response “matrix” for global and/or local activation in an individual spine. All responses shown are individual trials and were recorded at the same stimulation strength. Black bottom traces represent EPSPs recorded at the GC soma, black top traces represent ΔF/F in a spine, and gray top traces represent ΔF/F in the adjacent dendrite. 00, Neither local nor global activation. 10, Local activation of the synapse; note the localization of the transient to the spine. 01, Global EPSP/LTS signal without local synaptic activation; similar transient amplitudes in dendrites. 11, Local and global activation. Note the broader, different shape and larger amplitude of the global EPSP in its voltage traces in 01 and 11. B, Cumulative summation data from 12 spines. Scatter plot of summed averaged local and global signal amplitudes versus actual combined signal amplitude. The dashed line corresponds to linear summation. C, Averaged spine versus adjacent dendrite ΔF/F amplitudes of local synaptic activation (gray diamonds; n = 39, including the 12 summation spines), LTS activation (white circles; n = 80), and spines with combined activation (•; n = 24, including the 12 summation spines).


Additional Files
Supplemental data
Files in this Data Supplement:
- supplemental material - Supplementary Figure: Schematic view of synaptically activated Ca|*bsup*|2+|*esup*| sources in a GC spine. A Local synaptic input from M/TC dendrite. Calcium entry via both VDCCs and NMDARs might trigger CICR. B Global activation of the GC via a low-threshold spike evoked by synaptic activation of a sufficiently large set of other GC spines. Question marks indicate hypothetical events, i.e. the activation of HVA VDCCs during local synaptic input and (2) release from the GC spine during either local synaptic activation or the global low-threshold spike. Ry-R: Ryanodine receptor.


