

Article Figures & Data
Figures
- Figure 1.
Shank1B and Homer1b recruit calreticulin, calbindin, and SERCA2b to dendritic spines but not mGluRs1/5. Neurons were transfected (Trx) at 11 d in vitro (DIV) with HA-Shank1B plus Homer1b, with the HA-Shank1 (1-1440) fragment, or with an empty vector, as indicated on the left side of the panels, and the neurons were stained at 18 DIV for Shank (on the red channel; left column) together with calreticulin (on the green channel) (A2, B2, C2, D2; middle column), calbindin (E2, F2, G2; middle column), SERCA2b (H2, I2, J2; middle column), or mGluR5 (K2, L2; middle column). Merged images are shown in the right column. In Shank1B plus Homer1b-cotransfected neurons, the calreticulin and SERCA2b colocalize with Shank. Only a few spines of transfected neurons show intense staining for calbindin (F1-F3, arrow heads), although most show a moderate staining (F1-F3, arrows). Endogenous mGluR5 staining is colocalized with Shank partially (K1-K3) but is not recruited further to synapses by Shank1B and Homer1b overexpression (L1-L3). B1-B3, F1-F3, and I1-I3 are higher magnifications of A1-A3, E1-E3, and H1-H3, respectively. Scale bars: (in H3) A1-A3, E1-E3, H1-H3, 10 μm; (in J3) B1-D3, F1-G3, I1-L3, 2.8 μm. M, Quantification of the changes in synaptic staining of the indicated proteins induced by the overexpression of Shank1B plus Homer1b. At least six neurons were analyzed for each endogenous protein (30-50 synapses scored per neuron). Histograms and error bars show the means ± SD, normalized to the staining intensity in nontransfected and vector-transfected neurons; *p < 0.05.
- Figure 2.
A-D, The ER compartment is recruited to dendritic spines by Shank1B plus Homer1b transfection. Neurons were transfected (Trx) at 11 d in vitro (DIV) with ER-GFP alone or in combination with HA-Shank1B plus Homer1b, as indicated on the left side of the panels. Then they were stained at 18 DIV for Shank (A1, B1, C1, D1 on the red channel) and GFP (A2, B2, C2, D2 on the green channel). Merged images are shown in the right panels (A3, B3, C3, D3). When transfected alone, ER-GFP is localized mostly on the cell body and proximal dendrites. When transfected with Shank1B plus Homer1b, it colocalizes with Shank in large dendritic spines. Ea1-Ea3 and Eb1-Eb3 are higher magnifications of A1-A3 and C1-C3, respectively. Ec1-Ec3 show high magnification of a dendrite from aneuron triple transfected with ER-GFP plus HA-Shank1B and Homer1a. F, Quantification of changes in synaptic staining intensity of ER-GFP induced by the overexpression of Shank1B (Sh1B) plus Homer1b (Ho1b) or Shank1B plus Homer1a (Ho1a). At least six neurons were analyzed for each endogenous protein (30-50 synapses scored per neuron). Histograms and error bars show the means ± SD normalized to the staining intensity in neurons transfected with ER-GFP alone (*p < 0.05). Scale bars: (in C3) A1-A3, C1-C3, 10 μm; (in D3) B1-B3, D1-D3, 5 μm; (in Ec3) Ea1-Ec3, 1.5 μm.
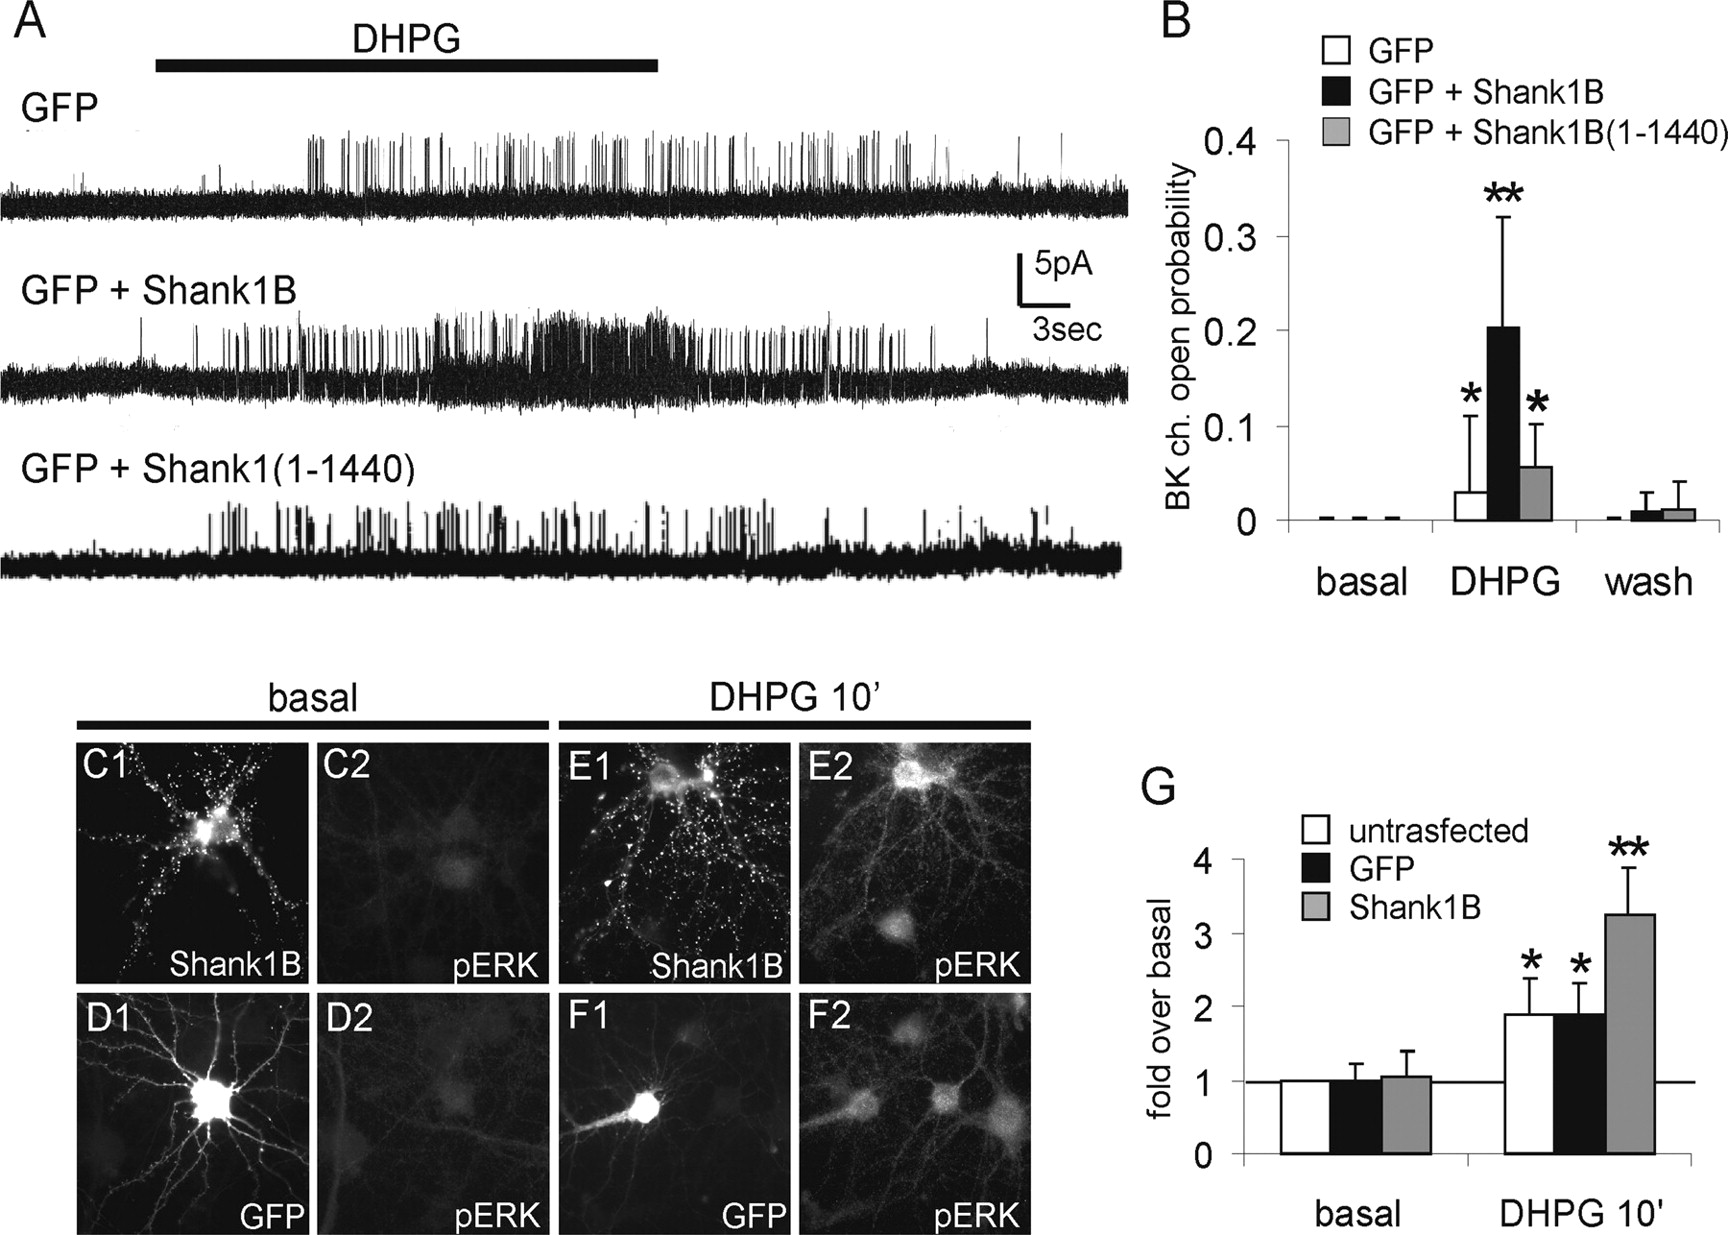
- Figure 3.
Shank1B overexpression increases BK currents, an mGluR1/5-induced Ca2+-dependent response, and ERK1/2 phosphorylation in neurons. A, BK unitary currents were recorded in cell-attached patches from GFP-transfected (top), GFP plus Shank1B-transfected (middle), and GFP plus Shank1 (1-1440)-transfected (bottom) neurons. The membrane patch was held at +20 mV. The horizontal bar represents the DHPG application (400 μm). B, Open probability of cell-attached recorded BK current obtained from GFP, GFP plus Shank1B, and GFP plus Shank1 (1-1440) cotransfected neurons before, during, and after DHPG application. Error bars and the histograms represent the means ± SEM of n = 10 neurons. C-F, Neurons were transfected at 11 d in vitro (DIV) with HA-Shank1B (C1, C2, E1, E2) or GFP (D1, D2, F1, F2) and stained at 18 DIV for HA (C1, E1) and pERK1/2 (C2, D2, E2, F2) before or after incubation for 10 min with 100 μm DHPG, as indicated at the top of each panel. G, Fluorescent intensity of pERK1/2 staining was quantified and compared in transfected versus nontransfected neurons. Histograms and error bars are the means ± SD of at least 20 neurons (*p < 0.05; **p < 0.01).


