

Article Figures & Data
Figures
- Figure 1.
Mapping inputs to L2/3 neurons with LSPS. a, Layout of the LSPS microscope. The UV laser and components involved in controlling the timing and power of the beam are shown in i. The scanning system (ii) provides spatial control. The recirculating perfusion system is shown in iii. The video image is shown in iv. e-phys, Electrophysiological. b, Barrels and septa in L4 demarcate cortical columns. One septum-related (red) and two barrel-related L2/3 pyramidal cells in the same slice were morphologically reconstructed after functional mapping by LSPS. c, Blue dots (100 μm spacing) mark the LSPS mapping pattern. d, During mapping, each UV flash stimulates APs in a small cluster of neurons (purple), some of which project synaptically to the postsynaptic neuron (red). Inset, Typical traces obtained during photostimulation mapping; the blue line indicates the timing of the UV flash, and the light red region just to the right of this is the window over which responses are averaged. Vertical calibration bar, 50 pA. e, Single-cell examples of LSPS maps of excitatory synaptic input to an L2/3 neuron in particular locations with respect to the L4 barrel/septum grid. For the septum-related neuron (left), the predominant source of excitatory input was from L5A. For the barrel-related neurons (middle and right), L4 provided most of the input, with a smaller contribution from L5A.
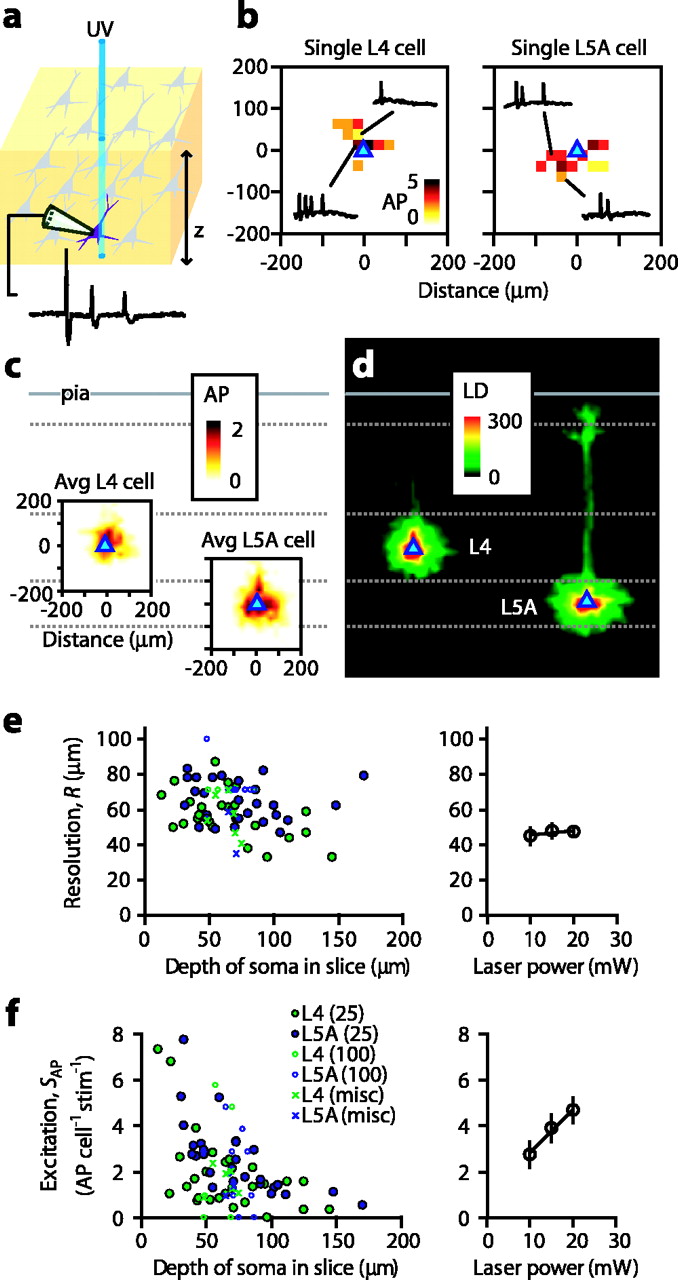
- Figure 2.
Calibration of LSPS using excitation profiles. a, Schematic of the excitation profile recording arrangement. A neuron in a presynaptic layer of the slice is recorded in loose-seal mode to detect APs generated by UV stimuli. b, Single-cell examples of excitation profiles of L4 cells (left) and L5A cells (right). Maps (25 μm spacing) were soma centered (triangles). c, Average excitation profiles of L4 and L5A cells, plotted on an approximate scale of cortical laminas. Avg, Average. d, Plots of dendritic length density (see Materials and Methods) are shown for comparison; same scale as in c. e, Resolution as a function of soma depth (left) and laser power (right). The legend in f shows cell types and spacing used for mapping; the “misc” group includes maps from experiments with varying grid parameters (64 or 256 sites; 20, 25, or 100 μm spacing). f, Neuronal excitation as a function of soma depth (left) and laser power (right). See Materials and Methods for definitions and methods relating to resolution and excitation parameters.
- Figure 3.
Average input maps for L2/3 pyramidal cells grouped by columnar and laminar location. a, L2barrel cells (n = 8). The plot below the map shows horizontal profiles (100 μm bins, mean ± SEM) of input from L4 (green line; data from region indicated by the vertical green bar to the left of the map) and L5A (blue line). Barrels and laminar boundaries are drawn as dashed lines. Plots to the right of maps show vertical profiles of home-column input (black line; data from region indicated by the horizontal black bar above the map) and (average) side-column input (red line). b, L3barrel cells (n = 9). c, L2septum cells (n = 8). The arrow in the plot points to the focus of strong input from L5A. d, L3septum cells (n = 7). e, Average synaptic input for excitatory synaptic projections defined by the presynaptic layer, postsynaptic layer, and postsynaptic column. The three strongest L4/5A→2/3 projections (asterisks) were significantly stronger compared with all other projections. The five weaker L4/5A→2/3 projections were significantly stronger compared with L5B- and L6-originating projections, with the exception of L4→3septum versus L5B→2septum. The four L5B-based projections were all significantly stronger than the four L6-based projections. f, Average qcon for the projections originating from L4 and L5A. bar, Barrel; sep, septum.
- Figure 4.
Neighboring-neuron mapping. a, Average LSPS maps of simultaneously recorded synaptic inputs to a pair of neighboring L2/3barrel neurons. The intersomatic distance was ∼100 μm. Schematics shows cell positions with respect to barrels. Both cells received strong barrel inputs and also L5A inputs. Electrophysiological traces for pixels within the dashed yellow boxes are shown in c and supplementary Figure S1 (available at www.jneurosci.org as supplemental material). The plot shows the pixel-wise comparison of the 256 pixel values of cell a versus the corresponding values for cell b. For this pair, approximately six sites gave strong input to both cells, as reflected in the high correlation coefficient (r). Some sites gave inputs only to one of the cells, yielding points that fall along the zero lines (horizontal/vertical dashed lines). The diagonal dashed line (slope = 1) represents perfect correlation. b, A pair of cells close together (∼25 μm) in the same septum-related column. The maps are globally similar but differ substantially in local detail, as reflected in the lower correlation coefficient. Inputs were predominantly from L5 and L2/3, with some L4 inputs as well. c, Traces from an individual map trial corresponding to the 48 pixels in the boxed region (dashed yellow rectangles) of the maps in a. Calibration: 100 pA, 100 ms. Asterisk, Simple postsynaptic current waveform; arrow, complex postsynaptic current waveform. d, Spatial length scales of correlation. Correlation coefficients, r, as a function of intersomatic distance, for different neighboring-neuron pair combinations of L2/3 pyramidal neurons in barrel-related (B) and septum-related (S) columns, as indicated in the legend. Same-barrel B/B pairs (black symbols) are distinguished from all other types of pairs (red symbols). Exponential curves were fit to the overlapping (common) region along the x-axis of the two data sets (e.g., 3 data points in the “all other” set were excluded), and the curves are extended as dashed lines beyond the region of overlap.
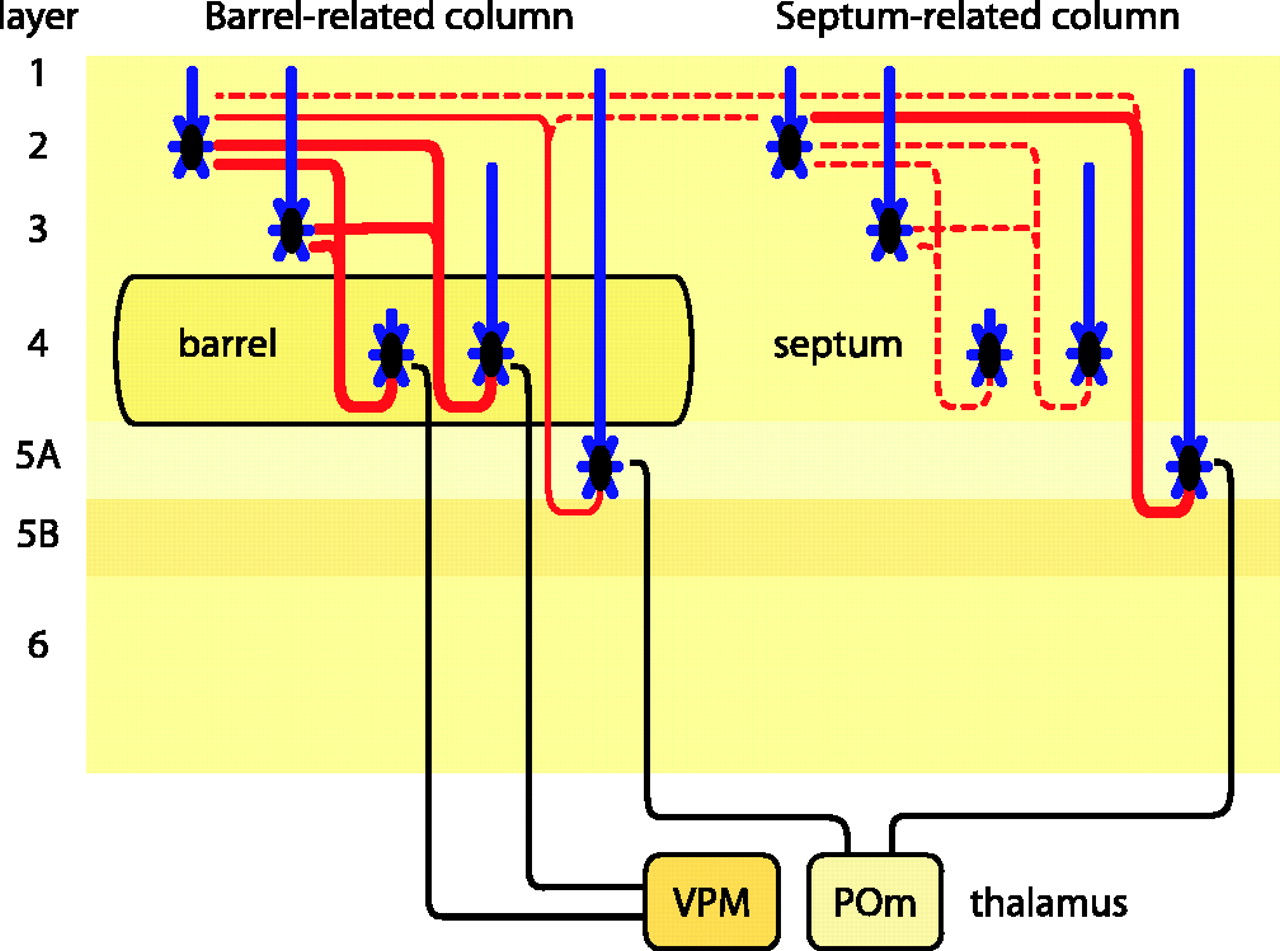
- Figure 5.
“Wiring diagram” of excitatory synaptic projections from barrel- and septum-related cells in L4 and L5A to L2/3 pyramidal neurons in the barrel cortex. Thick red lines represent the strongest projections, thin lines represent the moderately strong projections, and dashed lines represent the variable and/or weak projections. Thalamic projections to L4 and 5A are drawn as solid black lines. VPM→barrel→ L2/3barrel and POm→ L5A→ L2septum are organized as parallel interdigitating pathways.


Additional Files
Supplemental data
Files in this Data Supplement:
- supplemental material - Supplementary Figure S1. Traces recorded during LSPS mapping from two barrel-related cells simultaneously. The traces are arrayed as maps. The average maps corresponding to these traces are shown in Figure 4a. Only traces from a central 8 x 6 region of the mapping pattern are shown. This subregion contained traces from the key areas of input to these two cells that were near neighbors directly above a barrel, including input from L2/3, 4, and 5A, and the home barrel-related column and portions of the adjacent columns (as indicated lower right). To show the map-to-map variability for each cell, the three maps for each cell are shown individually (panels A�C for cell A, panels E�G for cell B) and superimposed (panel D for cell A, panel H for cell B). To show the cell-to-cellvariability for each mapping, the simultaneously acquired maps for the two cells are shown superimposed (I�K).
- supplemental material - Supplementary Figure S2. Correlation analysis of simultaneously recorded neighboring-neuron maps. Data are from 12 simultaneously recorded pairs of neurons (n = 72 maps, 2�6 maps per cell; 8 animals, ages P13-16). Top: Schematic depicting how map-to-map comparisons were made across maps from the same cell (black arrow), simultaneously (green arrow) or non-simultaneously (red arrow) recorded maps of a pair, and shuffled comparisons (blue arrow) of maps from different slices/animals. Bottom; Average correlation coefficients, r, for the different groups of comparisons. Comparisons within the same cell (�a�) gave highest correlation (r = 0.76 � 0.02, n = 88 comparisons), providing an estimate of the upper limit of correlation. Comparisons between simultaneously recorded pairs of maps (�b�) gave an intermediate level of correlation (r = 0.42 � 0.07, n = 35 comparisons), and comparisons for all non maps for the simultaneously recorded pairs of neurons (�c�) gave an almost identical value (r = 0.43 � 0.07, n = 44 comparisons). A lower bound for correlation was determined by shuffling maps (�d�); each map was compared to all other maps that were not from the same mapping session (i.e., that were from cells in different slices or different regions of the same slice). (�d� in Fig. 5a). The average value was 0.22 � 0.01 (n = 1177 comparisons), significantly below the pair-recorded values. Comparison of maps from different slices/animals provided an estimate of the lower limit of correlation; i.e., how much of the observed correlation was due to generic features of brain slice circuitry.


