

Article Figures & Data
Figures
- Figure 1.
VGLUT1 loading in synaptic vesicles depends on glutamate concentration and the number of available transporters. A, Uptake time course of 50 μm 3H-glutamate by purified synaptic vesicles (•) reaches equilibrium in ∼10 min. CON, Control. Uptake in the presence of either the competitive VGLUT1 inhibitor trypan blue (□) or the noncompetitive VGLUT1 inhibitor Rose Bengal (○) both fill along a similar time course but to smaller equilibrium amounts. B, Uptake time course for 1 mm 3H-glutamate by synaptic vesicles (•) occurs along a similar time course as in A but to a dramatically increased final equilibrium amount. Equilibrium is again reduced in the presence of either trypan blue (□) or Rose Bengal (○). C, Saturation isotherm of 3H-glutamate (0.06-6 mm) accumulation at 10 min in the presence and absence of Rose Bengal (○) or trypan blue (□). In the presence of >1 mm glutamate, the competitive trypan blue inhibition is lost while the noncompetitive Rose Bengal inhibition is maintained. D, Time courses of 3H-glutamate (Glu) uptake at four subsaturating concentrations of glutamate show that steady-state vesicular glutamate levels depend on the concentration of glutamate present in the medium.
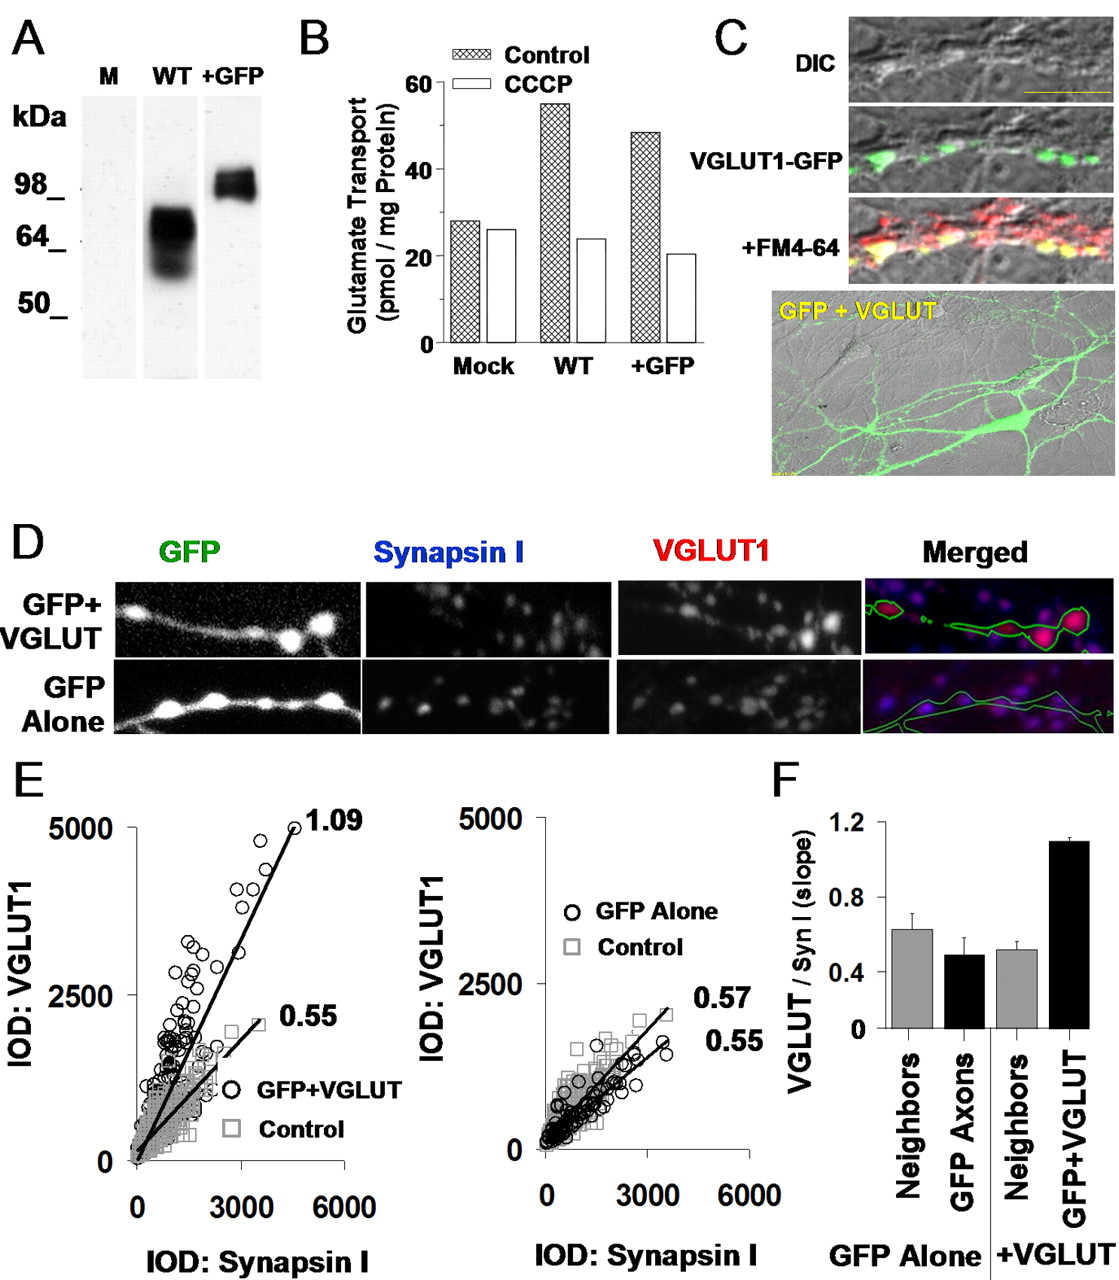
- Figure 2.
Overexpression of VGLUT1 in PC12 cells and hippocampal synapses. A, Expression of both wild-type VGLUT1 (WT) and GFP-tagged VGLUT1 (+GFP) constructs in PC12 cells reveals single immunoreactive bands of appropriate size for wild-type and EGFP-tagged proteins as visualized by Western blotanalysis. Mock-transfected cells (M) did not contain immunoreactivity. B, Both constructs succeeded in facilitating CCCP-sensitive glutamate loading into PC12 cells, whereas mock transfection (Mock) did not. C, Top, Overexpressed VGLUT1-GFP fusion protein localized to synaptic terminals (top) as shown by colocalization of the fusion protein (green) with FM4-64 (red). Scale bar, 10 μm. Bottom, Wild-type VGLUT1 cotransfected with GFP clearly labels the morphology of transfected neurons. DIC, Differential interference contrast. D, Double-immunostaining for synapsin I and VGLUT1 along GFP-labeled hippocampal axons. VGLUT1 intensity was higher in axons expressing GFP plus VGLUT (top images) than in axons expressing GFP alone (bottom images). E, Ratio of VGLUT1 IOD to synapsin I IOD at individual synapses. Ratios were higher along axons transfected with GFP plus VGLUT (left; 278 transfected synapses, 576 control synapses) than axons transfected with GFP alone or adjacent nontransfected synapses from the same area (right; 92 transfected synapses, 422 control synapses). F, Summary data across multiple cover slips (total, n = 8) for data in E. GFP plus VGLUT1 cotransfection results in augmented VGLUT1 protein levels per synapse.
- Figure 3.
Enhanced excitatory synaptic transmission via VGLUT1 overexpression. A, Experimental paradigm: dual whole-cell patch clamp is achieved between a VGLUT1-overexpressing VGLUT+ neuron cotransfected with GFP (green) and a nontransfected control neuron (clear). An action potential is evoked in one neuron of the pair under current clamp at 0.3 Hz, and the resulting EPSC is recorded in the other neuron under voltage clamp. Calibration: 50 pA, 50 ms. B, EPSC responses evoked in a reciprocally connected pair of VGLUT+ and control neurons. Average EPSCs (left traces) contrast the responses evoked from each type of presynaptic neuron. Calibration: 10 pA, 20 ms. Normalizing these traces to the same peak amplitude (right traces) reveals a similar time course. C, Distribution of EPSC amplitudes observed in the reciprocal pair shown in B. Events from a VGLUT+ presynaptic neuron tend to comprise a right-shifted distribution that differs in shape from its control counterpart. D, Summary data for the effect of presynaptic VGLUT1 overexpression on EPSC amplitude: mean amplitude measured across multiple pairs is significantly higher for VGLUT+ (*p < 0.05; unpaired t test; n = 7 control; n = 7 VGLUT+). E, Summary data for the effect of overexpression on failure rate of evoked transmission; probability of receiving a postsynaptic response to presynaptic stimulation is increased by VGLUT1 overexpression (*p = 0.03; unpaired t test).
- Figure 4.
Effects of VGLUT1 overexpression on quantal excitatory transmission. A, mEPSCs were recorded postsynaptically via a whole-cell patch clamp in the presence of TTX in either a network completely lacking VGLUT1 overexpression (Control) or from a subregion of a transfected network visually determined to be dense in overexpressing neurons (VGLUT+). B, Distributions of mEPSC amplitudes observed in the neurons shown in A. VGLUT+ events tend to be right-shifted relative to the control event distribution. C, Sample mEPSCs from cells recorded in control and VGLUT+, which in this case are an average of 48% larger in the VGLUT+ recording. Calibration: 25 pA, 150 ms. D, Average mEPSC amplitude for neurons recorded in each group shows an increase in VGLUT+ mean event amplitude (*p = 0.04; unpaired t test). mEPSC data are aligned with the EPSC amplitude data from Figure 3C. E, No significant difference between control and VGLUT+ neurons is observed for mEPSC frequency (shown here) or rise and decay time kinetics (data not shown). Error bars indicate SEM.
- Figure 5.
Enhanced per vesicle glutamate release via VGLUT1 overexpression. A, Sample application of the competitive glutamate antagonist γ-DGG (600 μm) while evoking EPSCs at 0.3 Hz between a pair of neurons. Dots represent an average of three EPSCs. B, Dose-response curve measuring the degree of EPSC attenuation by different concentrations of the competitive glutamate antagonist γ-DGG. C, Typical attenuation of control versus VGLUT-mediated EPSCs by 600 μm γ-DGG. Median traces from single connections, normalized by predrug amplitudes for direct comparison, are shown. Bottom traces depict the γ-DGG normalized to the height of their predrug counterpart for comparison of kinetics. D, Summary data of γ-DGG attenuation across all observed connections: VGLUT-mediated transmission is significantly less attenuated than control-mediated transmission (*p < 0.05; unpaired t test; control vs VGLUT+ bars). Summary data for γ-DGG attenuation acquired under intentionally reduced probability of release conditions are also shown (Control, Low Pr vs VGLUT+, Low Pr bars; see Results). Here, VGLUT-mediated transmission is again significantly less attenuated than control-mediated transmission (*p < 0.05; unpaired t test). Average failure rates used during each condition are depicted in F. E, Examples of tuning the failure rate of synaptic transmission by varying divalent cation concentrations for low Pr experimental conditions. The ratio of calcium/magnesium concentrations is varied while failure rate is measured until failure rate is sufficiently high to ensure a significant number of single vesicle events. The marker (X) denotes the condition in which γ-DGG attenuation data were acquired. F, Average failure rates used during normal Pr and low Pr experiments summarized in D. Failure rates were intentionally increased during the low Pr experiments for both control (*p < 0.05; unpaired t test) and VGLUT+ (**p < 0.01; unpaired t test) conditions.
- Figure 6.
VGLUT1 expression is developmentally regulated and coincides with a developmental change in quantal amplitude. A, Immunolabeling of VGLUT1 and the synaptic marker synaptotagmin Ia across development. B, Average proportion, at various developmental stages, of synaptotagmin-labeled puncta that exhibit detectable levels of VGLUT1 protein. Average proportion of VGLUT synapses increases significantly from 6 to 9 DIV (***p < 0.001; unpaired t test) and from 9 to 20 DIV (**p < 0.01). C, Average IOD for synapses already expressing detectable levels of VGLUT1. The ratio of VGLUT1 IOD to synapsin I IOD per synapse increases significantly across development from 6 to 9 DIV (**p < 0.01; unpaired t test) and from 9 to 20 DIV. D, Miniature excitatory currents (mEPSCs) recorded at different stages of development. Calibration: 15 pA, 150 ms. Bottom traces represent an average of a population of events acquired from a single cell at each developmental stage. Calibration: 5 pA, 25 ms. E, Mean mEPSC amplitude (n = 8, 8, and 6 cells at 8, 10, and 15 DIV, respectively) increases significantly during development (*p < 0.05; unpaired t test). F, Mean mEPSC frequency also increases significantly between 10 and 15 DIV (*p < 0.05).
- Figure 7.
VGLUT1 expression is coordinated with the onset of functional vesicle cycling. A, Triple immunostaining for VGLUT1, the functional bouton marker AM1-43, and the vesicle protein synapsin I. B, IOD per synapse for synapsin I, an additional vesicle protein, remains relatively stable through development. C, D, Synaptic IOD for VGLUT1 and AM1-43 appears to undergo a developmental change. E, Mean synaptic integrated optical density per image. Comparing VGLUT1 and AM1-43 intensity levels (with each normalized to synapsin I levels in the same synapse) demonstrates a significant and coordinated increase in VGLUT1 and AM1-43 staining across development. (***p < 0.001; **p < 0.01; *p < 0.05; unpaired t tests). Syn I, Synapsin I.
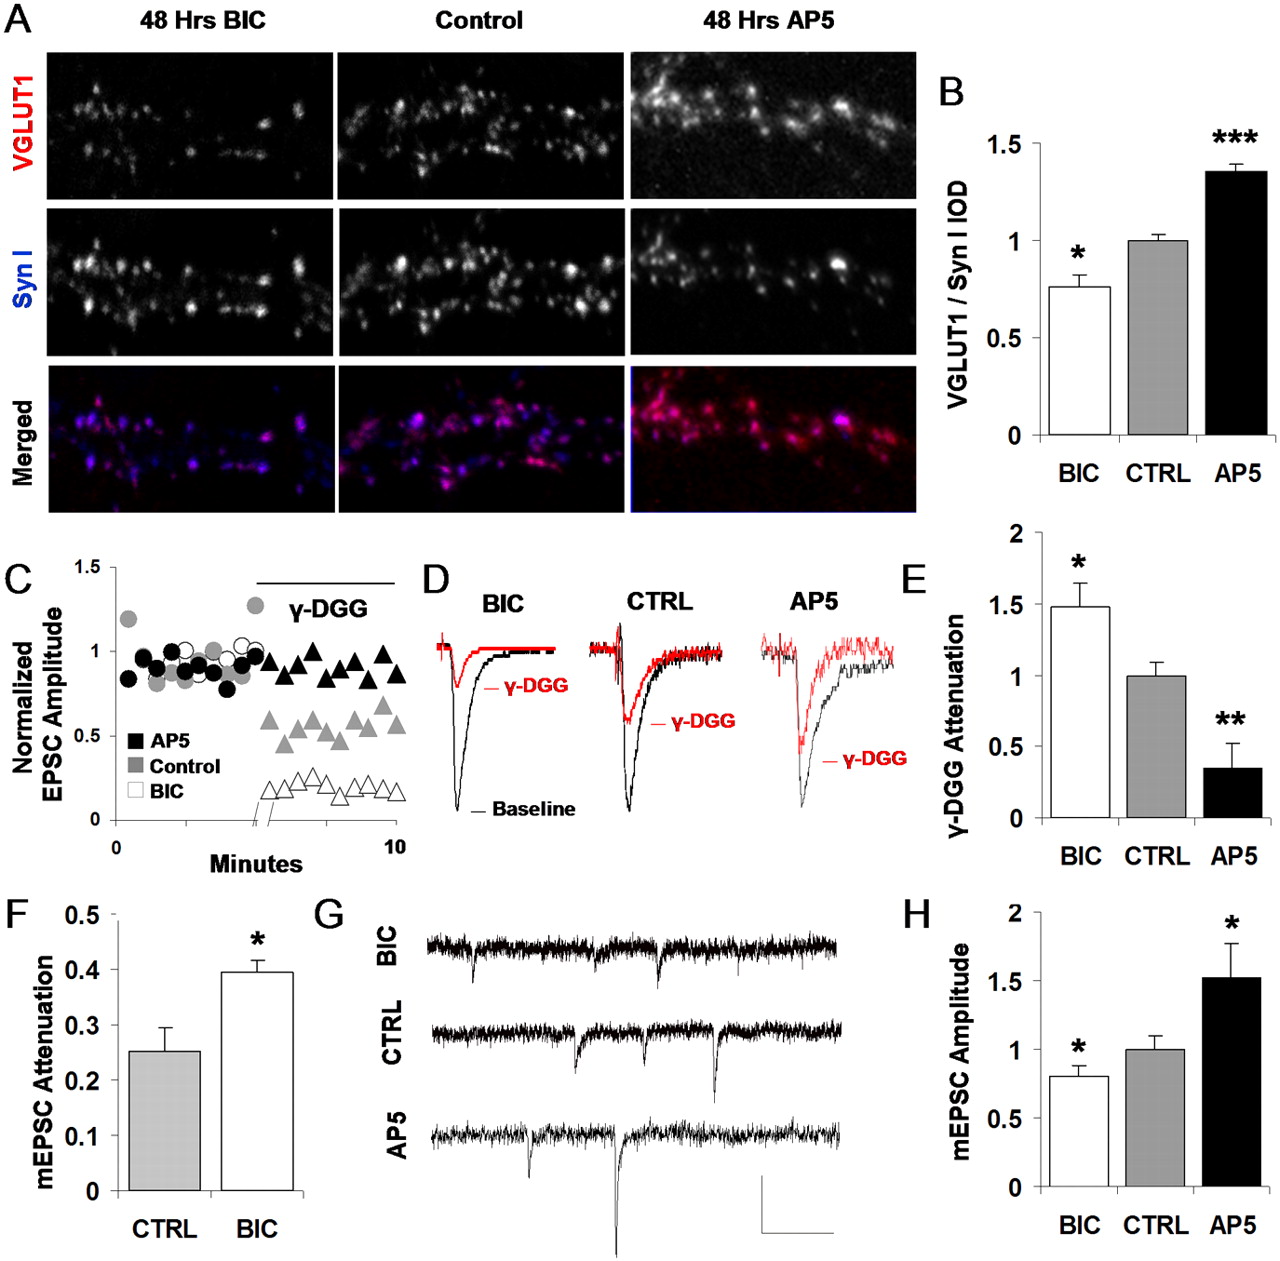
- Figure 8.
Activity-dependent plasticity of VGLUT1 expression and glutamate release. A, Double immunostaining for VGLUT1 and the vesicle protein synapsin I after 48 h of incubation with either BIC to block GABAA receptors and increase neuronal activity or AP-5 to block NMDA receptors and decrease neuronal calcium flux. B, Mean VGLUT1 expression (VGLUT1 IOD normalized by synapsin I IOD at the same synapse) was reduced following chronic GABAA receptor blockade (*p = 0.02; unpaired t test; values scaled to control) and enhanced by chronic NMDA receptor blockade (***p < 0.001; unpaired t test; values scaled to control). C, Comparison of EPSC amplitude attenuation by 600 μm γ-DGG in control, BIC, and AP-5-treated cultures. Each data point represents an average of three adjacent sampled EPSCs (0.2 Hz). Representative pre-DGG and post-DGG baselines, normalized to their respective predrug levels for comparison, are shown. D, Typical attenuation of control, BIC, and AP-5-treated EPSCs by 600 μm γ-DGG in the paired connection exhibiting median attenuation for the group. Traces are EPSCs averaged from multiple samples of a single connection, normalized by predrug amplitudes for direct comparison. E, Summary data of γ-DGG attenuation across multiple connections: BIC-treated transmission is significantly more at tenuated than nontreated control transmission (*p < 0.05; unpaired t test; values scaled to control). AP-5-treated transmission is significantly less attenuated than nontreated control transmission (p < 0.01; unpaired t test; values scaled to control). F, γ-DGG attenuation measured in mEPSCs as an additional control. BIC-treated transmission is significantly more attenuated by γ-DGG application than nontreated control mEPSCs (*p < 0.05; unpaired t test), indicating that observed changes in glutamate release correspond to differences in per vesicle glutamate release. G, Sample mEPSCs from bicuculline-treated, control, or AP-5-treated cultures. Calibration: 15 pA, 150 ms.H, Mean mEPSC amplitude is significantly reduced in BIC-treated cultures compared with nontreated control cultures and is significantly elevated in AP-5-treated cultures (*p < 0.05; unpaired t test). CTRL, Control; Syn I, synapsin I.


Additional Files
Supplemental data
Files in this Data Supplement:


