

Abstract
The response of neurons in the primary visual cortex to an optimally oriented grating is usually suppressed quite dramatically when a second grating of, for example, orthogonal orientation is superimposed. Such “cross-orientation suppression” has been implicated in the generation of cortical orientation selectivity and local response normalization. Until recently, little experimental evidence was available concerning the neurophysiological substrate of this phenomenon, although an involvement of intracortical inhibition was commonly assumed. However, Freeman et al. (2002) proposed that cortical cross-orientation suppression is caused by suppression in the thalamus and depression at geniculocortical synapses. Here, we examine a dichoptic form of cross-orientation suppression, termed interocular suppression and thought to be involved in binocular rivalry (Sengpiel et al., 1995a). We show that its dependency on the drift rate of the suppressing stimulus is consistent with a cortical origin; unlike monocular cross-orientation suppression, it cannot be evoked by very fast-moving stimuli. Moreover, we find that previous adaptation to the orthogonal stimulus essentially eliminates interocular suppression. Because adaptation is a cortical phenomenon, this result also argues in favor of a cortical locus of suppression, again unlike monocular cross-orientation suppression, which is not affected by adaptation to the suppressor (Freeman et al., 2002). Finally, interocular suppression is greatly reduced in the presence of the GABA antagonist bicuculline. Together, our study demonstrates that interocular suppression is substantially different from monocular cross-orientation suppression and is mediated by inhibitory circuitry within the visual cortex.
Introduction
The nature and functional role of so-called “cross-orientation inhibition” (Morrone et al., 1982) in the visual cortex have been debated since the phenomenon was first discovered. Although the initial studies suggested that the responses of primary visual cortex (V1) neurons to an optimal stimulus are suppressed selectively by masking stimuli of orthogonal orientation, a consensus has emerged that a wide range of orientations can cause suppression, both within and outside the classical receptive field, with surround suppression in fact being strongest at the optimal orientation of the cell (Bonds, 1989; Nelson, 1991; DeAngelis et al., 1992; Li and Li, 1994; Sengpiel et al., 1997).
Cross-orientation inhibition (or suppression) is typically demonstrated by stimulating a neuron with a grating of optimal orientation plus a masking grating of the orthogonal orientation either superimposed in the same eye (Morrone et al., 1982; Bonds, 1989; DeAngelis et al., 1992; Sengpiel et al., 1998) or presented dichoptically to the other eye (Sengpiel and Blakemore, 1994; Sengpiel et al., 1995a); the latter is also known as interocular suppression. The fact that cross-orientation suppression is broadly tuned for orientation as well as spatial and temporal frequency (Bonds, 1989; DeAngelis et al., 1992; Sengpiel et al., 1995b; Allison et al., 2001) has been interpreted widely as an indication that it derives from inhibition exerted by a pool of cortical neurons with a wide range of stimulus preferences. A dense network of horizontal inhibitory connections (Kisvárday and Eysel, 1993; Kisvárday et al., 1994) appears ideally suited for this role. Indeed, pharmacological studies, in which either inhibitory inputs to the recorded neurons were blocked locally (Sillito, 1977, 1979) or neurons in nearby regions of cortex with differing orientation preferences were inactivated (Crook and Eysel, 1992; Crook et al., 1997, 1998), demonstrated a reduction in orientation selectivity, supporting the hypothesis that inhibitory interactions between neurons of different orientation preferences play an important role in the generation of cortical orientation selectivity (Sillito, 1979; Wörgötter and Koch, 1991; Somers et al., 1995; Carandini and Ringach, 1997). An alternative view interprets cross-orientation inhibition as a means of response normalization with respect to local image contrast (Heeger, 1992; Carandini and Heeger, 1994; Carandini et al., 1997).
However, intracellular measurements of cortical inhibition have yielded conflicting evidence (Berman et al., 1991; Borg-Graham et al., 1998; Anderson et al., 2000; Martinez et al., 2002), and a recent study using purely visual stimulation suggests that cross-orientation suppression may not involve cortical inhibition at all but might arise from depression at thalamocortical synapses (Freeman et al., 2002). This hypothesis seems very difficult to reconcile with the robust interocular suppression observed with dichoptic stimulation, because binocular convergence is not observed before V1. Here, we assess whether binocular cross-orientation suppression is of cortical or subcortical origin and whether interocular and monocular mechanisms of suppression may indeed be fundamentally different.
Part of this work has been published previously in abstract form (Sengpiel and Vorobyov, 2004).
Materials and Methods
Data were obtained from 10 young cats (age, 2.5-6 months) bred in a closed laboratory colony. All experiments were performed in accordance with the Policy on the Use of Animals in Neuroscience Research of the Society. They were approved by the ethical review process of Cardiff University and performed under Home Office license.
Details of animal preparation have been described previously (Sengpiel et al., 1995a). Briefly, anesthesia was induced with an intramuscular injection of ketamine (20-40 mg/kg) and xylazine (2-4 mg/kg). After tracheal cannulation, animals were artificially ventilated and anesthetized with a mixture of N2O (55-65%), O2 (35-45%), and isoflurane (2-2.5% during surgery, 1-1.5% during recording). Respiration rate and inspiratory pressure were adjusted to maintain end-tidal CO2 at 3.5-4.5%. During recording, the animal was paralyzed with a continuous intravenous infusion of gallamine triethiodide (10 mg · kg-1 · h-1) in glucose saline. Electrocardiograms and EEGs were recorded constantly to monitor the state of anesthesia. Body temperature was monitored and kept at 38°C. The pupils were dilated with atropine hydrochloride, and the lids and nictitating membranes were retracted with phenylephrine. Animals were refracted, and gas-permeable contact lenses with 3.5 mm artificial pupils were fitted to correct focus for a viewing distance of 50 cm. A trepanation was made above area 17 of one or both cortical hemispheres, and the dura was removed.
Electrophysiology and visual stimulation. Animals viewed, via front-silvered mirrors, a 21 inch monitor positioned at a distance of 50 cm on which stimuli were presented independently to the two eyes. Drifting, sinusoidally modulated gratings of high contrast (mean luminance, 38 cd/m2) were generated by a visual stimulus generator (VSG Series Three; Cambridge Research Systems, Rochester, UK). External stimulus control, data acquisition, and analysis were performed by a TDT System II using Brainware software (Tucker-Davis Technologies, Alachua, FL). In the majority of experiments, neuronal activity was recorded with glass-insulated tungsten microelectrodes (Ainsworth, Welford, UK), which were advanced into the V1 by means of a stepper-motor microdrive (EPS; Alpha Omega Engineering, Nazareth Illit, Israel). We recorded extracellularly from neurons throughout the depth of V1, in the region representing the center of the visual field; single units were discriminated by their spike shapes.
For each neuron, we first obtained monocular tuning curves for orientation/direction of movement and spatial frequency. Left- and right-eye responses to drifting gratings of 16 different directions in 22.5° steps were averaged over five trials of 1.5 s duration, and preferred orientation was determined from these curves. Spatial frequency tuning curves were obtained for both eyes with gratings of optimal orientation and 12 spatial frequencies ranging from 0.1 to 4.52 cycles/° in ½ octave steps.
Neuropharmacology. In experiments involving iontophoresis, triple-barreled borosilicate glass micropipettes (World Precision Instruments, Stevenage, UK) were used for recording and drug application. A carbon fiber electrode was placed in one barrel, and the others filled with the GABAA antagonist (-)-bicuculline methiodide (5 mm; pH 5.5; Sigma, Poole, UK). Pipettes were advanced into V1 using a hydraulic microdrive (Narishige International, London, UK). Iontophoresis was controlled by two IP-2 units in a Neurophore BH-2 system (Digitimer, Welwyn Garden City, UK). A retaining current of -5 to -10 nA was used depending on the level of barrel resistance (measured in saline and at the cortical surface; only barrels with 80-200 MΩ resistance were used). An initial ejection current of +10 nA was reduced to +3 nA to maintain a stable response to an optimally oriented grating as well as to a blank screen (see Results).
Results
Suppression at high temporal frequencies (drift rates)
If cross-orientation suppression, either monocular or binocular (interocular), derives from a pool of cortical neurons within which the recorded cell resides, then its characteristics should reflect the combined stimulus specificities of that pool of neurons. Although this appears to be the case with respect to both orientation and spatial frequency, monocular cross-orientation suppression can be elicited with gratings of very high temporal frequencies (drift rates), at which principally only lateral geniculate nucleus (LGN) cells but no cortical neurons respond (Freeman et al., 2002). Here, we use a similar stimulus paradigm to test whether or not the temporal frequency tuning of interocular cross-orientation suppression matches the excitatory population response of the cortical neurons from which it is hypothesized to derive.
Typically, suppression is assessed by its effect on the sigmoidal contrast-response function (Albrecht and Hamilton, 1982; Heeger, 1992). Monocular cross-orientation suppression has been shown to involve contrast gain control (i.e., a rightward shift of response curves against the log contrast axis) (Bonds, 1989; Sengpiel et al., 1998). However, interocular cross-orientation suppression can involve either contrast-gain control or, in a majority of cells, response-gain control (i.e., a rescaling of the contrast-response function along the response axis) (Sengpiel et al., 1998). Therefore, interocular cross-orientation suppression cannot be quantified as a change in a single parameter in a contrast-response function. Instead, we chose to measure interocular cross-orientation suppression directly at maximal contrast across a range of temporal frequencies. Cells were stimulated through the dominant eye with a grating of optimal orientation and spatial frequency at fixed contrast (50% for monocular and 100% for binocular stimulation) and drift rate (2 Hz). Interocular suppression was assessed by presenting to the other eye orthogonal mask gratings at 100% contrast and 2, 4, 8, 16, or 32 Hz drift rate. Monocular cross-orientation suppression was also assessed, by superimposing in the same eye orthogonal mask gratings at 50% contrast and 2, 4, 8, 16, or 32 Hz drift rate. Monocular tuning curves for drift rate were also obtained through each eye. We then normalized the amounts of both types of suppression and of monocular excitatory responses relative to the values obtained for a 2 Hz drift rate to carry out a quantitative comparison.
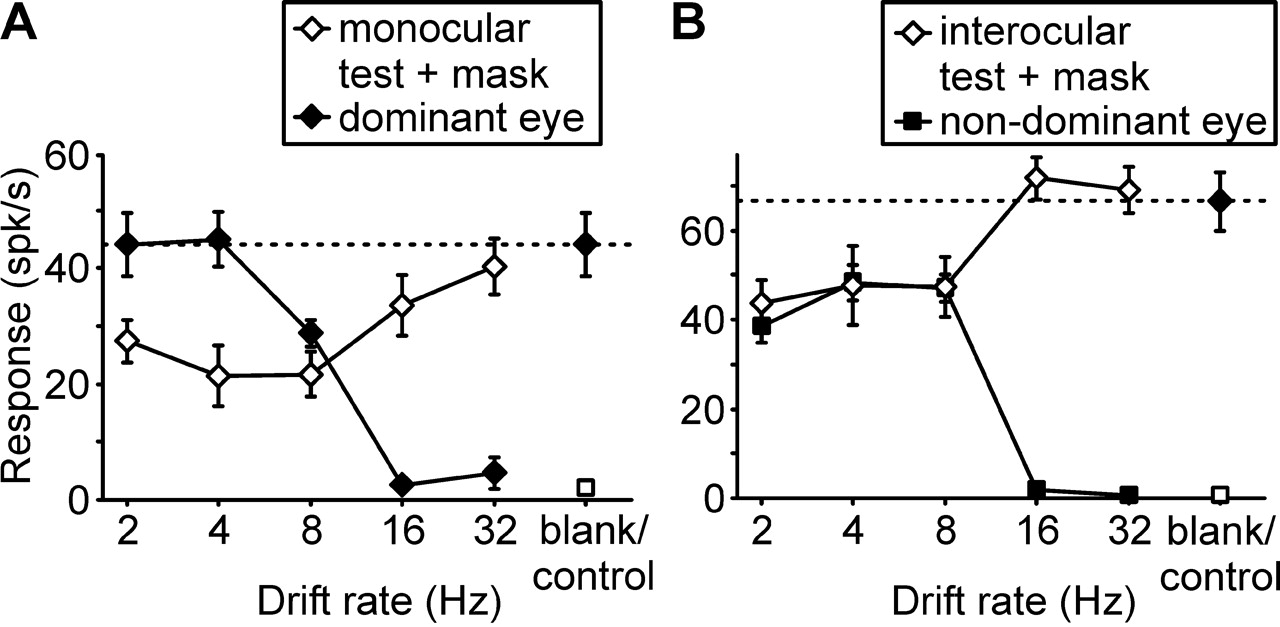
Temporal frequency tuning of monocular cross-orientation suppression was recorded in 73 neurons, interocular suppression in 74 cells. Of those, 45 neurons were tested under both suppression paradigms. Results obtained from these cells did not differ from the total population, which included cells that showed significant suppression only under one of the two stimulus paradigms and a few on which tests were completed only under one paradigm. All the cells included in this study were orientation selective, and the responses to the orthogonal-to-optimum mask grating alone (either in the dominant or the nondominant eye) were not significantly different from the response to a blank screen for any of them. Responses of a typical layer 2/3 complex cell are shown in Figure 1. Although the monocular responses to an optimally orientated test grating through both the dominant (left) and the nondominant (right) eye drop to spontaneous levels for drift rates of 16 Hz and above, strong cross-orientation suppression (24% below control response levels) is observed at a mask drift rate of 16 Hz, and even at 32 Hz, some suppression remains (9% below control response levels). In contrast, interocular suppression is strong at mask drift rates from 2 to 8 Hz (28-34% below monocular control levels) but absent at higher rates.

Drift rate dependence of cross-orientation suppression (A) and of interocular suppression (B). Responses to test and mask stimuli are shown as a function of the temporal frequency of the mask. Results are displayed for an individual layer 2/3 complex cell and represent mean ± SEM responses from eight trials. In A, responses through the dominant eye to an optimally oriented grating drifting at different rates are plotted as filled diamonds; the open square at the right gives the response to a blank screen. Responses to a pair of superimposed gratings, consisting of an optimally oriented grating drifting at 2 Hz and an orthogonal mask grating drifting at variable rate, are plotted as open diamonds. The filled diamond at the right and the dotted line indicate the control response to the optimal grating drifting at 2 Hz alone. spk, Spikes. In B, responses through the nondominant eye to an optimally oriented grating drifting at different rates are plotted as filled squares; the open square at the right gives the response to a blank screen. Responses to a pair of dichoptically presented gratings, consisting of an optimally oriented grating drifting at 2 Hz shown to the dominant eye and an orthogonal mask grating drifting at variable rate shown to the nondominant eye, are plotted as open diamonds. The filled diamond at the right and the dotted line indicate the control response through the dominant eye to the optimal grating drifting at 2 Hz alone. Note that cross-orientation suppression is observed at all drift rates up to 32 Hz, interocular suppression only up to 8 Hz.
For the population of neurons recorded, a similar picture emerged (Fig. 2). When all responses were normalized to the monocular, dominant-eye response at 2 Hz, significant cross-orientation suppression (p < 0.01) was observed at all drift rates up to 32 Hz (where it amounted to 8.9% of monocular control responses), with maximal suppression (44.6%) at 8 Hz. In contrast, interocular suppression peaked at 4 Hz (28.6%), was not quite significant at 16 Hz (p > 0.05), and was absent at 32 Hz (t tests with Bonferroni adjustment for multiple comparisons). Inspection of the drift rate tuning curves (Fig. 2) reveals that the population tuning of interocular suppression is well matched to the tuning of cortical excitatory responses through either eye (with interocular suppression being perhaps slightly stronger than expected at 8 Hz), whereas monocular suppression extends to a much higher temporal frequency range.
To further assess the relationship between suppression and excitation for each individual cell, we plotted the normalized response, averaged for 16 and 32 Hz drift rates, for all cells in the two suppression paradigms against their relative excitatory response at the same drift rates (Fig. 3). The vast majority of cells showed very little interocular suppression at high temporal frequencies (i.e., normalized responses scattered around 1.0) but did show monocular cross-orientation suppression (i.e., the majority of responses fell below 1.0). The difference between the two distributions was highly significant (p < 0.0001; Mann-Whitney U test). Interestingly, we did not find a significant correlation between the amount of high-frequency suppression and the high-frequency excitatory response either for monocular or for interocular suppression (p = 0.12 and p = 0.62, respectively), indicating that the pool of neurons exerting the suppressive influence does not necessarily share the temporal-frequency tuning properties of the cell being suppressed. In addition, we found that there is a weak positive correlation between the strength of interocular suppression and the degree of binocularity, calculated as the ratio of nondominant versus dominant eye monocular responses to the optimal grating (r = 0.24; p < 0.05), suggesting that neurons that receive relatively strong excitatory inputs from the nondominant eye also receive strong inhibitory inputs from that eye.

Drift rate dependence of cross-orientation suppression (A) and of interocular suppression (B). Mean ± SEM results are presented for populations of 73 neurons (A) and 74 cells (B), respectively. All responses are normalized to the response through the dominant eye to an optimally oriented grating moving at 2 Hz; this control response (1.0) is indicated by the dotted line in both parts. In A, responses through the dominant eye to an optimally oriented grating drifting at different rates are plotted as filled diamonds; the open square at the right gives the response to a blank screen. Suppression caused by an orthogonal grating drifting at variable rate, superimposed on an optimally oriented grating drifting at 2 Hz, is plotted with open diamonds. This curve has been obtained by plotting the reduction below the monocular control response caused by the mask grating. In B, responses through the nondominant eye to an optimally oriented grating drifting at different rates are plotted as filled squares; the open square at the right gives the response to a blank screen. Suppression caused by an orthogonal grating drifting at variable rate shown to the nondominant eye, whereas an optimally oriented grating drifting at 2 Hz was shown to the dominant eye, is plotted with open diamonds. This curve has been obtained by plotting the reduction below the monocular control response caused by the dichoptic mask grating. Note that cross-orientation suppression peaks at 8 Hz and is significant at all drift rates up to and including 32 Hz, whereas interocular suppression peaks at 4 Hz and is not significant above 8 Hz.
For the 45 cells tested under both suppression paradigms, the magnitudes of monocular and interocular suppression were completely uncorrelated (r = -0.12; p = 0.44). This finding adds weight to the hypothesis that the two phenomena may have different substrates.
Suppression after adaptation to the suppressing stimulus (mask)
The results from the first experiment indicate that interocular suppression derives from a pool of cortical neurons, either locally or in the form of feedback projections from higher areas. To further validate this hypothesis, we assessed the strength of suppression before and after adaptation to the suppressor. If interocular suppression were based on thalamic suppression or depression of the geniculocortical input, as has been suggested for monocular cross-orientation suppression (Freeman et al., 2002), adaptation to the suppressor should not affect the strength of suppression, because firing rates in the LGN are only slightly reduced after prolonged stimulation (Shou et al., 1996; Sanchez-Vives et al., 2000). If, on the other hand, it were a cortical phenomenon, suppression should be reduced after adaptation in parallel with the decrease in responses of the cells exerting the presumed suppressive influence.
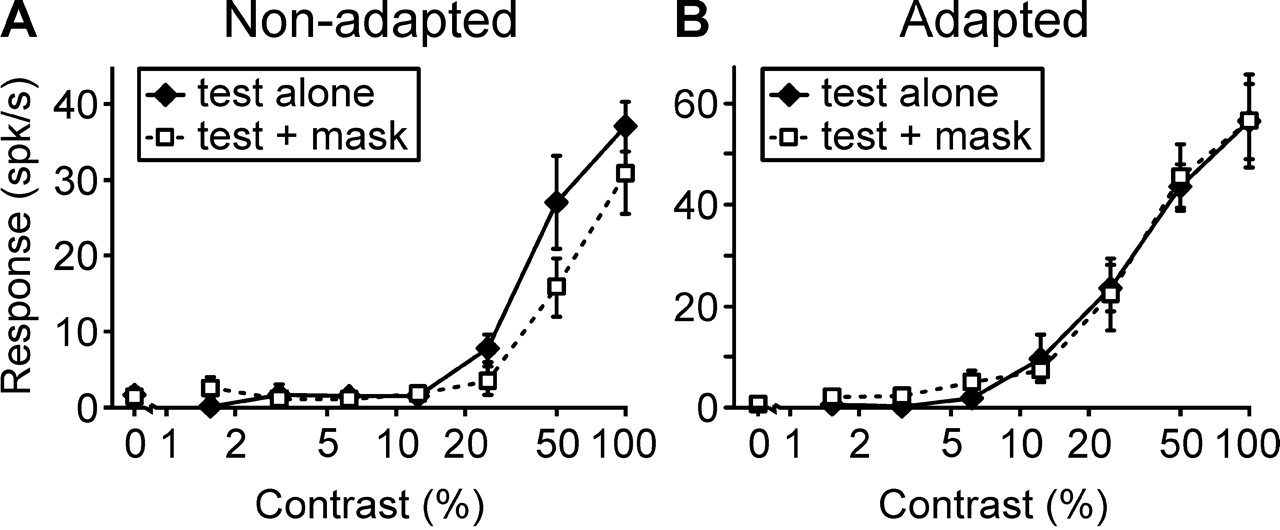
Contrast-response functions for an optimal grating presented to the dominant eye were recorded from 27 neurons in the presence and absence, respectively, of an orthogonal suppressing grating in the nondominant eye. Each cell was then adapted to the suppressor through the nondominant eye for 1 min, followed by 5 s epochs of top-up adaptation in between 1.5 s presentations of test stimuli. Again, dominant-eye contrast-response functions were recorded in the presence and absence of the suppressor in the other eye. Results are illustrated for a complex cell in Figure 4. At contrasts >12%, responses of this neuron were reduced in the presence of a rivaling grating by about one-third below monocular responses in the absence of adaptation. After adaptation to the rivaling grating, this interocular suppression completely disappeared. Among the 27 neurons tested, all but three displayed a reduction in the relative strength of interocular suppression after adaptation to the suppressor. A scatter plot of data from all cells is shown in Figure 5. On average, interocular suppression was 33.4 ± 2.9% (mean ± SEM) without previous adaptation and 5.6% ± 8.7% after adaptation to the masking grating. Suppression under these two conditions differed significantly (p < 0.001; paired t test), whereas responses to the test stimulus alone were not affected by previous adaptation to the mask (p > 0.05). This result demonstrates that interocular suppression was very much reduced by adaptation and that it is therefore likely to be cortical in origin.

Normalized suppression versus monocular excitatory responses. The scatter plot shows, for each cell, the normalized response in the presence of a suppressor in the same eye (filled diamonds) or in the opposite eye (open squares), averaged for drift rates of 16 and 32 Hz, against the excitatory response of the cell, averaged for the same drift rates and normalized with respect to the response at 2 Hz. On the right, histograms of the normalized responses are shown for monocular suppression (filled bars) and interocular suppression (open bars).

Interocular suppression in a complex cell before (A) and after (B) adaptation to the suppressor. Contrast response functions (mean ± SEM results from 8 trials) are shown for which the contrast of an optimally oriented grating (test) shown to the dominant eye of the cell was varied. Filled diamonds represent response functions for the test stimulus alone, whereas open squares represent response functions in the presence of an orthogonal, high-contrast (95%) suppressor (mask) in the nondominant eye. Before adaptation, the suppressor clearly reduced responses to the test stimulus at all supra-threshold contrasts (A), whereas after adaptation, the presence of the suppressor had no obvious effect on the responses to the test stimulus at any contrast (B). spk, Spikes.
Dependence of suppression on intracortical inhibition
The results from the first two experiments are compatible with the hypothesis that interocular suppression is caused by intracortical inhibition operating between neurons of substantially different orientation preferences. We tested this hypothesis by measuring interocular suppression before and after blocking intracortical inhibition with the GABAA antagonist bicuculline methiodide.
Binocular interaction functions for an optimal grating presented to the dominant eye were recorded from 28 neurons, with gratings of variable orientations shown to the nondominant eye. Typically, the response to the dominant-eye stimulus was augmented, when the dichoptically presented grating was of similar orientation, within ±20° of the optimum of the cell (Fig. 6B). Reponses were depressed below the monocular control level (measured with a blank screen shown to the non-dominant eye), when the interocular orientation difference was approximately ±30° or greater. For each cell, we determined the strength of interocular suppression as the mean of response reductions at interocular orientation differences of ±45 and ±90°. We also determined the strength of iso-orientation facilitation from the peak binocular response for orientation differences between -10 and +10°.
We then antagonized intracortical inhibition by bicuculline iontophoresis, the level of which was carefully controlled such that the level of spontaneous activity (measured in response to a blank screen) did not increase by >100% or >5 spikes/s, and orientation selectivity of responses was maintained, although orientation tuning typically widened (Sillito, 1979). In particular, nonspecific burst firing was kept to a minimum. The orientation tuning of monocular responses was reassessed at 5 min intervals. Only after response levels had stabilized, we retested binocular interactions. For the cell shown in Figure 6, in the presence of bicuculline, the previously pronounced interocular suppression (mean of 46.7% in the four conditions with ±45 and ±90° interocular orientation difference) was reduced to 8.7% of the monocular control response. In contrast, the facilitation observed with (near-) identical gratings shown to the two eyes was not substantially altered in relative terms, peaking at an orientation difference of +10° and a value of 94.4% above the monocular control response before bicuculline application and 98.3% afterward (Fig. 6C).
Among the 28 neurons tested, all but three displayed a reduction in the relative strength of interocular suppression after application of bicuculline. A scatter plot of data from all cells is shown in Figure 7. On average, interocular suppression was 46.1 ± 4.0% (mean ± SEM) before application of bicuculline and 18.1 ± 4.9% during application of bicuculline. Suppression under these two conditions differed significantly (p < 0.001; paired t test). In contrast, facilitation for near iso-oriented gratings changed very little, from 81.6 ± 14.4% (mean ± SEM) before bicuculline iontophoresis to 68.1 ± 11.9% afterward (p > 0.3; paired t test), indicating that bicuculline did not simply cause an unspecific response elevation. This result demonstrates that interocular suppression was selectively reduced by antagonizing intracortical inhibition.

Scatter plot showing relative strength of interocular suppression before (control) and after adaptation to the suppressor for the population of 27 cells tested. For all but three neurons, results fall below the dotted unity line, indicating that suppression was stronger before than after adaptation to the suppressor.
Discussion
We have shown that interocular suppression elicited by orthogonal grating pairs in V1 is characterized by (1) a dependency on the drift rate of the suppressor that closely follows the tuning of the excitatory population response, (2) a clear susceptibility to decrease after adaptation to the suppressor, and (3) a dependency on GABAergic cortical inhibition. Together, these results strongly suggest that interocular suppression is primarily a cortical phenomenon mediated by inhibitory circuitry within V1. On the other hand, we have confirmed that cross-orientation suppression with superimposed grating pairs can routinely be elicited by gratings moving too fast to cause an excitatory response when presented alone (Freeman et al., 2002). We are therefore led to conclude that interocular and monocular mechanisms of suppression may, at least in part, involve different substrates.
Our work was motivated by a study by Freeman et al. (2002), which challenged the widely held belief that suppression of the response to an optimal grating through an orthogonal mask is mediated by intracortical inhibition. Their finding of cross-orientation suppression at drift rates of the mask beyond the response limits of virtually all cortical neurons and immunity of suppression against adaptation to the suppressor is most parsimoniously explained by a subcortical origin of suppression. Neurons in the LGN commonly respond to grating drift rates in excess of 20 Hz (Saul and Humphrey, 1990; Freeman et al., 2002), whereas V1 cells rarely respond beyond 15 Hz (Movshon et al., 1978; DeAngelis et al., 1993). Moreover, adaptation causes at most a modest reduction of LGN responses (Shou et al., 1996; Sanchez-Vives et al., 2000), while significantly decreasing the responses of almost all cortical neurons (Maffei et al., 1973; Albrecht et al., 1984; Ohzawa et al., 1985). This reduction is because of a tonic hyperpolarization that is activity dependent (Carandini and Ferster, 1997; Sanchez-Vives et al., 2000).
We found that both in terms of responses at high drift rates and adaptability, interocular suppression differed markedly from monocular cross-orientation suppression. There are two possible explanations for the discrepancies: (1) both phenomena are fundamentally different, or (2) the two mechanisms share some but not all of the underlying circuitry. Some of the evidence available from this and previous studies points to the latter interpretation.
Strength of cross-orientation suppression
Monocular cross-orientation suppression is considerably stronger than dichoptic suppression. In the present study, the former amounted to 42.8% of the control response to the optimal grating alone, whereas the latter averaged only 28.6% of the dominant-eye control response (at 4 Hz) (i.e., about two-thirds of the monocular effect). Walker et al. (1998) found monocular suppression to be about three times as strong as the interocular one, and Sengpiel et al. (1998) reported contrast threshold increments by 0.42 and 0.17 log units, for cross-orientation and interocular suppression, respectively. It is therefore conceivable that interocular suppression involves exclusively cortical circuitry, whereas monocular cross-orientation suppression additionally invokes a subcortical mechanism, which becomes predominant at higher drift rates.
Effects of suppression and adaptation on contrast-response functions
There is general consensus that monocular cross-orientation suppression causes a rightward shift of neuronal contrast-response functions along the log contrast axis (i.e., in the presence of an orthogonal mask, a higher test contrast is necessary to elicit the same response) (Bonds, 1989; Sengpiel et al., 1998). This contrast-gain control may serve to normalize neuronal responses with respect to local stimulus contrast (Heeger, 1992). The same kind of rightward shift has been observed when cells are adapted to drifting gratings of increasing contrast, and contrast-response functions are determined for each adapting contrast (Ohzawa et al., 1985). By comparison, interocular suppression causes a much smaller rightward shift but instead is characterized by a downscaling of contrast-response functions or response-gain control by about one-quarter (Sengpiel et al., 1998). It is possible that interocular suppression engages two different mechanisms, one of which is susceptible to adaptation and is therefore occluded by it, as we have shown.
Functional characteristics of inhibitory cortical inputs
Our results using purely visual stimulation indicate that interocular suppression is primarily a cortical phenomenon, and the neuropharmacological experiment clearly demonstrates the involvement of GABAergic inhibition. The level of GABA blockade was titrated carefully such that close-to-normal neuronal selectivity was maintained and nonspecific elevation of neuronal activity was avoided. This was evidenced by the fact that the ratio of responses to matched binocular stimulation versus monocular control did not change significantly. Rather, antagonizing local GABAergic inputs caused a selective loss of interocular suppression. This finding is compatible with a model describing binocular interactions as the sum of iso-orientation facilitation and interocular suppression that operates across all combinations of orientations but is overtly visible only for near-orthogonal orientations (Sengpiel et al., 1995b; Sengpiel and Blakemore, 1996). It is supported by a number of pharmacological studies that have all demonstrated the presence of inhibitory inputs tuned to cross-orientations (Sillito, 1975, 1979; Crook and Eysel, 1992; Crook et al., 1997, 1998).

Orientation tuning (A) and binocular interaction tuning (B, C) for a layer 2/3 complex cell before and after intracortical inhibition was antagonized by bicuculline iontophoresis. Orientation tuning (A) was assessed with monocular stimulation; only the dominant-eye response is shown. Filled diamonds show responses before application of bicuculline (control); open squares show those obtained during bicuculline iontophoresis (+bicuculline). Responses to a blank screen are given by the symbols on the far right, marked blank. For the binocular interaction tuning (mean ± SEM responses; 8 trials), the dominant eye was stimulated with an optimally oriented grating, whereas gratings of various orientations, differing from the dominant-eye stimulus by the amount plotted on the abscissa, were presented to the nondominant eye. In B, absolute responses (spikes/s) are shown. Filled diamonds show binocular interaction functions before application of bicuculline (control); open squares show those obtained during bicuculline iontophoresis (+bicuculline). Responses to the dominant-eye stimulus alone are represented by the symbols on the right labeled mono and the dashed and dotted lines. Responses to a blank screen are given by the symbols on the far right, marked blank. In C, the same responses are shown, normalized to the control response to the dominant eye alone, which is represented by the dotted line (100%). Note that the removal of cortical inhibition leaves the shape of the binocular interaction function primarily unchanged but greatly reduces suppression at near-orthogonal orientations. spk, Spikes; deg, degrees.

Scatter plot showing relative strength of interocular suppression before (control) and after antagonizing intracortical inhibition by bicuculline iontophoresis for the population of 28 cells tested. For all but three neurons, results fall below the dotted unity line, indicating that interocular suppression was stronger before than after application of bicuculline.
It should be noted that bicuculline salts used in this study [and those by Sillito (1975, 1979)] reportedly block Ca2+-activated K+ channels that mediate the low-threshold spike burst afterhyperpolarization (Debarbieux et al., 1998). However, any such action is unlikely to produce the stimulus selective effects (broadening of orientation tuning, loss of cross-orientation suppression) that we describe.
More direct evidence for the orientation tuning of cortical inhibition has come from intracellular studies, some of which have indeed concluded that inhibitory inputs are less selective for orientation than excitatory inputs (Borg-Graham et al., 1998) or are tuned to different orientations (Pei et al., 1994; Martinez et al., 2002), although others have found that inhibitory potentials at nonoptimal orientations are weak (Douglas et al., 1991) or that excitation and inhibition are equally selective (Anderson et al., 2000). Additionally, a recent study combining in vivo optical imaging and in vitro scanning photostimulation found that in ferret visual cortex the tuning of inhibitory inputs in extragranular pyramidal neurons is significantly broader compared with the tuning of excitatory inputs (Roerig and Chen, 2002). Moreover, the typical difference in tuning between presynaptic and postsynaptic cells is greater for inhibitory than excitatory inputs.
Anatomical substrates of intracortical inhibition
The balance of evidence suggests that the question is not so much whether inhibitory cortical inputs tuned to a wide range of orientations exist, but rather what their functional significance is. To address this issue, it is important to consider the spatial extent and distribution of inhibitory connections in V1. In ferret visual cortex, between 80 and 90% of all synaptic inputs (both excitatory and inhibitory) have been found to originate within <500 μm of the recorded neurons (Roerig and Chen, 2002) (i.e., the vast majority are local to a functional cortical column). Of the numerous types of inhibitory cortical interneurons (for review, see Markram et al., 2004), only two appear to provide long-range lateral inhibition, namely large basket cells and Martinotti cells. Basket cells constitute approximately one-half of all inhibitory neurons; among those, large basket cells are the primary source of lateral inhibition across columns within the layer that contains their somata (Markram et al., 2004). Although the specificity of Martinotti cell projections in the primary visual cortex is as yet unknown, a number of studies have related basket cell projections to the V1 functional architecture (for review, see Kisvárday et al., 2000). The exclusively local projections of layer 4 clutch cells, and the local projections of layer 2/3 medium-sized basket cells (which make up three-fourths of their total projections) are predominantly found in iso-orientation target sites (Buzás et al., 2001). In contrast, the long-distance (>500 μm) projections of layer 3 large basket cells are somewhat biased toward cross-orientation sites. This is in broad agreement with a photostimulation study showing that short-range synaptic inputs of V1 neurons tend to be iso-oriented, whereas longer-range inputs are more evenly distributed across orientation domains (Roerig and Chen, 2002). Moreover, the (shorter) projections of medium-sized basket cells are mainly found in same-eye ocular dominance domains, whereas the long-distance projections of large basket cells contact both same- and opposite-eye domains (Buzás et al., 2001).
Because cross-orientation suppression is elicited primarily from within the classical receptive field (DeAngelis et al., 1992), the originating neurons are likely to have primarily overlapping receptive fields and to reside in the vicinity of the neuron that is being inhibited. It therefore seems reasonable to conclude that any cortical component of suppression by a superimposed mask should rather be iso-orientation, not cross-orientation, tuned. The functional role of those predominantly iso-oriented inputs may be the refinement of cortical orientation selectivity, as proposed by recurrent models (Wörgötter and Koch, 1991; Somers et al., 1995). By comparison, interocular suppression will have to involve projections across at least one ocular dominance column width (∼500 μm), presumably by large basket cells. As outlined above, these should cover the full range of orientation preferences, with a weak bias toward cross-orientations.
Footnotes
This work was supported by the Medical Research Council (UK) and the Human Frontier Science Program. We thank Christopher Howarth for help with some of the experiments and Ulf T. Eysel for advice on micro-iontophoresis.
Correspondence should be addressed to Frank Sengpiel, Cardiff School of Biosciences, Museum Avenue, Cardiff CF10 3US, UK. E-mail: SengpielF{at}cf.ac.uk.
Copyright © 2005 Society for Neuroscience 0270-6474/05/256394-07$15.00/0


