

Article Figures & Data
Figures
- Figure 1.
Preabsorption of the primary GABA antiserum (A1–A3) and double GABA/NeuN labeling (B1–B3). A1, Coronal section of the lumbar spinal cord at E13.5 treated with the GABA antiserum. The dotted square corresponds to the ventral area shown in A2 at a higher magnification. A2, Perikarya as well as neurites show intense immunostaining for GABA (arrowheads and arrows, respectively). A3, A section incubated with GABA antiserum pretreated with 40 μm GABA–glutaraldehyde–BSA conjugate. The pretreatment results in a complete loss of staining. B1–B3, Somata immunoreactive for GABA (green, arrowheads; B1) and NeuN (red, open arrows and arrowheads; B2) in a 4 DIC organotypic culture. The merged image in B3 indicates that all GABA-IR somata are also immunoreactive for NeuN (yellow, arrowheads), whereas numerous other NeuN-IR somata are not GABA positive (open arrows). dh, Dorsal horn; v, ventricle; vc, ventral commissure; vh, ventral horn; vz, ventricular zone. Scale bars: A1, A3, 200 μm; A2, 50 μm; B1–B3, 20 μm.
- Figure 2.
Comparable maturation of the typical GABAergic population in utero (A–G) and in organotypic culture (H–L). A, B, At E11.5, sparse GABA immunoreactivity is first detected at brachial levels (A), whereas no GABA labeling is present at lumbar levels (B). C, D, At E13.5, numerous cells are detected at brachial levels, whereas few stained cells are revealed at lumbar levels. E, F, At E15.5, the reverse pattern is observed in the spinal cord with a low number of GABA-IR cells at brachial levels (E) and a high number of GABA-IR cells at lumbar levels (F). G, The quantitative analysis reveals peaks (asterisks) of GABA-IR density at E13.5 and at E15.5, at the brachial level (black bars) and at the lumbar level (gray bars), respectively (*p < 0.05; Dunn's test), compared with E11.5. H, I, In organotypic culture after 2 DIC, numerous GABA-IR cells are detected at the brachial level (H), whereas the immunoreactivity is less apparent at the lumbar level (I). J, K, After 6 DIC, fewer GABA somata are present at the brachial level, whereas a denser population of GABA-IR cells is present at the lumbar level. L, Quantification of the number of GABA-IR cells indicates a peak (asterisks) at 2 DIC at the brachial level and at 6 DIC at the lumbar level (*p < 0.05; Dunn's test; compared with E11.5). The arrows indicate the GABA-IR process, and arrowheads indicate GABA-IR soma. n = 6 for each stage of development. Scale bars, 20 μm.
- Figure 3.
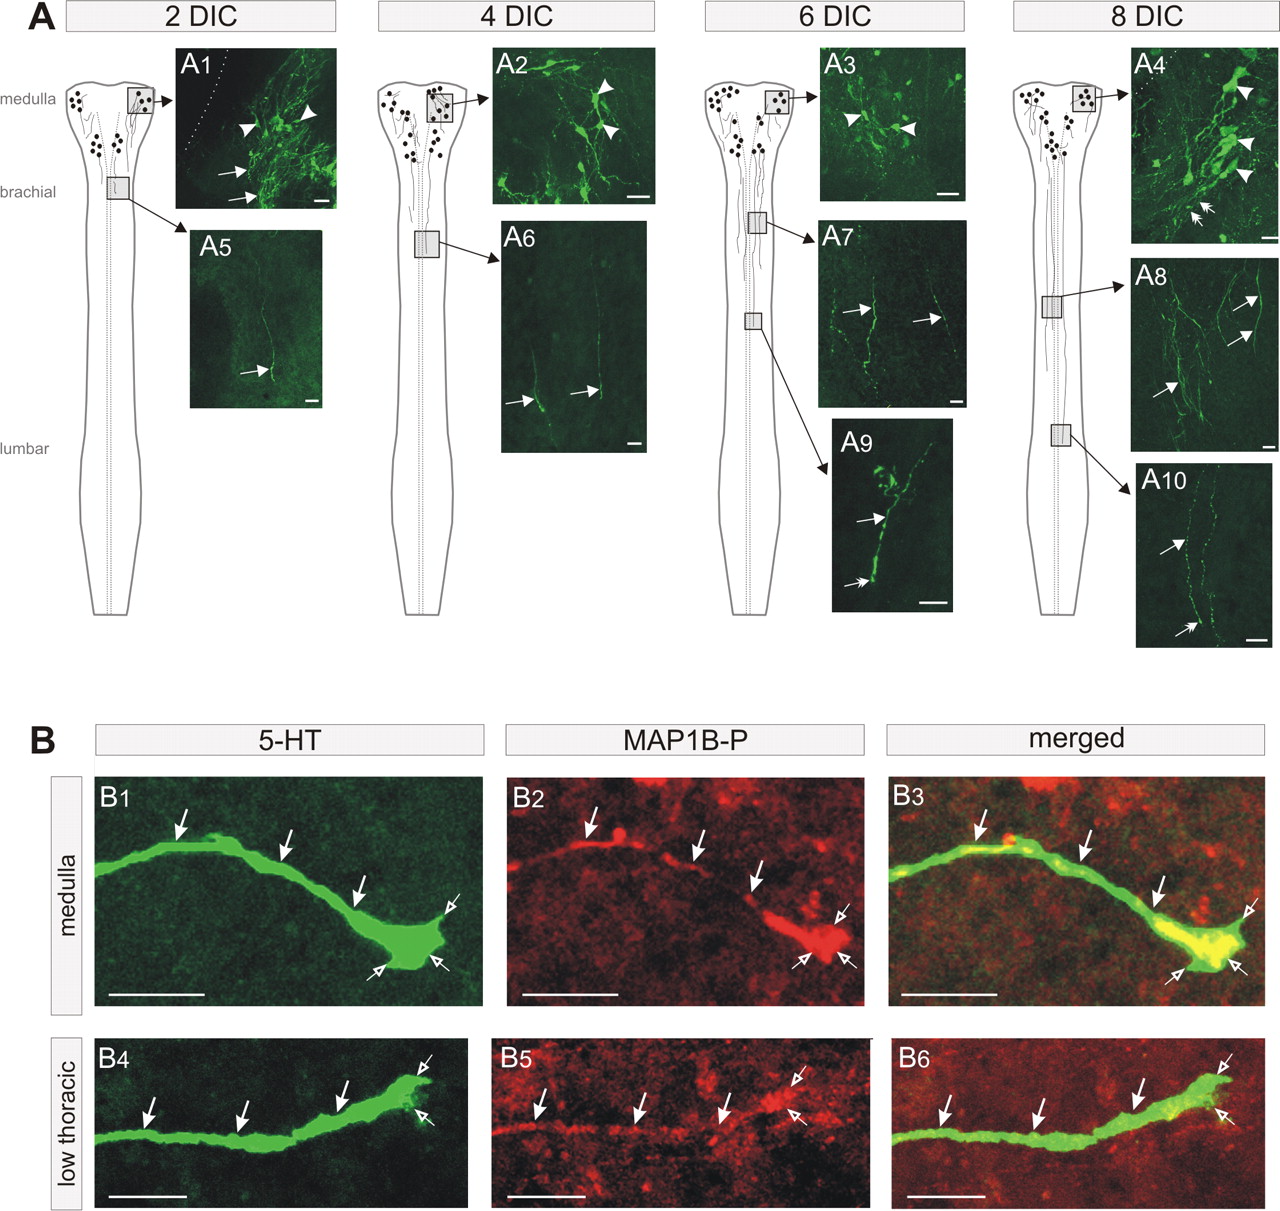
Maturation of 5-HT descending inputs in organotypic culture (A) and double 5-HT/MAP1B-P labeling (B). A1–A4, The raphe nuclei express 5-HT-IR cells and processes in the medulla during the entire course of the culture. A5, After 2 DIC, starting at E11.5, 5-HT descending inputs are found only at the brachial level. A6–A10, Descending fibers progressively invade the spinal cord to reach lumbar levels after 8 DIC (A10). n = 4 at each stage. B1–B4, 5-HT-IR fiber (green, arrows) in the medulla (B1) in the low thoracic level (B4) exhibiting a growth cone (open arrows). B2–B5, MAP1B-P labeling in the same fiber (red, arrows). Note that the growth cone is MAP1B-P positive (open arrows). B3–B6, Merged image showing the superposition of the 5-HT and MAP1B-P labeling (yellow). The images shown in B1–B6 are 0.2 μm confocal sections. Scale bars: A, 20 μm; B, 10 μm.
- Figure 4.
Role of 5-HT on the maturation of the GABAergic spinal population. A, Schematic drawing of the spinal cord without the medulla maintained in culture with pCPA to eliminate 5-HT synthesis. B, C, In the absence of 5-HT, a very high number of cells is immunostained for GABA at 2 DIC, as illustrated at the brachial level (B); this number then decreases after 6 DIC (C). D, Quantitative analyses reveal a synchronized expression of GABA-IR cells between the brachial and lumbar levels and a peak in density at 2 DIC (asterisks) at the brachial level and at 4 DIC at the lumbar level (asterisks). E, Organotypic cultures without the medulla containing ectopic 5-HT intraspinal cells (Branchereau et al., 2002). F, After 2 DIC, few GABA-IR cells are detected at the brachial level. G, The number of immunoreactive cells increases after 6 DIC. H, Note that the peak of maximum density is synchronized at both levels studied and emerges after 6 DIC (first asterisks). I, The addition of 5-HT to the medium in the presence of pCPA provides an exogenous source of 5-HT to the preparation. J, K, No staining is detected at 2 DIC at the brachial level (J), whereas numerous GABA-IR cells are observed at 6 DIC at the same level (K). L, The development of the GABAergic population is synchronized at the brachial and lumbar levels and exhibits a peak of immunoreactivity at 6 DIC (first asterisks).To make a direct comparison, all pictures were taken at the brachial level. *p<0.05 (Dunn's posthoc test) compared with E11.5. The arrows indicate GABA-IR neurites, and the arrowheads indicate GABA-IR soma. The dotted lines indicate the midline. n = 6 for each stage in each bar.
- Figure 5.
Implication of the 5-HT1 receptor family in the downregulating effect of 5-HT on the maturation of the GABAergic cell population. Organotypic preparations were maintained for 4 DIC without the medulla and in the presence of pCPA, and the density of GABA-IR cells was then quantified at the brachial level. As illustrated in Figure 3D, a high number of GABA-IR cells is observed in the control condition (pCPA; black bar). The addition of 5-HT to the medium, however, decreases the density of GABA-labeled cells (light gray bar). In the presence of the 5-HT1A receptor antagonist (WAY) or 5-HT1B receptor antagonist (SB), the downregulating effect of 5-HT is not observed. In the presence of either the 5-HT2A/2C receptor antagonist (ketanserin) or 5-HT3 receptor antagonist (3-TI-3-CM), however, the inhibiting effect is still observed. *p < 0.05 versus the 5-HT control (Dunn's post hoc test).
- Figure 6.
Role of 5-HT descending inputs on the maturation of the GABAergic spinal population. A, Schematic drawing of the spinal cord and medulla maintained in culture with pCPA to eliminate 5-HT synthesis. B, After 2 DIC, numerous cells and processes are stained for GABA at the brachial level. C, After 6 DIC, the number of GABA-IR cells has diminished. D, The quantification of the evolution in culture of the number of GABA-IR cells indicates that GABA maturation is similar at brachial and lumbar levels, with no rostrocaudal delay and a common peak of GABA cell density at 2 DIC (first asterisks). *p < 0.05 (Dunn's post hoc test) compared with E11.5. The arrows indicate GABA-IR neurites, and the arrowheads indicate GABA-IR soma. The dotted lines indicate the midline. n = 6 for each stage of development.
- Figure 7.
Histogram illustrating the peaks of GABA-IR cells at brachial (A, C, E, G) and lumbar (B, D, F, H) levels in the different experimental paradigms used: with the medulla + 5-HT (A, B), with the medulla no 5-HT (C, D), no medulla no 5-HT (E, F) and no medulla + 5-HT (G, H).


