
Abstract
Large Ca2+ signals essential for cerebellar long-term depression (LTD) at parallel fiber (PF)-Purkinje cell synapses are known to be induced when PF activation precedes climbing fiber (CF) activation by 50-200 ms, consistent with cerebellar learning theories. However, large Ca2+ signals and/or LTD can also be induced by massive PF stimulation alone or by photolysis of caged Ca2+ or inositol 1,4,5-trisphosphate (IP3). To understand the spike-timing detection mechanisms in cerebellar LTD, we developed a kinetic model of Ca2+ dynamics within a Purkinje dendritic spine. In our kinetic simulation, IP3 was first produced via the metabotropic pathway of PF inputs, and the Ca2+ influx in response to the CF input triggered regenerative Ca2+-induced Ca2+ release from the internal stores via the IP3 receptors activated by the increased IP3. The delay in IP3 increase caused by the PF metabotropic pathway generated the optimal PF-CF interval. The Ca2+ dynamics revealed a threshold for large Ca2+ release that decreased as IP3 increased, and it coherently explained the different forms of LTD. At 2.5 μm IP3, CF activation after PF activation was essential to reach the threshold for the regenerative Ca2+ release. At 10 μm IP3, the same as achieved experimentally by strong IP3 photolysis, the threshold was lower, and thus large Ca2+ release was generated even without CF stimulation. In contrast, the basal 0.1 μm IP3 level resulted in an extremely high Ca2+ threshold for regenerative Ca2+ release. Thus, the results demonstrated that Ca2+ dynamics can detect spike timing under physiological conditions, which supports cerebellar learning theories.
- calcium
- LTD
- simulation
- timing detection
- inositol
- feedback
Introduction
The Purkinje cells in the cerebellar cortex receive two major excitatory synaptic inputs, one of which is from a number of parallel fibers (PFs) and the other of which is from a single climbing fiber (CF). Cerebellar long-term depression (LTD) is a persistent reduction in the efficacy of PF-Purkinje cell synapses that is induced by paired stimulation of PFs and CFs, and it is thought to be one of the cellular bases of learning and memory (Marr, 1969; Albus, 1971; Linden and Connor, 1995; Ito, 2001). Cerebellar learning theories (Ito, 1970; Kawato, 1999; Yamamoto et al., 2002) state that PFs convey the information required for motor command generation, whereas CFs carry error signals, which are inevitably delayed compared with PF activation. Thus, the theories predict that PF activation preceding CF activation is a more effective sequence to induce LTD than CF activation preceding PF activation, and this has been supported by several experimental studies (Chen and Thompson, 1995; Schreurs et al., 1996; Wang et al., 2000). However, inconsistent PF-CF time windows for LTD induction have frequently been reported, and it has been found possible to induce LTD in vitro by massive stimulation of a PF bundle alone (Hartell, 1996), Ca2+ uncaging (Miyata et al., 2000), or inositol 1,4,5-trisphosphate (IP3) uncaging (Finch and Augustine, 1998) instead of by conjunctive PF-CF stimulation, thus raising doubts about LTD as one of the cellular bases of learning (De Schutter, 1995; Llinas et al., 1997).
Among the many signaling molecules involved in LTD induction, Ca2+ has been suggested as a candidate for the molecule that detects the coincidence and the timing of PF- and CF-induced spikes in Purkinje cell dendrites (Berridge, 1998; Wang et al., 2000). Multiphoton Ca2+ imaging of dendritic spines in Purkinje cells has shown that PF stimulation followed by CF stimulation is the most efficient sequence for inducing “supralinear” Ca2+ signals (>10 μm) and subsequent cerebellar LTD (Wang et al., 2000). The term “supralinear” means that the Ca2+ response to conjunctive PF-CF inputs is greater than the sum of the responses to PF input alone and CF input alone. The IP3 receptor (IP3R) is a possible candidate for the coincidence detector for supralinear Ca2+ increases (Berridge, 1998). IP3Rs are intracellular Ca2+ release channels that are coactivated by IP3 and Ca2+, and they are essential for the induction of LTD (Finch and Augustine, 1998; Inoue et al., 1998). Although PF inputs induce production of IP3 via the metabotropic pathway (Finch and Augustine, 1998), CF input induces strong depolarization leading to a Ca2+ influx through voltage-gated Ca2+ channels (VGCCs) of Purkinje cell dendrites at PF spines (Miyakawa et al., 1992). However, the idea that IP3Rs constitute the mechanism for coincidence detection needs to be further explored and tested to determine whether it is capable of explaining the temporal window and the different forms of LTD.
To elucidate the dynamics of the cellular computations for spike-timing detection, we developed a Ca2+ dynamics model based on known biochemical signal transduction pathways. We first hypothesized that a delay in the increase in IP3 caused by the PF metabotropic pathway generates the optimal PF-CF interval, that CF input after PF input triggers regenerative Ca2+ release from internal stores through IP3 Rs, and that the Ca2+ response exhibited a threshold dynamics for large Ca2+ release that decreases as IP3 increases. If this hypothesis is true, it would coherently explain the different forms of LTD.
Materials and Methods
Model structure and compartments of a Purkinje dendritic spine
We modeled a mature Purkinje dendritic spine and divided it into three compartments [i.e., the cytosol, postsynaptic density (PSD), and endoplasmic reticulum (ER), with volumes of 0.1, 0.002, and 0.02 μm3, respectively] based on serial electron microscopy observations (Harris and Stevens, 1988), and the volume of the extracellular space was 10 μm3. Because of the small volume of the spine, we assumed that the molecules it contains were well mixed and that their concentrations were uniform within each compartment. All spatial diffusion of molecules between compartments is mediated by channels and pumps, except for the diffusion of IP3 and Ca2+ between the cytosol and PSD. The diffusion constants of the molecules are so high [the diffusion constants are 283 μm2/s for IP3 (Allbritton et al., 1992) and 220 μm2/s for Ca2+ (Klingauf and Neher, 1997)] that diffusion between compartments in the small volume of the spine should be completed within 1 ms. We therefore set that the concentrations of IP3 and Ca2+ would reach a state of dynamic equilibrium between the cytosol and PSD with a time constant of 1 ms, which is much faster than most chemical binding reactions in Ca2+ signaling.
We did not model the Ca2+ concentration in the dendritic shafts or soma because dendritic spines are biochemically almost completely separated from their dendrites. Ca2+ ions in the spines do not diffuse much through the spine neck (Sabatini et al., 2002). Because cerebellar Purkinje cells contain higher concentrations of endogenous Ca2+ buffers than other neurons (Fierro and Llano, 1996; Maeda et al., 1999), for the sake of simplicity, all Ca2+ entry from outside the spine can be assumed to be attributable to Ca2+ influx from VGCCs at the spine. Because action potential activity in the soma does not propagate back to dendritic shafts and spines in Purkinje cells (Stuart and Hausser, 1994; Vetter et al., 2001), Ca2+ influx in the spine is mainly induced by PF and CF activation. We applied Ca2+ pulse as Ca2+ influx by PF and CF activation instead of by modeling the kinetics of AMPARs and VGCCs. Although dense PF stimulation induces large Ca2+ influxes (Wang et al., 2000), we did not apply dense bundle PF stimulation. Ca2+ influx induced by repetitive PF activation may be strengthened or weakened because of depolarization and/or hyperpolarization as a result of the activity of other synapses, but we ignored the effects of other synaptic activity as well as short-term potentiation or depression in our model.
Block diagram of Ca2+ signaling pathways
We constructed a block diagram of Ca2+ signal transduction pathways in a Purkinje dendritic spine (Fig. 1), based on the literature (Fiala et al., 1996; Kim and Thompson, 1997; Daniel et al., 1998; Rose and Konnerth, 2001; Ito, 2002). CF input generates a strong depolarization and opens VGCCs, resulting in a Ca2+ influx into the dendritic spine (Miyakawa et al., 1992). PF input raises the postsynaptic Ca2+ concentration in the Purkinje dendritic spine via two pathways, one mediated by AMPA receptors (AMPARs) and the other mediated by metabotropic glutamate receptors (mGluRs). In the AMPAR pathway, the activated AMPARs induce depolarization of the membrane potential of the PF spine and open VGCCs (Eilers et al., 1995), and extracellular Ca2+ enters the cytosol through the VGCCs. In the mGluR pathway, glutamate released from the PF terminal activates mGluRs, and the activated mGluRs in turn induce production of IP3 via G-proteins (Gq) and phospholipase Cβ (PLCβ) at the PSD (Jiang et al., 1994; Sugiyama et al., 1999; Tanaka et al., 2000). IP3 then diffuses from the postsynaptic membrane into the cytosol. Finally, IP3Rs, which are IP3-gated Ca2+ channels in the ER, release Ca2+ from the ER (Finch and Augustine, 1998).

Block diagram of signaling pathways for Ca2+ release at a dendritic spine in Purkinje cells. Arrows and bars indicate stimulatory and inhibitory interactions. The dashed arrow indicates depolarization by CF stimulation. Molecular diffusion through the spine neck is not considered.
Cytosolic IP3 is degraded by IP3 3-kinase and IP3 5-phosphatase within a few seconds (Dupont and Erneux, 1997; Irvine and Schell, 2001). Free cytosolic Ca2+ is buffered by Ca2+ endogenous buffers, and we included parvalbumin, calbindin-D28k, and putative low-affinity buffers (Airaksinen et al., 1997; Maeda et al., 1999; Vecellio et al., 2000). We also included an exogenous buffer, Magnesium Green 1 as a Ca2+ indicator, to compare the results of simulation with the results of the Ca2+ imaging experiments (Wang et al., 2000). Cytosolic Ca2+ is pumped out by Na+/Ca2+ exchangers and Ca2+-ATPase in the plasma membrane (PMCA) and in the ER (SERCA) (Xu et al., 1997).
Representation of PF and CF inputs in the model
Instead of modeling the kinetics of AMPARs and VGCCs, a rectangular Ca2+ pulse was applied to the cytosol to achieve a Ca2+ influx as a result of VGCC opening. Instead of the CF input, an influx of 5000 Ca2+ ions was delivered over a period of 2 ms (in the form of a rectangular Ca2+ entry waveform with 2500 ions/ms). PF input was represented by a burst consisting of five pulses at 100 Hz. Instead of the AMPAR pathway, an influx of 1500 Ca2+ ions over a period of 1 ms per PF pulse was delivered. This assumed degree of Ca2+ influx is consistent with a previous estimate that the Ca2+ influx through VGCCs in the spines is ∼1000 Ca2+ ions per depolarization (Sabatini and Svoboda, 2000). Glutamate was released at the synaptic cleft during each PF pulse. Only 300 glutamate molecules were assumed to be involved in the binding reaction of Glu and mGluRs, because mGluRs localize at the edge of the PSD, where the neurotransmitter concentration is lower than at the center of the PSD (Mateos et al., 2000; Franks et al., 2003). The glutamate was recycled by glutamate transporters with a decaying time constant of 5 ms.
Formulation of the reactions in the signaling pathways
All reactions in the signal transduction pathways were represented by binding and enzymatic reactions. For example, a binding reaction in which A binds to B to form AB is expressed by the following equation:  1
1
where kf and kb are the rate constants for the forward and backward reactions. The rates kf and kb are determined by the dissociation constant Kd and the time constant τ. Kd is defined as Kd = kb/kf. τ indicates the reaction speed toward the equilibrium. Equation 1 is represented as a differential equation with the following form:  2
2
Enzymatic reactions were modeled by the Michaelis-Menten formulation:  3
3
where S, E, and P denote substrates, enzymes, and products, respectively. The Michaelis constant Km is defined as Km = (k-1 + kcat)/k1. The maximum enzyme velocity Vmax is defined as Vmax = kcat [E]total, where [E]total is the total concentration of the enzyme. Unless actual rate constants were provided in the literature, k-1 was assumed to be four times larger than kcat. Additional simulations confirmed that the ratio of k-1 to kcat had little effect on the Ca2+ response. Graphic illustrations of all reactions are provided in supplemental Figure 1 (available at www.jneurosci.org as supplemental material). Details regarding parameter estimation, kinetic reactions, and the parameter table in the model are given in supplemental Tables 1 and 2 (available at www.jneurosci.org as supplemental material).
Schematic model of IP3R kinetics
We constructed a model of IP3R kinetics based on recent measurements of Ca2+ release (Marchant and Taylor, 1997) and a conceptual model (Adkins and Taylor, 1999). It was assumed that each IP3R possesses one IP3 activation site, one Ca2+ activation site, and four Ca2+ inactivation sites. IP3 binding determines whether a Ca2+ ion binds to the activation site or to one of the four inactivation sites in the model (Fig. 2 A). In the basal state, 90% of IP3Rs are not bound to any ligands (Fig. 2 A, R). IP3 binding to an IP3R exposes the Ca2+ activation site. Thus, IP3R opening requires sequential binding to one IP3 molecule and one Ca2+ ion (Fig. 2 A, R→RI→RIC). On the other hand, if no IP3 binds to an IP3R, the four Ca2+ inactivation sites are exposed, and binding of one or more Ca2+ ions to the inactivation sites of an IP3R prevents IP3 binding to the IP3 activation site (Fig. 2 A, B, R→RC→RC2→RC3→RC4) (Marchant and Taylor, 1997; Adkins and Taylor, 1999). The IP3R model reproduced the equilibrium open probability of an IP3R that possesses a bell-shaped Ca2+ dependency with a peak free cytosolic Ca2+ concentration ([Ca2+]i) of 0.2-0.3 μm (Bezprozvanny et al., 1991; Fujiwara et al., 2001). The numbers of Ca2+ activation and inactivation sites influence the steepness of this open-probability function, and a curve fitting the bell-shaped open-probability function helped us to recognize that the existence of one activation site and four inactivation sites in an IP3R satisfied the experimental data (Fig. 2C). The number of inactivation sites is consistent with the fact that an IP3R consists of four identical subunits.

Model of IP3R kinetics used in the simulation. A, Most IP3Rs are not bound to any ligands (R) in the steady state. Both IP3 and Ca2+ are required to open IP3Rs. The Ca2+ activation site does not emerge until IP3 binds to the IP3R. An IP3R opens when IP3 binds to the IP3R and then Ca2+ binds to the IP3R (R→RI→RIC). Ca2+ also inactivates IP3Rs (R→RC→RC2→RC3→RC4).IP3 can not bind to IP3Rs in any of these four inactivation states. IP3Rs are activated and then inactivated by Ca2+ elevation, because the inactivation of IP3Rs by Ca2+ is assumed to be much slower than the activation of IP3Rs by Ca2+ for positive feedback loop of Ca2+-induced Ca2+ release. B, Parameter reduction during the process of IP3R inactivation by Ca2+ binding. White and black squares indicate naive and inactivated subunits, respectively, of an IP3R. The eight parameters in the IP3R inactivation kinetics are reduced to three parameters: kf, kb, and ϵ. C, Open probability of IP3Rs dependent on cytosolic Ca2+ concentration (line) in the model at 10 μm IP3 and x in experiments with IP3Rs reconstituted into planar lipid bilayers at 2 μm IP3 (Bezprozvanny et al., 1991). The difference in the IP3 concentrations is attributable to the lower IP3 affinity of IP3Rs in vivo than in the constructed lipid bilayers (Khodakhah and Ogden, 1995; Fujiwara et al., 2001).
Estimation of kinetic parameters in the IP3R model
Biochemical reactions are generally characterized by two parameters, a forward rate constant (kf) and a backward rate constant (kb), and we estimated the dissociation constant Kd and time constant τ, which uniquely determine the value of kf and kb.
IP3-dependent activation. Distinct affinities of IP3R for IP3 have been reported in in vitro and in vivo measurements. A purified IP3R in the constituted lipid bilayer showed the affinity Kd for IP3 of ∼1 μm (Bezprozvanny et al., 1991), whereas Ca2+ response to photolysis of caged IP3 in Purkinje cells suggested lower affinity of IP3R for IP3, because IP3-induced Ca2+ release required an IP3 concentration >10 μm (Khodakhah and Ogden, 1995). From other in vivo measurements of IP3R-mediated Ca2+ depletion of the Ca2+ stores, the Kd value was estimated to be 25.8 μm (Fujiwara et al., 2001), and we used this value. IP3 binding must be slow to explain the delay of 50-400 ms in Ca2+ release in response to IP3 application, suggested in other in vivo measurements (Marchant and Taylor, 1997). In contrast, our model with rapid IP3 binding reproduced the delay in Ca2+ release (see Fig. 8C, right, black), and the delay resulted from a positive feedback of Ca2+-induced Ca2+ release. Because IP3R opening requires coactivation by Ca2+ and IP3, IP3 application alone does not instantaneously and fully activate Ca2+ release through IP3Rs.

Ca2+ dynamics with threshold dependent on [IP3]. A, [IP3] was step-changed to 0.1, 2.5, or 10 μm from the steady state, 0.1 μm, at time 0 ms. B, The 2 ms Ca2+ influx started to be delivered at the same time, 0 ms. The amounts of Ca2+ influx were adjusted so that the transient Ca2+ peaks for 2 ms were 1 μm (violet),2 μm (dark blue), 3 μm (light blue), 4 μm (dark green), 5 μm (light green), 6 μm (yellow), 7 μm (orange), 8 μm (red), 9 μm (magenta), and 10 μm (pink). The black lines indicate that no Ca2+ influx was delivered. C, Response of [Ca2+]i to the combination of step-changed [IP3] and Ca2+ influx. Inset, Enlargement of the [Ca2+]i response, the transient Ca2+ peaks of which were 2 and 3 μm at 2.5 μm [IP3]. D, Response of IP3R inactivation rate to the combination of step-changed [IP3] and Ca2+ influx. E, Trajectories in C (t-x plane) and D (t-y plane) were mapped on the phase plane of [Ca2+]i versus the IP3R inactivation rate (x-y plane). Arrows indicate the time directions in the trajectories. F, Average Ca2+ response over 500 ms after inputs is colored in the contour map as a function of step-changed [IP3] and the transient Ca2+ peak. The bar at the left illustrates the color and contour scales of the averaged Ca2+ response. The red area indicates suprathreshold responses, and the blue area indicates subthreshold responses. The three dotted lines approximately indicate the maximum levels of the transient Ca2+ peaks in response to CF and PF stimulation and the IP3 amplitude in response to PF stimulation. See Discussion for the meaning of regions (i)-(vi).
Ca2+-dependent activation. The dissociation constant Kd was estimated from the bell-shaped Ca2+ dependency measured by both the open probability in lipid bilayers (Bezprozvanny et al., 1991) and the Ca2+ release in vivo (Fujiwara et al., 2001). We assumed that the activation is fast (τ < 10 ms), because no studies have reported the speed of Ca2+ activation.
Ca2+-dependent inactivation. We assumed a multiple-step model for Ca2+-dependent inactivation, because multiple steps are required to reproduce the full inactivation of IP3Rs at high Ca2+ concentrations (Bezprozvanny et al., 1991; Fujiwara et al., 2001). The four inactivation sites are identical (i.e., only the number of inactivation sites occupied by Ca2+ ions affects the sequential inactivation reactions, without regard to the actual positions occupied). The Ca2+-binding reactions to the four inactivation sites are governed by a total of eight parameters [four forward rate constants (kf) and four backward constants (kb), or four dissociation constants (Kd) and four time constants (τ)] (see Fig. 2 B). For simplification, we assumed that binding of one additional Ca2+ ion increases the kf value ϵ-fold (ϵ is referred to as the “cooperative factor”). If ϵ = 1, the inactivation reaction of each subunit is independent of the state of the other subunits. Note that this simplification is used just to reduce the parameter number and has not been experimentally confirmed.
Simplification reduced the eight parameters to three parameters (kf, kb, and ϵ). Curve fitting to the bell shape (Fig. 2C) yielded kb/kf = 2.25 μm and ϵ = 3. The time constant τ was estimated (kf = 2.22/s/μm, kb = 5/s) based on the inhibition of Ca2+ release by previous incubation with Ca2+ (Adkins and Taylor, 1999).
We also assumed that the Ca2+ inactivation reactions were slower than the Ca2+ and IP3 activation reactions. Because of the difference in time constants for the Ca2+-dependent IP3R activation and inactivation, IP3Rs are transiently activated and then gradually inactivated by Ca2+ elevation.
Initial state in the simulation
We defined the baseline as the stable equilibrium point in the absence of any PF or CF inputs. All simulation started from the baseline. [Ca2+]i and [IP3] at baseline converged at 0.06 and 0.1 μm, respectively. The baseline 0.1 μm [IP3] in our model is consistent with the 0.04 μm [IP3] measured in Xenopus oocytes (Luzzi et al., 1998).
Simulator and numerical integration
We ran the model on a computer by using the GENESIS simulator with Kinetikit interface (Bhalla and Iyengar, 1999). The exponential Euler method (MacGregor, 1987) with a time step of 1 μs was used to solve the differential equations.
Definition of time-window function
The time window of the Ca2+ response was defined as the average relative change in fluorescence (ΔF/F0) of Ca2+ indicator as a function of the time difference between the PF input and the CF input. The indicator is Magnesium Green 1 (250 μm; Kd = 19 μm; Fmax/Fmin = 2). The time difference between the PF input and the CF input is identical to the time of the CF input because we applied the PF input at 0 ms. ΔF/F0 was averaged from the first input (either PF or CF) to 500 ms after the final input of PF and CF. This time-window definition is as per the method used to analyze results of the Ca2+ imaging experiment (Wang et al., 2000) for direct comparisons. ΔF/F0 in the simulation is calculated by the following formula:  4
4
The numerator and denominator are present fluorescence and basal fluorescence, respectively. MgGreen denotes free Magnesium Green 1, and MgGreen-Ca2+ is a binding form of MgGreen and Ca2+. Fmax/Fmin is the ratio of the maximum fluorescence to the minimum fluorescence.
Estimation of the values of unknown parameters
The schematic model as shown in Figure 1 illustrates the molecular interactions. The interactions were described by biochemical reactions as graphically shown in supplemental Figure 1 (available at www.jneurosci.org as supplemental material). Our model consists of 53 variables and 96 parameters (supplemental Tables 1 and 2, available at www.jneurosci.org as supplemental material). To make the model as realistic as possible, the values for the parameters were estimated from experimental data obtained in cerebellar Purkinje cells, if they were available. When such data did not exist, experimental data from other cells, chemical reaction in test tubes, and other similar subtypes were used, in that order of preference (Table 1) (for more detailed information, see supplemental Table 3, available at www.jneurosci.org as supplemental material). These above parameters, the values of which were taken from the literature, are defined as known parameters. The remaining parameters are defined as unknown parameters. These values were chosen for unknown parameters so that the simulation results did not contradict the various known experimental findings, as explained in detail below.
Classification of parameters
Time constants τ, obtained from kf and kb, are dominant in the unknown parameters. Slow reactions in the signaling pathway often relay the signaling stimulus with delay. We assumed unreported τ values to be shorter than 10 ms to prevent them from significantly affecting the simulation results without compelling reason. Three values of the 29 dissociation constants Kd and Michaelis constants Km were assumed (Kd of two putative low-affinity Ca2+ buffers and Km of the binding of mGluR and Gq). The two buffers were assumed to chelate free cytosolic Ca2+ at >10 μm [Ca2+]i (Maeda et al., 1999). The Kd of nonactivated mGluR for Gq was chosen so that half of the mGluRs bound to Gq in the absence of Glu. A high Kd value tends to allow mGluRs to bind Gq before glutamate release, whereas low Kd values do not.
Three of the 12 parameter values of maximum enzyme velocities Vmax were assumed (Gq activation by Glu-bound mGluRs, IP3 production by Ca2+-bound PLCβ without Gq, and IP3 degradation by IP3 3-kinase). The Vmax of Gq activation by Glu-bound mGluRs greatly influences the peak amplitude of the IP3 response to the PF input in the positive direction. High IP3 peaks result in a large increase in Ca2+ (>10 μm) to PF input alone, whereas low IP3 peaks result in small increases in Ca2+ (∼2 μm), even when conjunctive PF and CF inputs are applied regardless of the time difference between the PF input and the CF input. To reproduce the supralinearity of the Ca2+ response to PF and CF inputs (Wang et al., 2000), the Vmax value was chosen. We also adjusted the Vmax value so that the PF input would produce 3 μm IP3. The IP3 amplitude in our model is consistent with the amplitude reported in a study of Ca2+ imaging and IP3 uncaging (Finch and Augustine, 1998). The investigators in that study compared Ca2+ responses to photolysis of caged-IP3 and to PF stimulation. They estimated that 16 PF stimuli at 60 Hz produce 10-20 μm IP3 in the presence of an AMPAR antagonist. In our model, mGluR activation with 16 PF stimuli at 60 Hz evokes 10.3 μm IP3. A balance between IP3 production and degradation that would maintain 0.1 μm [IP3] at the baseline and reproduce the width of the time window (Wang et al., 2000) was assumed.
Of the 21 molecules in the model, concentrations of three have never been reported (SERCA, PMCA, and Na+/Ca2+). Their concentrations were chosen to reproduce their relative contributions to intracellular Ca2+ clearance at different [Ca2+]i (Fierro et al., 1998) and to maintain the baseline [Ca2+]i at 0.06 μm.
Results
Supralinear Ca2+ response induced by conjunctive PF-CF input in the single-spine model
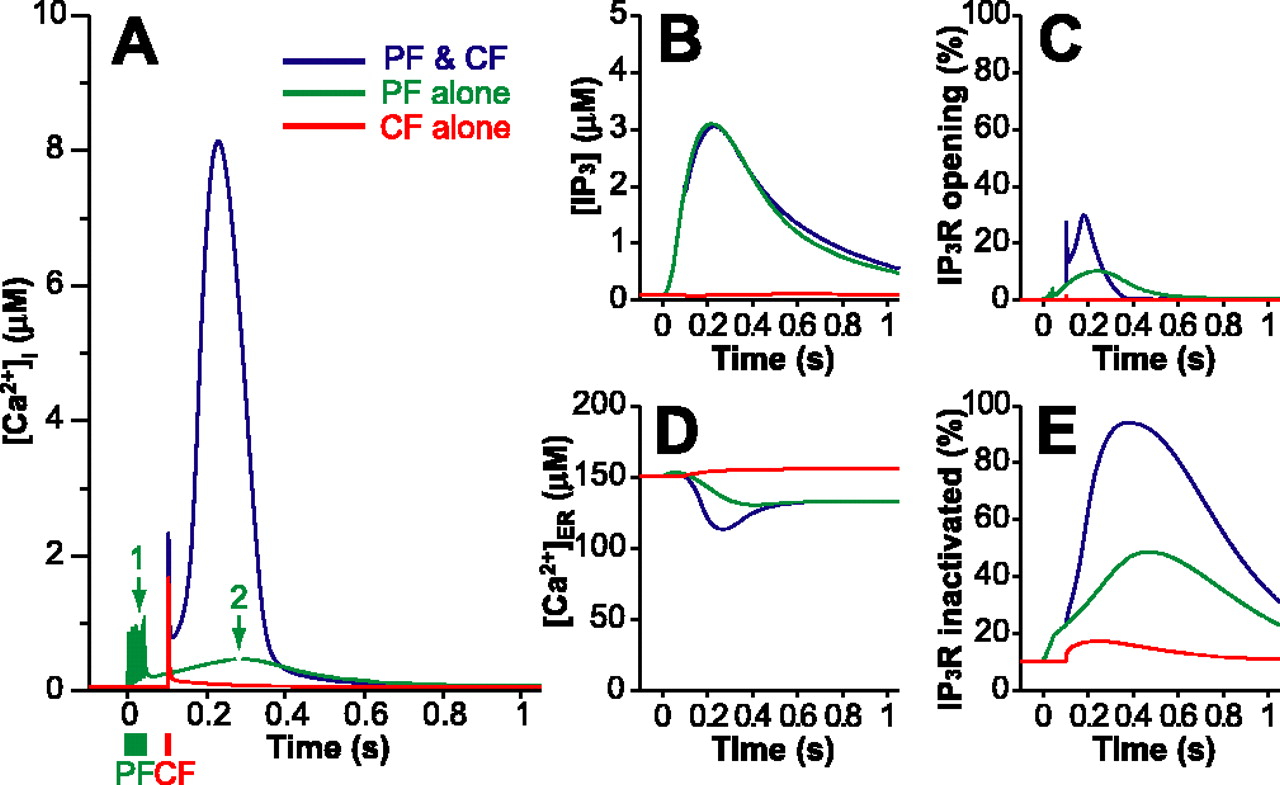
We confirmed that the supralinear Ca2+ response to conjunctive PF and CF stimulation was reproduced in the single-spine model with the parameter set shown in supplemental Tables 1 and 2 (available at www.jneurosci.org as supplemental material). Figure 3A shows simulated Ca2+ responses when PF and/or CF inputs were applied at times 0 and 100 ms. PF input alone yielded five Ca2+ transients of ∼1 μm (Fig. 3A, green, arrow 1) as a result of Ca2+ influx via the AMPAR pathway and a subsequent slow Ca2+ increase (arrow 2) because of IP3 production via the metabotropic pathway. CF input alone evoked a sharp Ca2+ transient with a peak of 2 μm (Fig. 3A, red). The Ca2+ response to conjunctive PF-CF inputs (Fig. 3A, blue) yielded a supralinear signal (8.1 μm peak at 230 ms), and it returned to the basal level within 1 s. The supralinearity of the simulated Ca2+ responses is similar to the supralinearity observed in the Ca2+ imaging experiment (Wang et al., 2000), but not exactly the same. At <1 μm [Ca2+]i, the increase in fluorescence (ΔF/F0) is approximately proportional to the increase in [Ca2+]i, and the ratio is 0.2 μm Δ[Ca2+]i per percentage of ΔF/F0.

Time courses of simulated molecular concentrations in response to PF input (green), CF input (red), and conjunctive PF-CF inputs (blue). PF and CF inputs are applied at 0 and 100 ms, respectively. A, Free cytosolic Ca2+ concentration ([Ca2+]i). B, IP3 concentration ([IP3]). C, Percentage of open IP3Rs. D, Free Ca2+ concentration in the ER ([Ca2+]ER). E, Percentage of inactivated IP3Rs.
Cytosolic IP3 gradually accumulated after the PF inputs (3.1 μm peak at 220 ms) (Fig. 3B, green), and the CF input had little influence on the IP3 dynamics (Fig. 3B, compare blue, green). The proportion of open IP3Rs in response to conjunctive PF-CF inputs reached 30% (Fig. 3C, blue) as opposed to only 10% in response to PF input alone (Fig. 3C, green) and 1.7% in response to CF input alone (Fig. 3C, red). Therefore, CF-mediated Ca2+ transients triggered IP3R activation only during IP3 elevations. The supralinear Ca2+ response was induced by Ca2+ release from the ER Ca2+ stores as a result of opening IP3Rs, as indicated by the increase in open IP3Rs (Fig. 3C, blue) and the reduced Ca2+ concentration in the ER (Fig. 3D, blue). More than 90% of the IP3Rs were in the inactivated state after the conjunctive PF-CF input (Fig. 3E, blue), indicating that IP3R inactivation terminated the supralinear Ca2+ signal.
Ca2+-dependent IP3R activation and inactivation are essential for supralinear Ca2+ dynamics
Supralinear Ca2+ dynamics may be mediated by a positive feedback loop(s) in the signaling pathways. We identified two candidate positive feedback loops for the supralinear Ca2+ signal in the block diagram (Fig. 1). One is the Ca2+-dependent IP3R activation loop. Ca2+ elevation may open IP3Rs, resulting in additional Ca2+ elevation (Ca2+→IP3Rs→Ca2+). The other is the loop of Ca2+ dependent IP3 production by PLCβ. Ca2+ elevation may enhance the activity of PLCβ for IP3 production, and IP3 elevation may open IP3Rs and release Ca2+ from the ER, resulting in additional Ca2+ elevation (Ca2+→PLCβ→IP3→IP Rs3→Ca2+). The diagram also contains two negative feedback loops for terminating Ca2+ release. The Ca2+-dependent IP3R inactivation loop may inhibit IP3R opening at high Ca2+ concentration. Alternatively, Ca2+ release may continue until depletion of the Ca2+ in the ER stores.
We deleted reactions to identify the dominant pathways responsible for Ca2+ dynamics (Fig. 4A), by maintaining the molecular concentration on the upstream side of the reaction constant at its basal concentration. For example, when the IP3-dependent IP3R activation reaction is deleted (Fig. 4B), the IP3Rs are exposed to IP3 at the basal concentration, whereas the IP3-dependent reactions (degradation by IP3 3-kinase and 5-phosphatase) react with variable IP3 concentration.

Pathway deletion analysis. PF and CF inputs are given at 0 and 100 ms, respectively. Pathway deletion was started at the CF input. When a pathway in which molecule A (downstream) is dependent on molecule B (upstream) in Equation 1 was deleted, the concentration of B was fixed at the baseline in Equation 2, and changes in molecules A and AB were calculated. If the upstream molecules were involved in multiple reactions (i.e., Ca2+), we maintained the molecular concentration constant only in the deleted reaction, and the molecular concentrations in the other reactions varied as usual. A, Illustration of the specific pathways deleted in the diagrams below. B-F, The black and gray lines indicate time course of [Ca2+]i in the deleted pathway and under control conditions (identical to Fig. 3A, blue), respectively. B, Deletion of the IP3-dependent IP3R activation pathway. C, Deletion of the [Ca2+]i-dependent IP3R activation pathway. D, Deletion of the [Ca2+]i-dependent PLCβ activation pathway. E, Deletion of the [Ca2+]i-dependent IP3R inactivation pathway. F, [Ca2+]ER is held constant at the baseline concentration.
The first reaction we deleted was IP3 binding to IP3Rs. We prevented IP3R activation from increasing IP3. There was no supralinear Ca2+ response at all (Fig. 4B), indicating that supralinear Ca2+ signals require IP3 elevation. When IP3R activation was deleted by fixing the Ca2+ concentration for the IP3R activation alone, the supralinear Ca2+ response was completely eliminated (Fig. 4C), whereas deletion of the pathway of PLCβ activation by Ca2+ did not eliminate the supralinear Ca2+ response (Fig. 4D). These results indicate that the supralinear Ca2+ response to conjunctive PF-CF inputs is a regenerative process driven by the positive feedback loop in which Ca2+ induces Ca2+ release through the IP3Rs.
Deletion of the IP3R inactivation reaction dramatically prolonged and increased the [Ca2+]i elevation (Fig. 4E). Finally, we clamped [Ca2+] in the ER ([Ca2+]ER) at 150 μm, the basal concentration. By maintaining the [Ca2+]ER constant, we prevented the gain and loss of [Ca2+]ER attributable to Ca2+ release through the IP3Rs, Ca2+ uptake by Ca2+ pumps, and so on. The constant [Ca2+]ER did not significantly alter the time course of changes in [Ca2+]i (Fig. 4F). Thus, Ca2+-dependent IP3R inactivation, not Ca2+ depletion in the ER, is essential and solely responsible for terminating the Ca2+-induced Ca2+ release.
PF-CF time window of the Ca2+ response is controlled by the changes in IP3 concentration over time
To explore the molecular mechanisms responsible for the detection of spike timing, conjunctive PF-CF inputs were applied at various intervals between the PF input and the CF input, as shown in Figure 5A. The Ca2+ response reached at least 5 μm when the CF input followed PF input within intervals of 0-300 ms (Fig. 5A). Application of PF-CF inputs in the reverse order did not evoke regenerative Ca2+ release. The time course of IP3 concentrations did not change much at different PF-CF intervals, and it was always time-locked to the PF input (Fig. 5B).

Regenerative Ca2+ release dependence on the timing of PF-CF inputs. A, Ca2+ responses to conjunctive PF-CF inputs with various intervals between the PF input and CF input. The PF input is delivered at 0 ms, indicated by the five repetitive lines. CF input is delivered at -200 to +400 ms, as indicated by the single line. B, Overplot of IP3 time courses in response to the various PF-CF inputs.
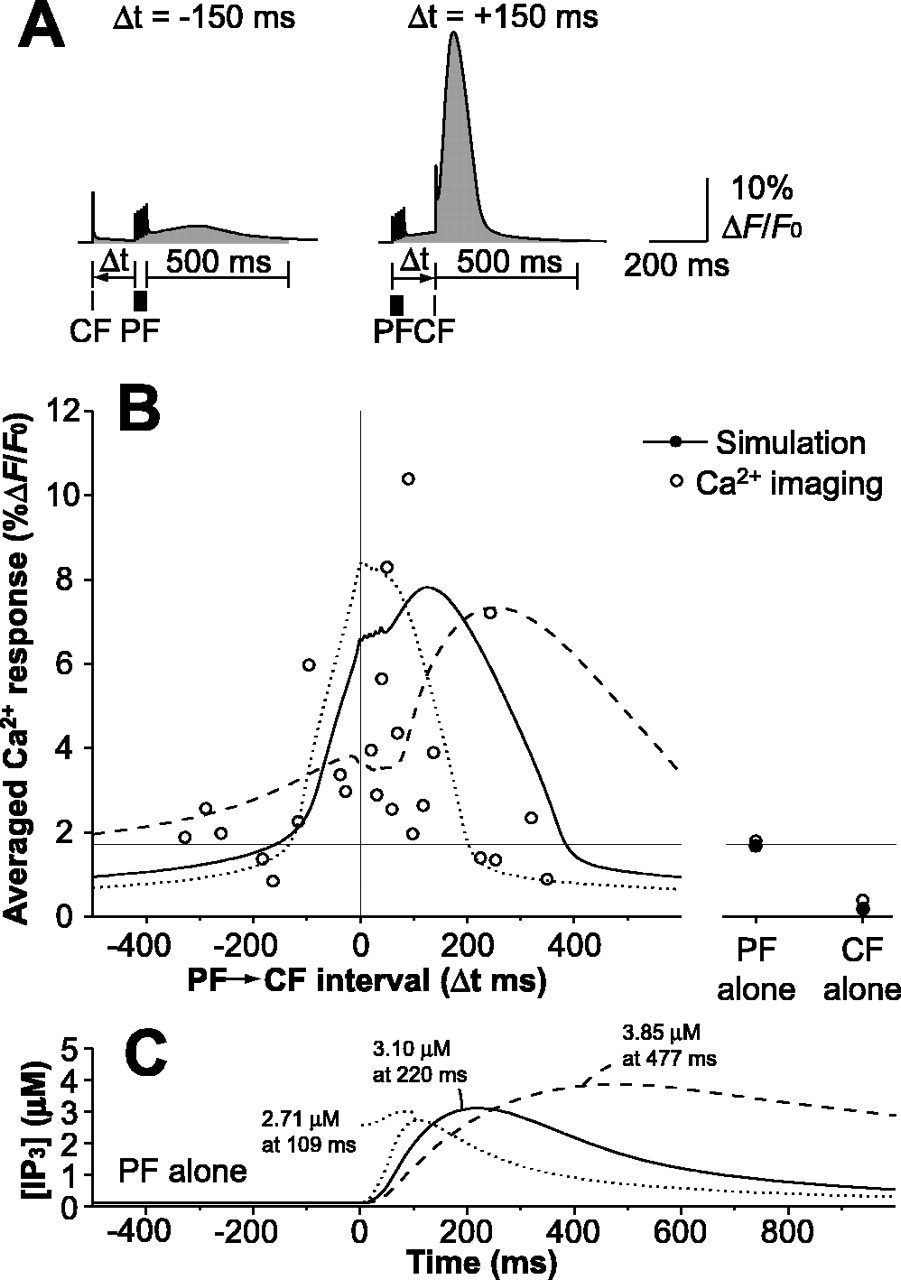
To evaluate the timing-dependent Ca2+ responses as a function of the PF-CF time interval quantitatively, the time-window function of the Ca2+ response was defined as the time-integrated ΔF/F0 from the first input to 500 ms after the last input (compare Fig. 6A) (see Materials and Methods), as per the method used to analyze results of Ca2+ imaging (Wang et al., 2000). The time window function is plotted as a solid curve in Figure 6B.

Time window of the Ca2+ response controlled by the IP3 time course. A, Examples of the time-integral interval of the Ca2+ response to PF-CF inputs. The PF-CF interval, Δt, is defined as the time between the start of the PF input to the start of the CF input. Ca2+ response is defined as the average increase in fluorescence (ΔF/F0) from the first stimulus to 500 ms after the final stimulus. The Ca2+ indicator is Magnesium Green 1 (Kd = 19 μm; Fmax/Fmin = 2). B, Time window of Ca2+ response as a function of the PF-CF interval, controlled by the IP3 time course. Ca2+ responses to the PF or CF input alone in the simulation and the Ca2+ imaging results are plotted on the right as closed and open circles, respectively. The simulated time window (solid line) is compared with the Ca2+ imaging data (open circles) (Wang et al., 2000). The dotted and broken lines indicate time windows when IP3 peak time (C) in response to the PF input alone was shifted to earlier and to later times by modifying enzymatic parameters.
The time-window function was large between 0 and 300 ms, and Gaussian fitting to the time window yielded a peak time of 114 ms and half-width of 170 ms, consistent with the results of the Ca2+ imaging experiments (peak time, 92 ms; half-width, 212 ms) (Wang et al., 2000). A very similar time window was obtained when we used [Ca2+]i instead of ΔF/F0 as a measure of the Ca2+ response (data not shown). Thus, it can be concluded that the supralinear Ca2+ response is not attributable to a saturating effect of the fluorescent indicator. Ca2+ influx attributable to PF and CF activation outside the above effective time window did not trigger major Ca2+ release from the ER.
Temporal similarity was found between the slow IP3 response and the time-window function (Fig. 6B,C, compare solid curves), suggesting that the IP3 time course accounts for spike timing detection. To systematically verify that the IP3 time course actually does determine the time window of the Ca2+ response, we intentionally manipulated the IP3 time course by varying two-parameter values in the model as described below and then plotted the time windows. The GTPase activation protein (GAP) activity of PLCβ promotes Gq inactivation, and the maximum enzyme velocity of GAP was increased five-fold to shift the IP3 peak time to an earlier time. At the same time, the maximum velocity of enzyme catalysis of IP3 production by PLCβ with Ca2+ and Gq was increased 3.5-fold to maintain the peak amplitude of the time window of Ca2+ responses. As a result, the time window narrowed and shifted to an earlier time (Fig. 6B,C, dotted lines). To shift the IP3 peak to a later time, on the other hand, the maximum enzyme velocities of GAP and IP3 production were decreased 0.2- and 0.5-fold, respectively, and as a result, the time window expanded and shifted to a later time (Fig. 6B,C, broken lines). Thus, the time-window function of the Ca2+ response depended on the IP3 time course.
Cerebellar Purkinje cells contain high concentrations of high affinity buffers, such as calbindin and parvalbumin (Fierro and Llano, 1996; Maeda et al., 1999). These buffers hinder increases in [Ca2+]i at <1 μm [Ca2+]i but saturate at >1 μm [Ca2+]i. We explored the effect of eliminating the high-affinity buffers on the time window of the Ca2+ response. In the absence of calbindin, PF or CF input produces a large Ca2+ increase to ∼5 μm (Fig. 7A). The time window of the Ca2+ response had two peaks, a time difference between the PF and CF inputs of one ∼0 ms and the other ∼500 ms (Fig. 7B). The first peak indicates that calbindin prevents only the Ca2+ influx in response to conjunctive PF-CF inputs from producing a regenerative increase in Ca2+. The second peak appeared because the IP3 elevation persisted and the inactivation of IP3R recovered at 500 ms. Elimination of parvalbumin, the other high-affinity buffer in the simulation, did not have any significant effect on the Ca2+ responses (Fig. 7B). We therefore concluded that calbindin is essential for timing detection.

Ca2+ buffers contribute to shaping the time window of Ca2+ response. A,Ca2+ responses to conjunctive PF-CF inputs with various timings, identical to Figure 5A, except for in the absence of the high-affinity Ca2+ buffer calbindin. B, The time window of the Ca2+ response without calbindin and/or paravalbumin.
Regenerative Ca2+ release as a threshold phenomenon regulated by [IP3]
Qualitatively different Ca2+ dynamics at different IP3 levels were systematically analyzed and visualized while simplifying the simulated PF input as a step-function elevation in IP3 (Fig. 8A), because the IP3 response to the PF input is much slower than the Ca2+ response (Fig. 5B). We analyzed Ca2+ changes in response to three different constant IP3 levels: 0.1 μm (actually no change), 2.5 μm, and 10 μm (Fig. 8A). The first IP3 level, 0.1 μm, is identical to the baseline condition. The second IP3 level, 2.5 μm, corresponds to the IP3 concentration 100 ms after the PF input (Fig. 3B), and the third level, 10 μm, is excessively high and was obtained by IP3 uncaging (Khodakhah and Ogden, 1995; Finch and Augustine, 1998). From the baseline concentration of 0.1 μm, [IP3] was changed to one of the three levels in a step function and held constant (Fig. 8A). Synchronized with this IP3 step-up, an influx of a different amount of Ca2+ was delivered for 2 ms (Fig. 8B), the same duration as the simulated CF input. The time courses of [Ca2+]i and IP3R inactivation are shown in Figure 8, C and D, respectively, and they are also plotted as trajectories on phase planes in Figure 8E. The different amounts of Ca2+ influx are color-coded in Figure 8B, and their responses are correspondingly color-coded in Figure 8C-E.
At 0.1 μm IP3, [Ca2+]i monotonically decreased after the Ca2+ influx (Fig. 8C,E, left), and larger Ca2+ influxes produced higher Ca2+ peaks and stronger IP3R inactivation (Fig. 8C,D, left). The trajectories were evenly distributed spatially in the phase plane (Fig. 8E, left), indicating almost linear responses to Ca2+ influx.
At 2.5 μm IP3, [Ca2+]i monotonically decreased after the influx when the Ca2+ transients at the end of the Ca2+ influx were ≤2 μm, whereas when they were larger than 3 μm, [Ca2+]i dropped very briefly and then increased back to >10 μm (Fig. 8C, middle inset). Thus, Ca2+ dynamics can be classified into suprathreshold responses and subthreshold responses bounded by a threshold of 2-3 μm Ca2+ transient. The trajectories around this threshold were very sparsely spaced (Fig. 8E, middle, compare the light and dark blue trajectories), which also confirms the nonlinear threshold phenomenon.
At 10 μm IP3, [Ca2+]i increased to >15 μm without any Ca2+ influx (Fig. 8C, right, black line), indicating that the baseline [Ca2+]i was already high enough to induce regenerative Ca2+ release in the presence of high IP3. There was a latency of 50 ms in the Ca2+ response in the absence of a Ca2+ influx (Fig. 8C, right, black line), indicating that the positive feedback loop of regenerative Ca2+ release requires a relatively long build-up time to be fully activated at low [Ca2+]i. A larger Ca2+ influx elevated the [Ca2+]i peak and reduced this latency (Fig. 8C, right, compare the latency of different lines), which is consistent with the IP3-induced Ca2+ increase in experimental studies (Khodakhah and Ogden, 1995; Finch and Augustine, 1998).
Figure 8F is a color-coded contour map of the averaged Ca2+ response over 500 ms as a function of the transient Ca2+ peaks (see initial peaks in Fig. 8C, middle inset) along the ordinate and the constant IP3 level along the abscissa. First, the averaged Ca2+ response increased with the size of the transient Ca2+ peak and the concentration of IP3. However, the Ca2+ dynamics were qualitatively different for small, medium, and large IP3, as already described in Figure 8A-E. At 0.1 μm IP3, the contour lines were nearly horizontal, indicating that the average Ca2+ response was mainly determined by the amount of Ca2+ influx. At 10 μm IP3, the contour lines were nearly vertical, indicating that the average Ca2+ response was mainly determined by the IP3 level. The contour lines have negative diagonal slopes only in the 1-4 μm IP3 region, indicating that both the Ca2+ influx and [IP3] significantly influence the average Ca2+ response. Moreover, the contour lines were densely packed in this region alone, indicating the threshold for a large Ca2+ release.
Robustness of the response of the spike timing detection mechanism to values of unknown parameters
The dependence of the supralinear Ca2+ response on the timing of PF-CF inputs is attributable to the delay between the PF input and the IP3 peak (Fig. 6B,C). We explored the relationships between the robustness of the IP3 time course in response to the PF input alone and against variations in each of the parameter values. The value for each parameter was varied from 1/100- to 100-fold the standard value with the value for all other parameters constant. The results of the sensitivity analysis of the IP3 time course in relation to each parameter are shown in supplemental Figure 2A-E (available at www.jneurosci.org as supplemental material). Although the IP3 time course was robust to the variations in the values of most of the parameters, the IP3 peak time was greatly affected by some parameters for maximum enzyme velocities (Vmax): Gq activation by Glu-mGluR (parameter ID in supplemental material: a5; available at www.jneurosci.org), IP3 production by PLCβ without Gq (b6) and with Gq (b7), GAP activity of PLCβ (b10, b11, b12), and IP3 degradation by IP3 3-kinase (c3). The values of only three of these critical parameters (a5, b6, and c3) were unknown. Parameter a5 was chosen so that the mGluR pathway produces 10 μm IP3 at 16 PF pulses, based on Ca2+ response to uncaging IP3 (Finch and Augustine, 1998). Parameters b6 and c3 were chosen to maintain the basal [IP3] level at 0.1 μm. Figure 9 shows time courses of IP3 concentrations in relation to differences in the values (1/10- to 10-fold) of the three unknown parameters. Gq activation by Glu-mGluR (a5) had a major effect on the height of the peak of IP3 concentration but not on the time of the peak (Fig. 9A). When we applied large Vmax (10-fold the control) of IP3 production by PLCβ in the absence of Gq (b6), we obtained a prolonged IP3 response (Fig. 9B). IP3 degradation by IP3 3-kinase (c3) affected both the peak amplitude and the time of the peak (Fig. 9C). A larger Vmax of IP3 degradation by IP3 3-kinase decreased the peak amplitude and shifted the peak to an earlier time.

Sensitivity of the IP3 time course to variations in parameter values. Three unknown maximum enzyme velocities that affect the IP3 time course are shown as representative examples. The parameters were varied within the 1/10- to 10-fold range. A, Gq activation by Glu-mGluR complex. B, IP3 production by PLCβ without Gq. C, IP3 degradation by IP3 3-kinase.
Next, we examined the robustness of the time window of PF-CF inputs and the time course of the concentration of the changes in IP3. Each parameter was varied from 1/100- to 100-fold of its standard value with all other parameters constant, and the behavior of the model was quantified in terms of the peak time, half-width, and peak amplitude of the temporal window after Gaussian fitting (supplemental Fig. 2F,G; available at www.jneurosci.org as supplemental material). The results of the sensitivity analysis of the time window for each parameter are shown in supplemental Figure 2H-K (available at www.jneurosci.org as supplemental material). The parameters in the model were classified into four categories: time constants, dissociation and Michaelis constants, maximum enzyme velocities, and initial concentrations. Figure 10 shows graphs of the average changes and SDs of the peak time (left column), half-width (middle column), and peak amplitude (right column) when the values were varied as indicated along the abscissa of these four classes of parameters. Similar tendencies were shown between parameters with values that are known (black) and unknown (gray). The three characteristics of the temporal window changed little in response to small differences in the parameters (one-half or two times). Most importantly, even major changes in parameters (1/100-100 times) had little effect on the peak time and half-width, although peak amplitudes sometimes changed considerably. Because spike-timing detection is essentially characterized by the shape of the temporal window (i.e., the peak time and half-width), we concluded that the proposed model is very robust in its most important characteristic (i.e., spike-timing detection for a large range of parameter variations).

Percentage of changes in the three characteristic quantities of the time window induced by changes in parameter values. All parameters were classified as time constants (first row), dissociation and Michaelis constants (second row), maximum enzyme velocities (third row), and initial concentrations (fourth row). Each parameter was varied within a range of 1/100- to 100-fold with other parameters maintained constant. The time window was simulated for this set of parameters and was fitted by a Gaussian function. The percentage of changes in the peak time (left), half-width (middle), and peak amplitude (right) of the Gaussian function compared with those of the original time window in Figure 6 B were computed and then averaged over parameters within the four categories. These averaged changes in the characteristic quantities were plotted as a function of the magnification (minification) factor of the changed parameter. The known and unknown parameters are marked in black and gray, respectively. The bars represent ±SD. The asterisks in some figures mean that one or two of the computations could not be completed because of numerical explosions.
Discussion
Because many signal transduction pathways interact with each other and often exhibit nonlinear dynamics, it would be difficult to understand complex cellular information processing on the basis of experiments alone. Computational kinetic simulation may make it possible to determine whether known signaling pathways are sufficient to reproduce cellular events of interest and make it possible to fully understand the mechanisms of the information processing performed by the molecular dynamic networks. In this study, we modeled Ca2+ dynamics within a single spine to elucidate the actual mechanism of spike-timing detection. Supralinear Ca2+ responses were generated by Ca2+-dependent IP3R activation during IP3 elevation, and the PF-CF time window was determined from the time course of changes in IP3 concentrations. PF-mediated IP3 elevation lowered the Ca2+ threshold, and CF-mediated Ca2+ influx triggered Ca2+ release through the IP3Rs. Three Ca2+ responses exhibit different dynamics at low, medium, and high IP3 concentrations.
IP3 regulation of Ca2+-induced Ca2+ release and the PF-CF time window
In Figure 11A, the IP3-dependent Ca2+ threshold indicates the Ca2+ input required for IP3 concentration at the time, so that averaged Ca2+ response in the 500 ms after the CF input is >3.16 μm (Fig. 8F, bold line between the blue area and red area), dependent on IP3 at this time (Fig. 5B). The Ca2+ threshold represents the size of the Ca2+ increase required for a large Ca2+ response, if the CF input is applied at the time. The IP3-dependent Ca2+ threshold explains the optimal timing of the PF input for the regenerative Ca2+ response. CF input within 300 ms after PF input induces a Ca2+ transient and causes the Ca2+ response to reach the threshold (Fig. 11A, black line). In contrast, when the CF input occurs before the PF input (Fig. 11A, thick gray line) or occurs too late after the PF input (Fig. 11A, dotted gray line), the CF-mediated Ca2+ influx does not increase Ca2+ concentrations enough to reach the threshold.

Schematic model of PF-CF timing detection based on changes in the Ca2+ threshold over time. A, Ca2+ time courses with PF-CF input intervals of -100 ms (thick gray line), +200 ms (black line), and +500 ms (dotted gray line). The threshold indicates the averaged Ca2+ response of 3.16 μm (Fig. 8 F) and was computed from the IP3 time course with the PF input alone (Fig. 3B, green). If the transient Ca2+ response to the CF input exceeds the Ca2+ threshold, regenerative Ca2+ release is triggered, and a supralinear Ca2+ response appears. B, The Δ in the mGluR pathway indicates a time delay between PF input and IP3 accumulation. Ca2+ release is both activated and inactivated by the Ca2+ increase. In the presence of sufficient IP3, Ca2+ influx triggers regenerative Ca2+ release by the fast positive feedback loop of Ca2+-dependent IP3R activation. After the Ca2+ increase, the slow negative feedback loop terminates Ca2+ release.
Regenerative Ca2+-induced Ca2+ release via IP3Rs accounts for the supralinear Ca2+ signals. First, Ca2+-induced Ca2+ release was initiated by CF-mediated Ca2+ entry in the presence of increased IP3, then accelerated by the positive feedback loop of Ca2+-dependent IP3R activation, and finally terminated by the negative feedback loop of Ca2+-dependent IP3R inactivation (Fig. 11 B).
The results of the sensitivity analysis (Figs. 9, 10) (supplemental Fig. 2, available at www.jneurosci.org as supplemental material) reliably support the notion that the spike-timing detection mechanism is not dependent on parameter values but on the model structure, specifically on the difference in time scale between a rapid electrical reaction (Ca2+ influx by depolarization) and a slow biochemical reaction (IP3 production by the metabotropic pathway). However, it should be pointed out that although the results of our simulation support our hypothesis, they do not exclude possibilities of other functions of the pathways or additional pathways.
The temporal relationship between the coincidence of the PF and CF inputs must be detected at some point of intersection between the two signal transduction pathways downstream to the PF and CF inputs, because we found only one possible intersection point in the MAP kinase cascade in addition to the IP3Rs cascade in an LTD signaling model we previously proposed (Kuroda et al., 2001). CF input stimulates the MAP kinase cascade, whereas PF input activates the nitric oxide (NO)/cGMP pathway, which plays a gating role in allowing activation of the MAP kinase cascade. However, because activation of the NO/cGMP pathway is too slow (order of minutes) to detect subsecond timing (Hartell et al., 2001), IP3Rs and the upstream pathways must detect the timing of the PF and CF inputs. Wang et al. (2000) have proposed that IP3Rs themselves may detect the temporal order of the changes in IP3 and Ca2+. IP3Rs may be inactivated by the CF-mediated Ca2+ influx before the PF-mediated IP3 elevation, because IP3-evoked Ca2+ release is inhibited by preincubation with Ca2+ (Khodakhah and Ogden, 1995; Adkins and Taylor, 1999) and thus can only be activated by the PF-CF order. However, the Ca2+ response to the CF input was much weaker in our simulation (Fig. 3A, red) than the strong Ca2+ stimulation in their experiments (10 or 100 μm for ∼1 s). Thus, this first possibility is unlikely to account for the detection of the timing. Instead, the kinetics of IP3 binding to IP3Rs may be slow and result in the necessary time difference, and this seemed to be experimentally supported by a latency of ∼50 ms in IP3-evoked Ca2+ release (Khodakhah and Ogden, 1995; Marchant and Taylor, 1997). However, a similar latency was obtained in our simulation (Fig. 8C, right, black) with the fast IP3 binding in our IP3R kinetic model, and thus these experimental data cannot discriminate between the two mechanisms of detecting the timing.
Clear discrimination between the two possibilities is possible by measurement of the Ca2+ response to flash photolysis of caged IP3 and caged Ca2+. The caged compounds have different optimal wavelengths for uncaging that enable the concentrations of IP3 and Ca2+ to be controlled independently. We predict that IP3 uncaging will yield a delayed Ca2+ increase (Fig. 8C, right, black), whereas Ca2+ uncaging will yield an immediate and transient Ca2+ increase (Fig. 8C, left). Conjunctive Ca2+-IP3 uncaging should induce a supralinear Ca2+ response that is larger than the sum of the response to uncaging of Ca2+ alone and uncaging of IP3 alone. The largest Ca2+ response would be expected in coincidental IP3-Ca2+ conjunctive uncaging, unlike conjunctive PF-CF stimulation, because, unlike the metabotropic pathway, IP3 uncaging elevates [IP3] without any delay. If delayed Ca2+ photolysis after IP3 photolysis is found to be optimal, our model will be refuted.
Various LTD forms unified within a single model of Ca2+ dynamics
We previously modeled the signaling pathways involved in LTD induction, including the NO/cGMP pathway, MAP kinase cascade, protein kinase C activation, and AMPAR phosphorylation, which were not incorporated in the current study, and found that a supralinear Ca2+ increase induced by conjunctive PF and CF inputs is required for induction of LTD (Kuroda et al., 2001). However, the Ca2+ increase in the previous model was based on experimental observations (Wang et al., 2000) and was not modeled in a kinetic simulation. Thus, the previous and current models complement each other and could be regarded as downstream and upstream models of the entire LTD signaling transduction. The previous downstream model (Kuroda et al., 2001) computed AMPAR phosphorylation dependent on Ca2+ increase as one of the major inputs, whereas the current upstream model reproduced the Ca2+ increase with PF and CF inputs. Therefore, although we only modeled the Ca2+ dynamics in this study, the current model is useful for elucidating the critical role of Ca2+ dynamics in different forms of LTD as described below.
The various Ca2+ dynamics dependent on IP3 are capable of coherently explaining various forms of LTD. We conceptually illustrated six regions of different dynamics in Figure 8F. First, region (i) at the baseline IP3 shows that CF input alone yields a small Ca2+ transient (∼2 μm [Ca2+]i) that does not enable the averaged Ca2+ response to reach the Ca2+ threshold. Region (i) also shows that LTD is eliminated when IP3 production via the metabotropic pathway is inhibited. Mice lacking mGluR1 exhibit impaired LTD induction and motor learning (Aiba et al., 1994; Conquet et al., 1994). Second, region (ii) illustrates that PF input alone yields a Ca2+ influx of ∼1 μm and a subsequent IP3 increase. The elongated region (ii) represents the transition of Ca2 dynamics after PF input, starting at the left side. As IP3 is increased by the PF input, the Ca2+ dynamics move to the right portion of region (ii). Ultimately, the Ca2+ dynamics in region (ii) never reach the threshold. Third, the horizontal region (iii) illustrates the dependency of Ca2+ dynamics on the timing of conjunctive PF-CF inputs. IP3 maximally increased to 3 μm and then decreased to the baseline after PF input (Fig. 3B). Region (iii) represents these different IP3 at different times with respect to the PF input, whereas the CF input induces a transient Ca2+ peak at the same level (Fig. 5A). If the CF input is applied during IP3 elevation [dynamics jump from the right side of region (ii) to the red part of region (iii)], as when there is a delay of 0-300 ms in Figure 5A, the transient Ca2+ peak crosses the threshold and induces LTD. If the CF input and IP3 elevation do not coincide, the transient Ca2+ peaks are insufficient to reach the threshold [dynamics jump from the left of region (ii) to the blue part of region (iii)]. Thus, conjunctive PF-CF inputs can induce LTD only within the appropriate time window where PF-induced IP3 elevation provides a low Ca2+ threshold. Fourth, region (iv) shows that LTD induction can be induced only by application of a large Ca2+ elevation in the spine, even without IP3 elevation. This is consistent with the observation that repetitive Ca2+ uncaging rescues the induction of LTD in Purkinje cells, the dendritic spines of which lack Ca2+ stores (Miyata et al., 2000). Fifth, region (v) may explain the finding that IP3 uncaging induces Ca2+ release and LTD without CF activation or depolarization (Khodakhah and Ogden, 1995; Finch and Augustine, 1998). Sixth, and finally, region (vi) indicates that massive PF-bundle stimulation is capable of providing large Ca2+ transients that induce LTD without CF input (Hartell, 1996; Wang et al., 2000). Although IP3 elevation contributes the Ca2+ transients, the Ca2+ influx is large enough to allow the Ca2+ response to reach the threshold.
The Ca2+ dynamics model and cerebellar learning theories
As stated in Introduction, according to cerebellar learning theories (Ito, 1970; Kawato, 1999; Yamamoto et al., 2002), LTD must be induced when PF inputs precede CF inputs. Different groups have used many different experimental paradigms and have reported a variety of time windows for LTD induction (Ekerot and Kano, 1989; Karachot et al., 1994; Chen and Thompson, 1995; Yamamoto et al., 2002). Furthermore, cerebellar motor learning theories cannot easily explain the fact that LTD induction does not necessarily require CF inputs. The IP3-dependent Ca2+ threshold suggests that strong PF input alone triggers regenerative Ca2+ release [Fig. 8F, region (vi)]. LTD has been experimentally induced by strong PF activation without CF activation (Hartell, 1996), but this type of LTD apparently does not occur in natural response to stimuli or contribute to cerebellar learning. However, De Schutter (1995) has proposed that LTD induced by PF activation alone plays a role in normalizing the strength of the PF-mediated AMPAR pathway. If PF activation alone is strong enough to induce LTD, the AMPAR pathway is weakened until the Ca2+ response reaches the Ca2+ threshold. This type of LTD may function as a pretuning process for effective cerebellar learning.
In conclusion, kinetic simulation has allowed us to understand IP3-dependent Ca2+ dynamics, which are capable of coherently explaining various forms of LTD. Because the IP3-dependent Ca2+ threshold, the necessity of PF-CF conjunction, and the PF-CF time delay were reproduced only for physiological ranges of synaptic inputs, the results of this study support conjunctive LTD as one of the cellular bases of cerebellar supervised learning (Marr, 1969; Ito, 1970, 2001; Kawato, 1999).
Footnotes
- Received July 8, 2004.
- Revision received December 3, 2004.
- Accepted December 4, 2004.
This work was supported by the Human Frontier Science Program (M.K.) and the National Institute of Information and Communications Technology.
Correspondence should be addressed to Tomokazu Doi, ATR Computational Neuroscience Laboratories, 2-2-2 Hikaridai, Kansai Science City, Kyoto 619-0288, Japan. E-mail: xtomdoi{at}atr.jp.
Copyright © 2005 Society for Neuroscience 0270-6474/05/250950-12$15.00/0