

Article Figures & Data
Figures
- Figure 1.
Effects of acute treatment with the 5-HT2A receptor antagonist MDL 100907 at various doses (abscissa) on amounts of vigilance states in 5-HT2A+/+ (dotted line) and 5-HT2A–/– (solid line) mice. Data (mean ± SEM of 4–8 animals) are expressed as minutes during the first 3 postinjection hours. At the time of injection, there were no significant differences in amounts of vigilance states between 5-HT2A+/+ and 5-HT2A–/– mice. *p < 0.05, significantly different from vehicle (0 on abscissa); post hoc Bonferroni's–Dunn's test. Error bars represent SEM.
- Figure 2.
Amounts of W, NREMS, and REMS across the light/dark cycle in 5-HT2A+/+ (dotted line) and 5-HT2A–/– (solid line) mice. Data (mean ± SEM of 10 animals per group) are expressed as minutes per 3 h during 24 h. The black bar on the abscissa represents the dark period of the light/dark cycle. #p < 0.05, significantly different from 5-HT2A+/+ mice; post hoc Bonferroni's–Dunn's test. Error bars represent SEM.
- Figure 3.
Effects of 6 h of sleep deprivation starting at light onset on delta power, during four consecutive 2 h intervals of the recovery period in 5-HT2A+/+ (dotted line) and 5-HT2A–/– (solid line) mice. Statistical analysis was performed on EEG power values, and data (mean ± SEM of 9 animals in each group) are plotted as a percentage of the paired values obtained under control conditions. *p < 0.05, significantly different from respective control value; post hoc Bonferroni's–Dunn's test. #p < 0.05, significantly different from 5-HT2A+/+ value; post hoc Bonferroni's–Dunn's test. Error bars represent SEM.
- Figure 4.
Effects of acute treatment with the 5-HT2B/2C receptor antagonist SB 206553 (2.5 mg/kg, i.p.; hatched bars) on amounts of vigilance states in 5-HT2A+/+ (white bars) and 5-HT2A–/– (black bars) mice. Data (mean ± SEM of 7 animals per group) are expressed as minutes per hour during each of the first 3 postinjection hours. *p < 0.05, significantly different from paired-saline-treated animals; post hoc Bonferroni's–Dunn's test. Error bars represent SEM.
- Figure 5.
Effects of acute treatment with the 5-HT2C receptor antagonist SB 242084 at various doses (abscissa) on amounts of vigilance states in 5-HT2A+/+ (dotted line) and 5-HT2A–/– (solid line) mice. Data (mean ± SEM of 4–6 animals) are expressed as minutes during the first 3 postinjection hours. *p < 0.05, significantly different from vehicle (0 on abscissa); post hoc Bonferroni's–Dunn's test. Error bars represent SEM.
- Figure 6.
A, B, Effects of acute treatment with the 5-HT2B receptor antagonist SB 215505 (A) or the 5-HT2B receptor agonist BW 723C86 (B) at various doses on amounts of vigilance states in 5-HT2A+/+ (dotted line) and 5-HT2A–/– (solid line) mice. Data (mean ± SEM of 5–11 animals per group) are expressed as minutes during the first postinjection hour. *p < 0.05, significantly different from vehicle (0 on abscissa); #p < 0.05, significantly different from respective 5-HT2A+/+ value; post hoc Bonferroni's–Dunn's test. Error bars represent SEM.
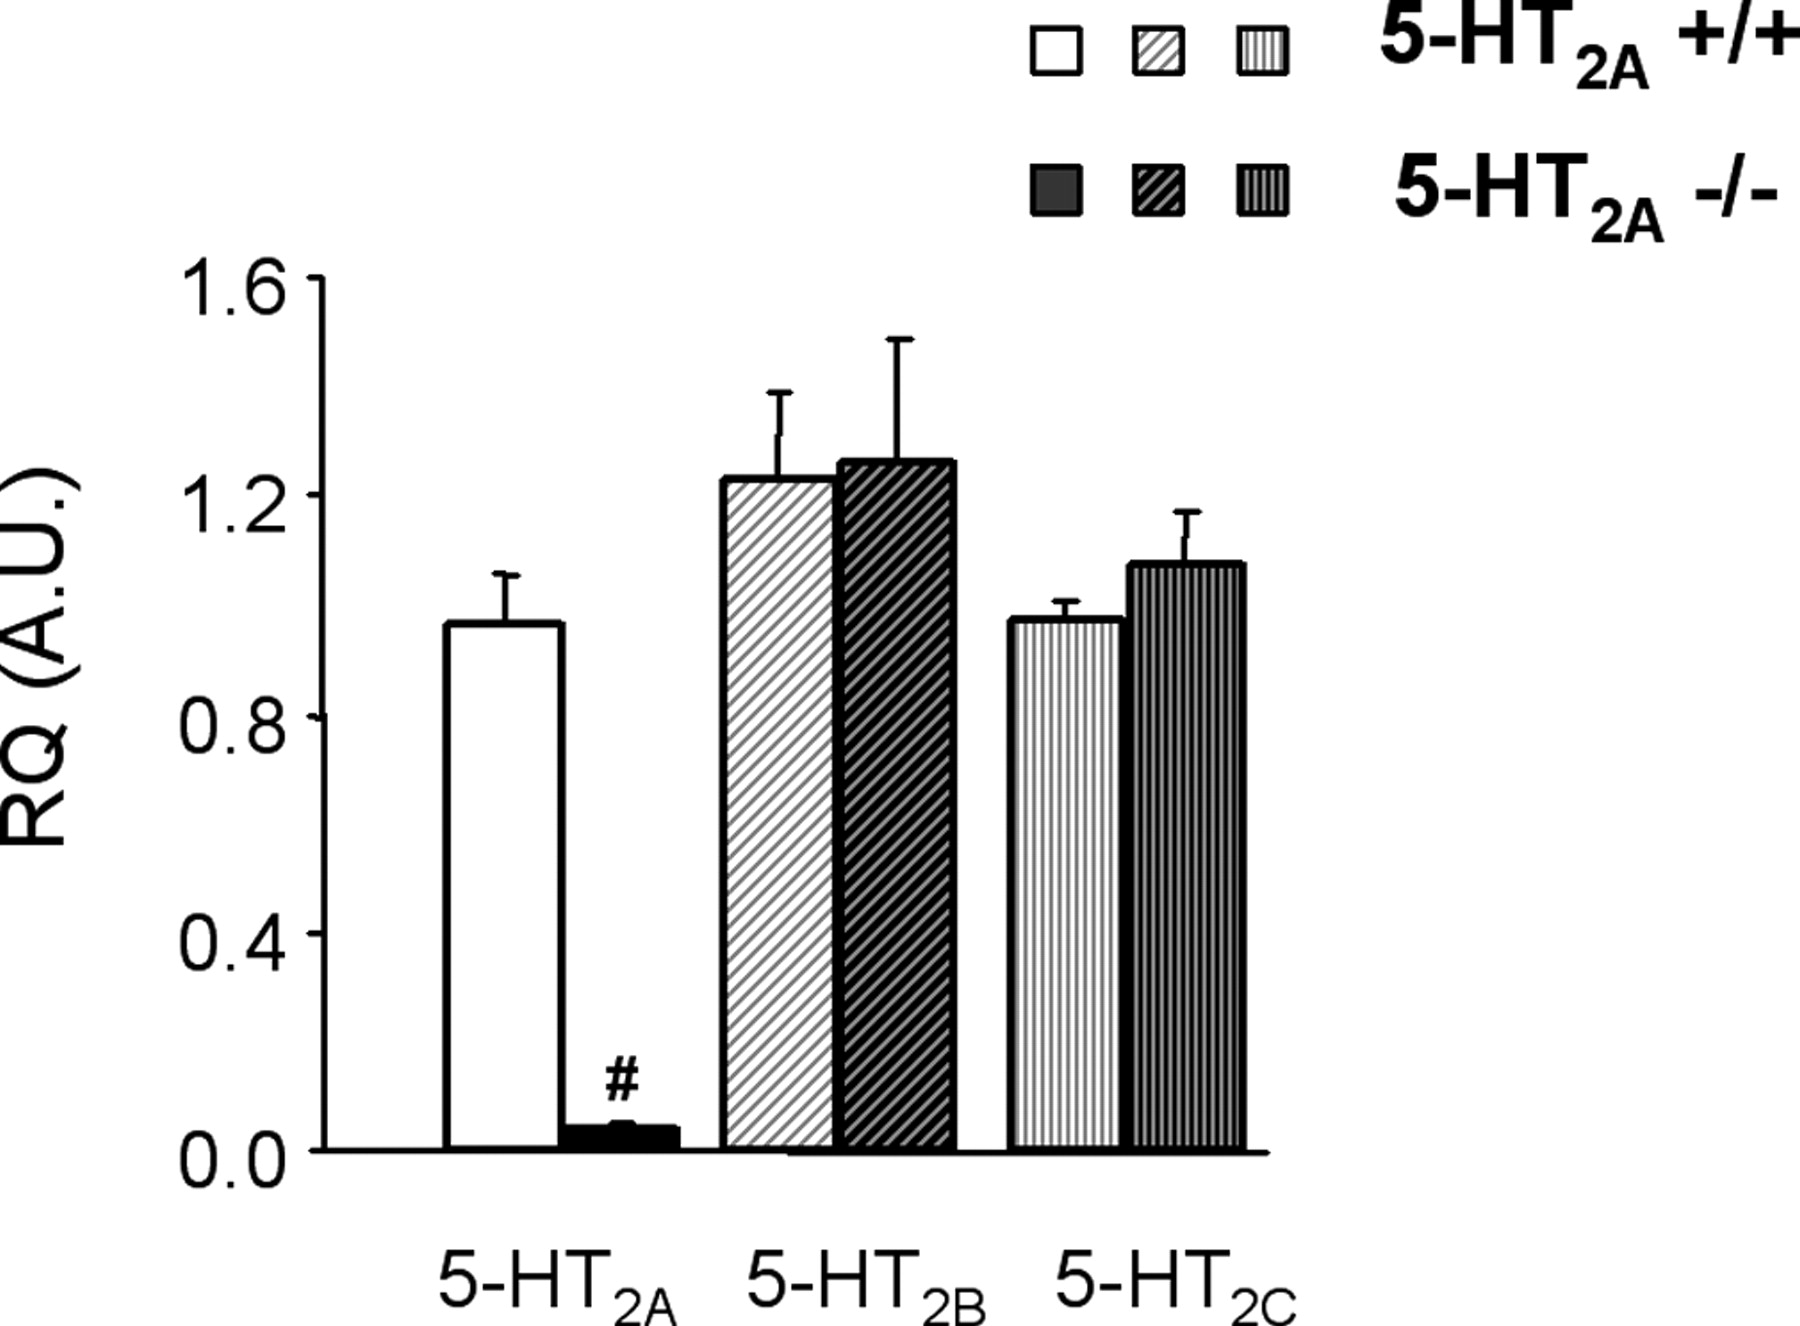
- Figure 7.
5-HT2A, 5-HT2B, and 5-HT2C mRNA expression in the hypothalamus of 5-HT2A+/+ (white bars) and 5-HT2A–/– (black bars) mice. Results [relative quantity (RQ), mean ± SEM of 4 animals in each group] are expressed in arbitrary units (A.U.) after normalization to an endogenous reference gene (HPRT). Normalization with GADPH endogeneous gene (see Materials and Methods) yielded similar results. #p < 0.05, significantly different from respective 5-HT2A+/+ value; unpaired Student's t test. Error bars represent SEM.
- Figure 8.
Implication of 5-HT2A receptors in the dynamics of breathing after sighs. Sighs are followed by both an immediate and a delayed decrease in respiration frequency, and apnea occurs in these two phases of bradypnea. A, Example of plethysmograph recording of a sigh (0 on abscissa). a.u., Arbitrary units. B, Average rate of respiration after a sigh. Dotted lines correspond to ± SD. C, Distribution of apneas after a sigh; the counts of apneas have been normalized to the number of sighs (bin size, 0.5 s). A–C are from the same 5-HT2A+/+ mouse recorded from 10:00 A.M. to 4:00 P.M. D–F, The delayed decrease in breathing frequency after a sigh is almost completely suppressed after 5-HT2A receptor blockade by MDL 100907 in 5-HT2A+/+ mice but is more pronounced in 5-HT2A–/– mutants. D, Average changes in respiration frequency after a sigh in 5-HT2A+/+ during the first 3 h (between 10:00 A.M. and 1:00 P.M.) and during the next 3 h (between 1:00 P.M. and 4:00 P.M.) after MDL 100907 (2 mg/kg, i.p.) administration (n = 7). The rate of breathing is normalized to the rate before the sigh, E, Average changes in spontaneous respiration frequency after a sigh in 5-HT2A+/+ (n=14) and 5-HT2A–/– (n=12) mice. Recordings were made between 10:00 A.M. and 4:00 P.M. #,*p < 0.05, significantly different from vehicle or 5-HT2A+/+ mice, respectively; Student's t test.


Tables
- Table 1.
Respiratory parameters during sleep in mice after invalidation of the gene coding for or pharmacological blockade of 5-HT2A receptors
Respiration rate during REMS Respiration rate during NREMS Sigh index per minute of NREMS Spontaneous apnea index per minute of NREMS Postsigh apnea index per minute of NREMS Baseline conditions 5-HT2A+/+ (10:00 A.M. to 4:00 P.M.) (n = 14) 3.5 ± 0.1 Hz 3.0 ± 0.1 Hz 0.56 ± 0.08 0.13 ± 0.05 0.41 ± 0.10 5-HT2A-/- (10:00 A.M. to 4:00 P.M.) (n = 12) 3.5 ± 0.1 Hz 2.8 ± 0.1 Hz 0.54 ± 0.06 0.13 ± 0.06 0.62 ± 0.14 MDL 100907 (2 mg/kg, i.p.) 5-HT2A+/+ (10:00 A.M. to 1:00 P.M.) (n = 7) 109 ± 16% 124 ± 10% 144 ± 18% 99 ± 53% 26 ± 9%* -
Postsigh apneas were preceded by a sigh within the 10 previous seconds, whereas spontaneous apneas were not preceded by a sigh. 5-HT2A+/+ and 5-HT2A-/- mice exhibited similar respiratory parameters under baseline conditions. In 5-HT2A+/+ mice, acute treatment with the 5-HT2A receptor antagonist MDL 100907 (2 mg/kg, i.p.) reduced the postsigh apnea index. The effects of the drug are shown as percentage of the value after vehicle injection. Data are expressed as mean ± SEM of the number of independent determinations indicated in parentheses. *p < 0.05, significantly different from vehicle; paired Student's t test.
-
Supplemental data
Files in this Data Supplement:
- supplemental material - Graph A: Modulation of the plethysmographic signal by the heart rate during apneas. This figure represents traces from plethysmographic recording (Resp), electrocardiogram (ECG) and heart rate (corresponding to an interpolation of the inverse of the R-R intervals). Ripples in the Resp traces during apneas clearly align with heart beats indicating airways are open.
- supplemental material - Graph B: Average EEG power density for each vigilance state obtained from 48 hours recordings of 9 5-HT2A+/+ and 9 5-HT2A-/- mice (see Methods). No difference between the 2 strains was observed for any vigilance state.


