

Article Figures & Data
Figures
- Figure 1.
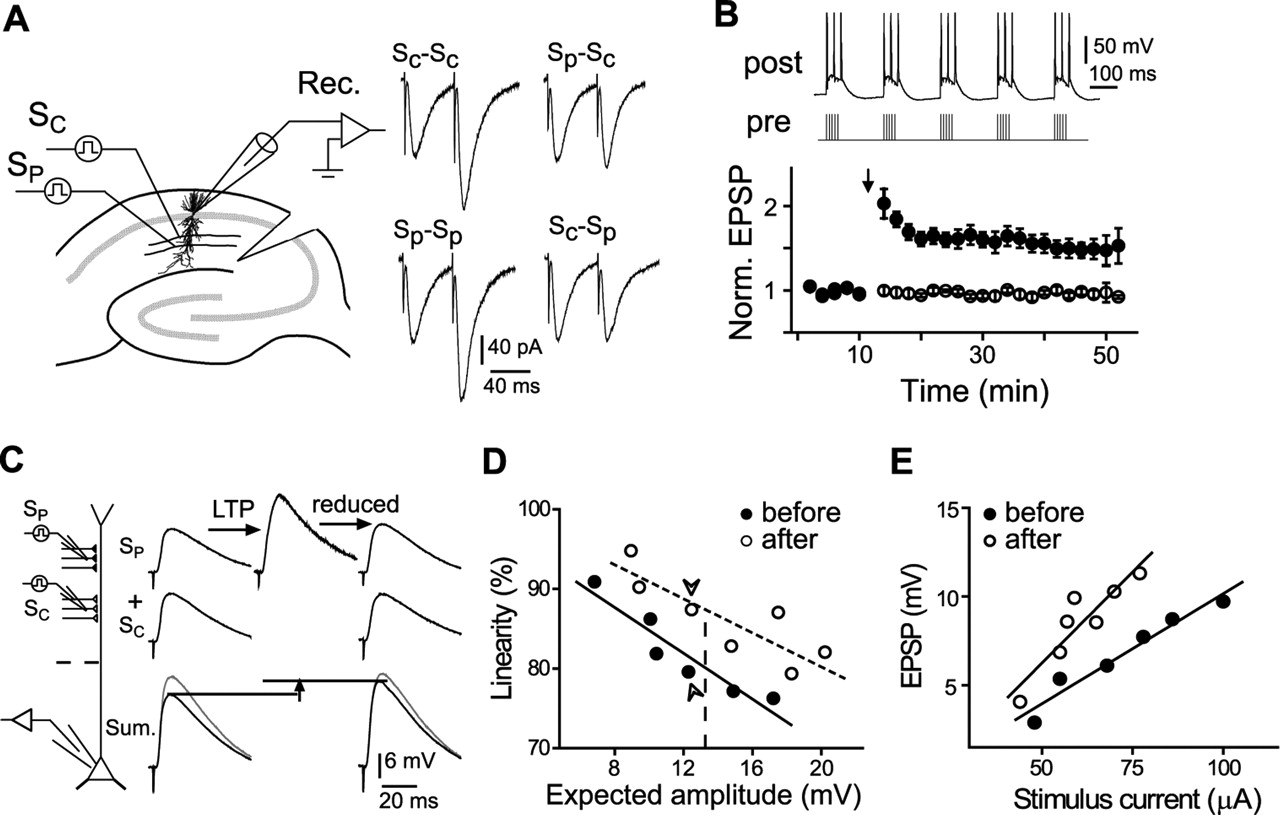
Increased linearity of summation for two distal SC inputs after LTP induction. A, Schematic diagram depicting two independent Schaffer collateral inputs stimulated by extracellular electrodes. One of the inputs was conditioned by pTBS (see Materials and Methods). Sample traces depict EPSCs elicited by sequential stimulation of the same input (Sc-Sc and Sp-Sp) or two inputs (Sp-Sc and Sc-Sp) at an interval of 50 ms, showing the presence of pair-pulsed facilitation at the same input and absence of cross-facilitation between two stimulated pathways. B, Persistent increase in EPSP amplitude (164.5 ± 9.3% of the mean value before induction; n = 9) was induced at the input exposed to pTBS (SP; filled circles) but not at the control input (SC; open circles). Traces above depict pTBS protocol. C, Increased linearity for two synchronous inputs at a distal dendrite. Left, Schematic diagram depicting the location of LTP induction (SP) and an adjacent control input (SC). The dashed line marks 150 μm from the soma. Right, Top traces, Sample EPSPs from SP, showing the increase in amplitude after LTP induction and subsequent adjustment back to the control level. Middle traces, Sample EPSPs from SC, showing no change in amplitude. Bottom traces, Samples of summed EPSPs elicited by synchronous and asynchronous stimulation of SP and SC before and after LTP induction. The linearity of summation was defined as the ratio (in percentage) of measured amplitude of summed EPSPs (dark traces) to the expected amplitude (arithmetical sum; gray traces) calculated from two individual EPSPs. D, Linearity versus expected amplitude of summed EPSPs from one experiment before (filled circles) and after (open circles) LTP induction. Arrowheads mark the data shown in C. E, Typical case in which EPSP amplitude was varied by adjusting the stimulus intensity. Synaptic potentiation was indicated by leftward shift of the stimulus intensity–EPSP amplitude curve. Lines represent the best linear fit. Rec., Recording pipette; Norm., normalized; post, postsynaptic; pre, presynaptic.
- Figure 2.
Temporal selectivity of pTBS-induced increase in the linearity of summation of two distal SC inputs. A, Summation linearity before and after LTP was induced at a distal input, with SP distal to SC (distal 1; see schematic diagram on the left). Top traces depict samples of summed EPSPs for two consecutive EPSPs at different intervals. Data below show the linearity (as in Fig. 1D,E) before and after LTP induction, with values estimated at the voltage point of 13 mV of the amplitude of the expected summation (Fig. 1D, dashed line) for all cells. Data from the same cell are connected by a line. Error bars indicate SEM. Negative intervals denote SC preceding SP. B, Similar to A except that SP is proximal to SC (distal 2). Data with a significant increase are marked (*p < 0.05; **p < 0.01).
- Figure 3.
Temporal selectivity of pTBS-induced increase in the linearity of summation of two proximal SC inputs. A, Summation linearity for two proximal inputs before and after LTP induction at one of the inputs, with SP proximal to SC (proximal 1; schematic diagram on left). Top traces depict samples of summed EPSPs for two consecutive EPSPs at different intervals. Data below show the linearity before and after LTP induction (as in Fig. 2A). Error bars indicate SEM. Negative intervals denote SC preceding SP. B, Similar to A except that SP is distal to SC (proximal 2). Data with significant increase are marked (*p < 0.05; **p < 0.01).
- Figure 4.
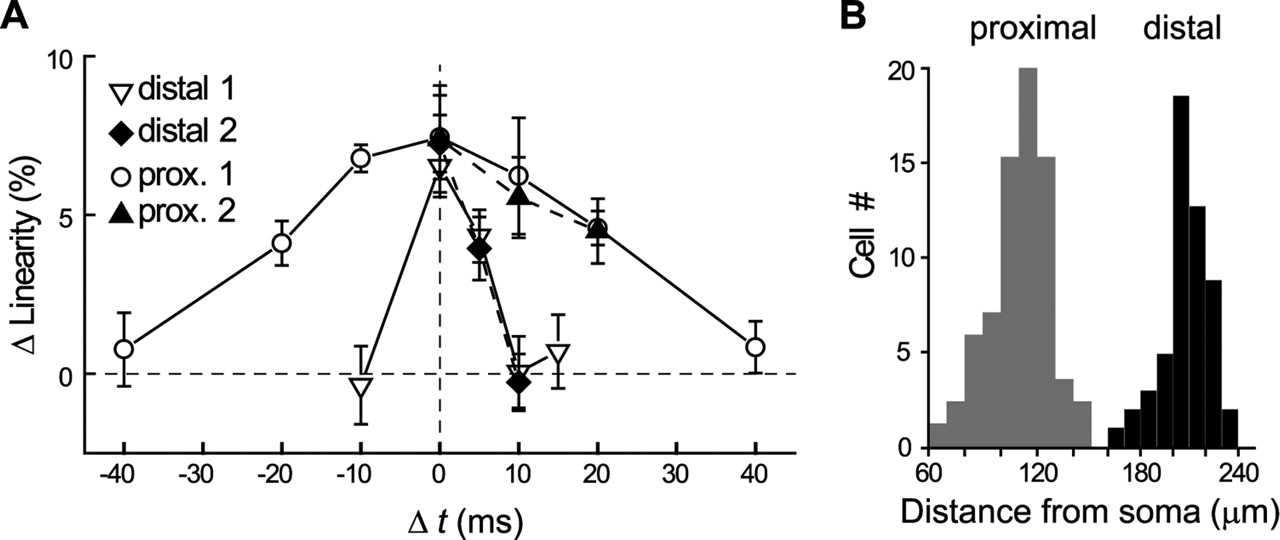
Distinct temporal windows for the enhancement of EPSP summation of distal versus proximal SC inputs after LTP induction. A, Summarized data on the changes in linearity versus the interval between the two EPSPs elicited at SP and SC of different dendritic locations corresponding to those indicated in Figure 2 (distal 1 and 2) and Figure 3 (proximal 1 and 2). Both SP and SC are located at either the distal (160–300 μm) or proximal (60–140 μm) dendrite. B, Distribution of the location of SP relative to the soma in all experiments shown in A. prox., Proximal.
- Figure 5.
LTP induction facilitated coincidence detection for distal inputs. A, Protocols for assessing spiking probability elicited by two synchronous or asynchronous (interval, 10 ms) EPSPs before and after LTP induction. Schematic diagram on the left depicts two independent distal SC inputs (200–300 μm from soma). Top traces, Sample EPSPs from SP, showing the increase in amplitude after LTP induction and subsequent adjustment back to the control level. Middle traces, Sample EPSPs from SC, showing no change in amplitude. Bottom traces, Samples of summed EPSPs elicited by synchronous and asynchronous stimulation of SP and SC before and after LTP induction, with spiking (arrowhead, truncated) induced by synchronous summation after LTP. B, Example experiment showing spike initiation by summed EPSPs elicited at two distal inputs at different interstimulus intervals before (left) and after (right) LTP induction. Traces above depict summed responses for two SC inputs stimulated at 13 different intervals (Δt = −18 to +18 ms), recorded from 15 consecutive trials before and after LTP induction. The traces with Δt = 18 at trials 5 and 9 of the control period are magnified. Dashed lines indicate synchronous summation (Δt = 0 ms). Histograms below show probability of spiking at different intervals for the 15 trails shown above. Note that the probability at Δt = 0 ms was set at ∼0.5 before LTP induction by adjusting the initial EPSP amplitudes. After LTP induction, the stimulus strength was reduced so that the EPSP amplitude of SP was the same as the previous LTP induction. C, The average spiking probability (±SEM) for summed EPSPs at Δt = 0, ±6, ±12, and ±18 ms before and after LTP induction. Solid lines represent the best first-order exponential fit. (**p = 0.0085; n = 4). D, Probability of spiking elicited by stimulating two SC inputs at distal dendrites plotted against the EPSP slope of SP (summation interval, 10 ms). The strength of SP was adjusted to elicit EPSPs of different amplitude, whereas that of SC was kept constant. The data were sorted into bins of EPSP slope of SP (bin size, 0.3 mV/ms). No significant difference was found between the data sets before and after LTP induction (p = 0.15; Mann–Whitney U test). prob., Probability.
- Figure 6.
LTP induction enhanced temporal integration for proximal inputs. A, Example experiment showing spike initiation by summed EPSPs elicited at two proximal inputs at different interstimulus intervals before (left) and after (right) LTP induction. Data are presented in the same manner as in Figure 5A. B, Summary from all experiments on spike initiation elicited by stimulating two proximal inputs before and after LTP induction (*p < 0.05; **p < 0.01; n = 6). C, Probability of spiking elicited by two proximal inputs plotted against the EPSP slope of SP (summation interval, 10 ms). A significant difference was found between the data sets before and after LTP induction (p = 0.001; Mann–Whitney U test). prob., Probability.
- Figure 7.
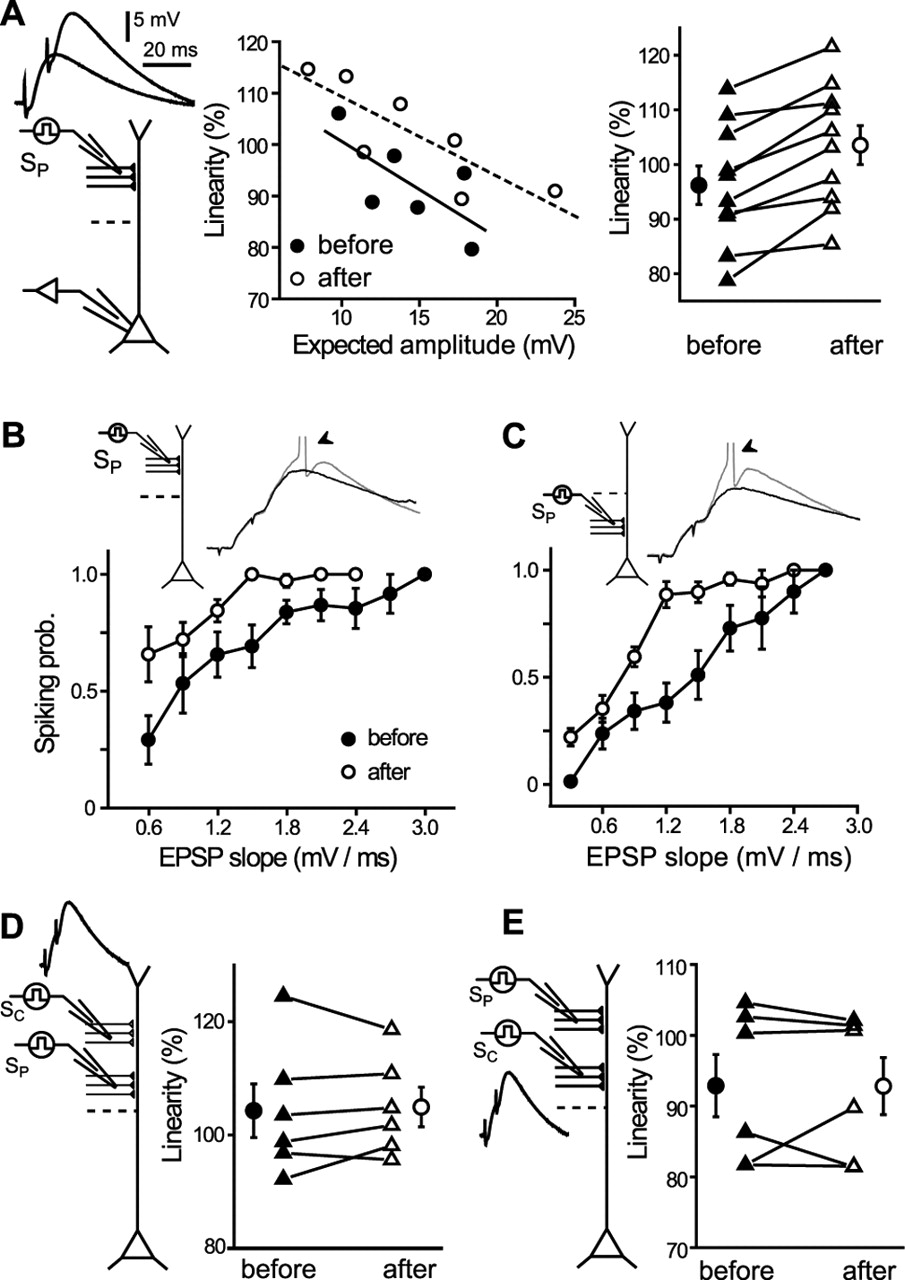
Increased linearity of temporal summation for asynchronous EPSPs elicited at a single distal input after LTP induction. A, The linearity of summation of consecutive EPSPs (interval, 10 ms) at a single distal input increased (p = 0.0002; n = 10) after LTP induction at the same input. B, C, The spiking probability for summed EPSPs (interval, 10 ms) at a single distal (B) or proximal (C) input was increased over a wide range of EPSP amplitudes after LTP induction. Traces depict sample of summed EPSPs before (dark) and after (gray) LTP induction. Arrowheads indicate truncated action potentials [p = 0.0067 (B); p = 0.0026 (C); Mann–Whitney U test]. D, E, Input specificity in the enhancement of temporal summation after LTP induction. Regardless of the relative location of SP and SC, SP proximal to SC (D), or SP distal to SC (E), temporal summation at SC for two consecutive EPSPs (interval, 10 ms) was not affected [p = 0.69 (D); p = 0.97 (E)].


