

Article Figures & Data
Figures
- Figure 1.
Receptive field of a parvocellular type I cell in the lateral geniculate nucleus (A), two theoretical receptive fields capable of spatial color calculations (B), and predicted response maps. A, Receptive field and profile view as a difference of Gaussians (left diagrams) and responses to cone-isolating stimuli (right). Cone-isolating stimuli can either increase (+) or decrease (−) the activity of a single cone class. This cell shows excitation to L+ and a broader region of excitation to M− (white regions in the response maps). Note that the optimal stimulus is not a red spot on a green background but rather a bright red spot on a dark red background. The colored squares behind L+, L−, M+, and M− provide a rough idea of what cone-isolating stimuli look like. B, Model 1 shows a set of Gaussians that produce spatial and chromatic opponency. The peaks of all predicted response maps are centered at the same location. Model 2, which also produces chromatic opponency, is built up from many red-ON type I cells: cells feeding the center are wired with excitatory connections and cells feeding the surround with inhibitory connections (adapted from Billock, 1991). The peak response to the L− stimulus will be offset from the peak response to the L+ stimulus.
- Figure 2.
Response maps (top) and the spike-triggered average histograms (bottom) to cone-isolating stimuli for a single cone-opponent neuron in primary visual cortex of an alert macaque. The response maps show the spatial structure of cone inputs to the receptive field at the optimal reverse-correlation delay of the receptive-field center (93 ms). The difference maps are the − response subtracted from the + response and show excitation in red and suppression in blue. The neuron showed both spatial and chromatic opponency, i.e., double-opponency. For this neuron, the peak center is aligned with the center of the response maps. The spike-triggered average histograms show the temporal evolution of the response of the peak center and peak surround locations (method 1 was used to index the center and surround; see Materials and Methods). Two SDs above and below the mean background firing rate are indicated by the horizontal dotted lines. Solid arrowheads show the time-to-peak of the center; open arrowheads show the time-to-peak of the surround.
- Figure 3.
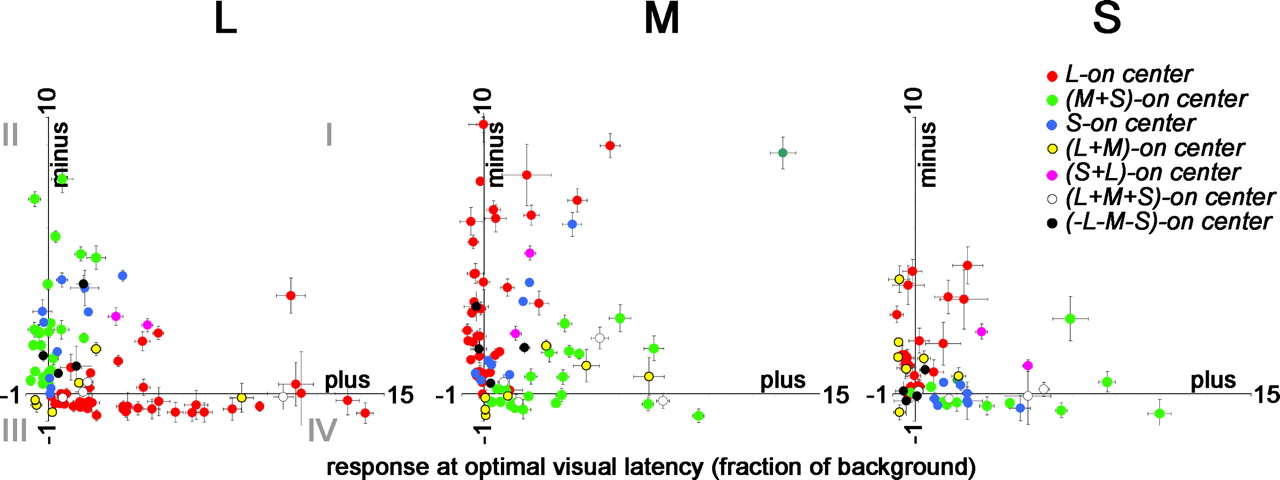
Push–pull organization of cone inputs to cone-opponent cells in V1. Most L-ON-center neurons (red dots) were both excited by L+ stimuli and suppressed by L− stimuli, indicated by the location of the responses within quadrant IV (left plot). Similarly, M-ON-center neurons (green spots) were excited by L− and suppressed by L+, indicated by the location of the responses within quadrant II (left plot). Push–pull functional organization was also seen for L-ON and M-ON cells to the M stimulus (middle plot). Blue–yellow neurons showed push–pull to the L and M stimuli less often (most blue and yellow dots in quadrants I and III, L and M plots). Peak responses at the center location were determined using Equation 4 (see Materials and Methods). Error bars show the SD of the firing rate of each neuron. For χ2 values describing the distribution of the cells within the plots, see supplemental Table 1A–C.
- Figure 4.
ON and OFF responses in cone-opponent neurons reveal asymmetries in responses to light increments and decrements. The response was determined as the average significant response throughout the center receptive-field subregion (method 3; see Materials and Methods). OFF responses were stronger than ON responses (paired t test, p < 0.001). For L-ON cells, the ON response was the response to L+ and the OFF response was that to M−; for M-ON cells, the ON response was the response to M+ and the OFF response was that to L−. For S-ON cells, the ON response was that to S+ and the OFF response was the average response to M− and L−; for (L+M)-ON cells, the ON response was the response to L or M (whichever was stronger), and the OFF response was that to S−. The displacement above the x = y diagonal is significant for the red–green cells and for the total population but not for the blue–yellow cells alone.
- Figure 5.
The balance of cone inputs to the receptive-field centers of cone-opponent neurons. Units are spikes per second. Error bars are SDs of the baseline firing rate of each neuron. A, M versus L input to red–green cells. The regression line combining L-ON and M-ON cells showed balance opponency of L and M (M = −0.96 × L; r2 = 0.9; measured using the peak difference method, method 2; see Materials and Methods). Area responses (method 4; Materials and Methods) revealed a subtle difference in cone ratios of the two populations, reflected as a kink about the origin when the average L versus M input to M-ON cells is plotted separately from that to L-ON cells (inset; L-ON cells, M = −1.13 × L; M-ON cells, M = −0.71 × L; regression lines are carried into the adjacent quadrant as dotted lines). This difference reflects the ON/OFF asymmetries shown in Figure 4. B, S versus M input to red–green cells. The majority of red–green neurons were driven by the S-cone stimulus, in a manner that pitted M+S against L. C, D, M versus L input (C) and S versus M input (D) to blue–yellow cells and achromatic cells.
- Figure 6.
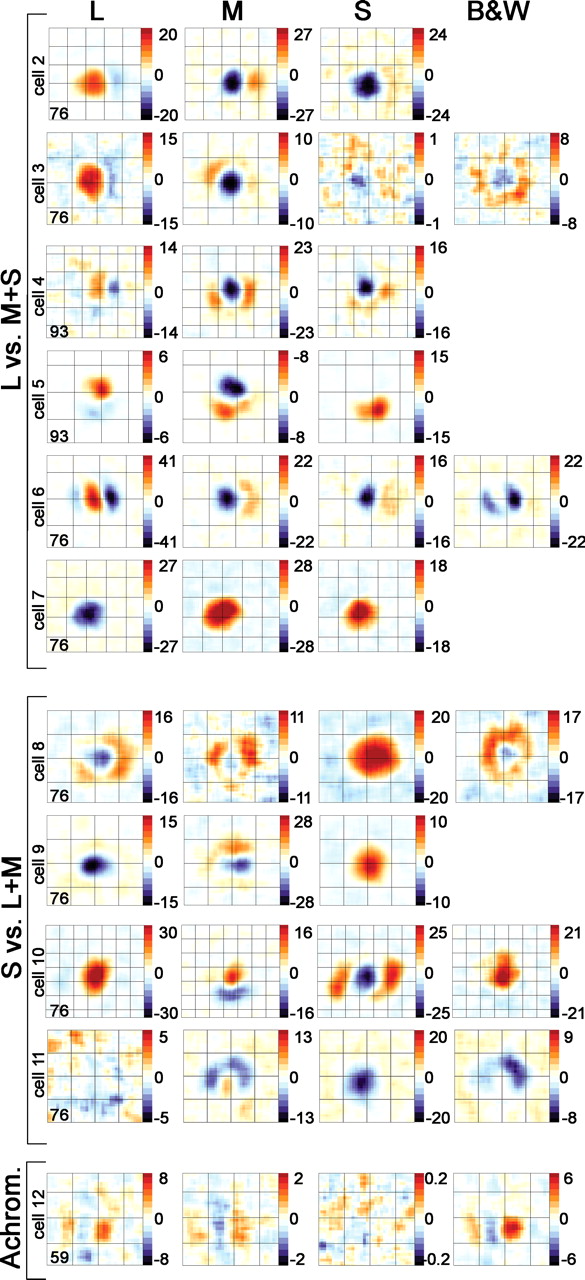
Spatially opponent receptive fields of cone-opponent neurons in V1. Each row represents the cone difference maps for a single cell. Red indicates excitation, and blue indicates suppression. With the exception of the achromatic cell (bottom), all cells showed chromatic opponency. The L versus M+S cells (red–green cells) showed opposite patterns of response (excitation or suppression) between the L and M maps (and often S maps) within a given spatial location. The S versus L+M cells (blue–yellow cells) showed opposite patterns of response within a given spatial location between S and L or M maps. In addition, each single map shows spatial opponency, indicated by areas of excitation and areas of suppression. Spatial scale of the overlying grid is 0.75°. The reverse-correlation delays (in milliseconds) of the response maps are given in the bottom left corner of the L map for each cell. Scale bar is in spikes per second. Complete spatiotemporal maps are shown for cells 2, 3, 4, 8, 10, and 11 in supplemental Figure 7 (available at www.jneurosci.org as supplemental material), supplemental Figure 3 (available at www.jneurosci.org as supplemental material), Figure 10, supplemental Figure 6 (available at www.jneurosci.org as supplemental material), supplemental Figure 5 (available at www.jneurosci.org as supplemental material), and Figure 15, respectively.
- Figure 7.
Quantification of center/surround opponency and cone weights. A, Spatial opponency of the L-cone maps (left), M-cone maps (center), and S-cone maps (right). The peak response (method 1; see Materials and Methods) was used to measure the strength of the center versus the strength of the surround. Quadrants II and IV contain neurons that had spatial opponency, indicated by the schematic “Mexican hat” receptive-field profile. Units are spikes per second. Lsurround = −0.21 × Lcenter, r2 = 0.2; Msurround = −0.22 × Mcenter, r2 = 0.3; Ssurround = −0.32 × 32 Scenter, r2= −0.1. Insets show LGN responses to similar stimuli; axes limits are 40 spikes/(second × C), where C is the contrast of the stimulus (data from Reid and Shapley, 2002). Spatial opponency is evident using any method of indexing the center and surround (supplemental Fig. 2, available at www.jneurosci.org as supplemental material). B, Cone weights. The sum of the absolute values of the responses (method 4; see Materials and Methods) to each cone stimulus were normalized to a total of 1. The normalized values of the L- and M-cone inputs are plotted, preserving the sign of the response. The S response is indicated by the distance from the diagonal lines toward the origin. Neurons in which S-cone responses were not measured are depicted outside the diagonal lines; neurons with negligible S-cone input lie on the diagonal lines. A red-ON cell having balanced, opponent L and M input, with no S input, would be plotted as L = 0.5, M = −0.5, at the center of the diagonal in quadrant IV.
- Figure 8.
Spatial extent of the receptive-field center and surround. A, The average receptive-field surround was more than half the size of the average receptive-field center, for each cone input. SEMs are shown. Measurements are the average response throughout the significant area of activation (method 3; see Materials and Methods), for the whole population of cone-opponent neurons. B, Weak correlation between the size of the centers and surrounds. Neurons with insignificant surrounds (<2.5 SDs above the background) are shown along the x-axis. Excluding insignificant surrounds, the center/surround correlations are as follows: L plot, r2 = 0.35, p = 0.005; M plot, r2 = 0.26, p = 0.04; S plot, r2 = 0.11, p = 0.6.
- Figure 9.
Offsets of the peak activation of the receptive-field centers and surrounds. Diagram at top shows a contour around the significant regions of activation of the cell shown in Figure 2; peak responses within each subregion are indicated by the dots. An offset of 100% represents one width of the receptive-field center. One green-ON cell and three blue-ON cells had insignificant centers but significant surrounds in at least one of their maps (e.g., cell 5, Fig. 6, S-cone map); these were not included in this analysis. A, Center-surround offset of red–green cells. L map, Average ± SE, 69 ± 4%; M map, average ± SE, 61 ± 4% (not significantly different from L maps, p = 0.23, t test); S map, average ± SE, 84 ± 8% (different from distribution of M at p = 0.06, t test). B, Center-surround offset of blue–yellow cells. L map, Average ± SE, 88 ± 19%; M map, average ± SE, 50 ± 39%; S map, average ± SE, 96 ± 34%.
- Figure 10.
Spatiotemporal response of the cone inputs to a single cone-opponent neuron. The location of the overlying grid (0.75° gridline spacing) is useful in comparing the location of the responses in different maps. The two states of the stimulus consisted of a bright state (+), which increased the activity of the given cone class, and a dark state (−), which decreased the response of the given cone class. Responses in the + and − maps are indicated by a color scale bar, in spikes per second. Black shows zero firing rate. Responses in the difference maps, constructed by subtracting the − map from the + map, are also indicated by a color scale bar (spikes per second): white shows zero difference, red shows excitation, and black shows suppression. Each single map is the average response over a 17 ms time window; each horizontal strip shows the evolution of the response over 13 windows (total of 221 ms). Maps at the earliest reverse-correlation delay (8 ms) show no structure; these maps show the average response of the neuron before the visual latency is reached and are a useful measure of the baseline firing rate of the cell under each stimulus condition. Responses to the two states of each stimulus were collected in a single stimulus run. The stimulus size was 0.64° square, and the stimulus duration was 68 ms.
- Figure 11.
STAs to cone-isolating stimuli of cone-opponent neurons in V1. Bold lines show center responses; dashed lines show surround responses. The STAs show the time course of the difference response (+ response minus − response; see bottom row of STAs in Fig. 2). Each population of neurons shows cone-opponency indicated by the opposite orientation of the response signature between pairs of cone stimuli. For example, the centers of L-ON cells show excitation to L and suppression to M and S (top row of histograms). The surround responses show an opposite STA signature to that of the center, indicating spatial opponency. Responses were determined using method 4 (see Materials and Methods).
- Figure 12.
Time-to-peak of the excitatory response of the receptive-field centers and surrounds of cone-opponent neurons in V1. Cell responses have been binned in 10 ms bins, according to their times-to-peak. The scale bar indicates the number of counts in each bin. A, The time-to-peak surround response of the red–green neurons was on average 12 ms later than the time-to-peak center response (t test, p < 0.0002). This is reflected as a displacement of responses above the diagonal. B, The time-to-peak surround response of the blue–yellow cells was not significantly different from the time-to-peak center response (p < 0.09). C, Time-to-peak responses for the whole population. The average delays of center and surround are indicated by open arrowheads (difference is 11 ms; p < 0.003). Average time-to-peak responses in the LGN are indicated by filled arrowheads (from Reid and Shapley, 2002). Only significant center and surround responses (>2.5 SDs of the background) were analyzed.
- Figure 13.
Responses of cone-opponent neurons to achromatic stimuli. Peak responses (method 2; see Materials and Methods) of the dominant center cone were compared with the white–black response at the receptive-field center. For (L+M)-ON cells, the average response to L and M was used. SDs of the background firing rate are shown if larger than the symbol size. Units are spikes per second.
- Figure 14.
Receptive fields of single-opponent neurons in V1. A, Difference response maps to L and M cone-isolating stimuli of three single-opponent cells and three double-opponent cells. Response maps were taken at the peak reverse-correlation delay. Excitation (+) is shown in red; suppression (−) is shown in blue. The complete spatiotemporal movie of cell 13 is shown in supplemental Figure 4 (available at www.jneurosci.org as supplemental material). The overlying grid is 0.75°. B, Quantification of the receptive-field sizes of the population of single-opponent neurons and the receptive-field centers of spatial-opponent neurons (¾-opponent neurons and double-opponent neurons combined). The single-opponent neurons have smaller receptive-field sizes (t test, p < 0.006).
- Figure 15.
Spatiotemporal response of the cone inputs to a blue–yellow cell [(L+M)-ON-center]. The center showed pronounced suppression to S+ and weak excitation to M+ (59 ms in the difference maps). The L cone did not show push–pull structure (both + and − maps show the same response pattern). A lack of push–pull in L and/or M maps was often found in blue–yellow neurons (Fig. 3). Stimulus duration of 34 ms. Stimulus size of 0.64°. Other conventions as for Figure 10.
- Figure 16.
Rebound responses of cone-opponent cells. A, Spatiotemporal response of the cone inputs to a red-ON-center cell that showed rebound responses in both center and surround. Stimulus duration of 51 ms. Stimulus size of 0.48°. “peak” shows maps at 76 ms reverse-correlation delay; “rebound” shows maps at 127 ms. Units are spikes per second. Other conventions as for Figure 10. The complete spatiotemporal response movie (supplemental Fig. 7, available at www.jneurosci.org as supplemental material) illustrates the interplay of the rebound response combined with the difference in timing of center and surround (Fig. 12). B, Average rebound responses to cone-isolating stimuli of the receptive-field center of L-ON-center cells, M-ON-center cells, S-ON-center cells, and (L+M)-ON-center cells. Responses are taken at the peak rebound response, after the cessation of the stimulus, and are determined by subtracting the − response from the + response, reported as a fraction of the baseline response. In neurons that showed no rebound response, the response at a reverse-correlation delay corresponding to the average time-to-rebound-peak for the population of cells was used. Red–green neurons (L-ON and M-ON) showed rebound responses: the rebound of L-ON cells involved suppression by L cones and excitation by M+S cones; the rebound of M-ON cells showed excitation by L cones and suppression by M+S cones. S-ON neurons showed rebound responses to L+M stimuli but not to S stimuli; (L+M)-ON neurons did not show rebound responses to any cone stimulus. SEMs are shown.
- Figure 17.
Rebound responses of cone-opponent neurons to + versus − states of the cone-isolating stimuli: L, left plot; M, middle plot; S, right plot. Responses calculated using Equation 4 (see Materials and Methods). Responses in quadrants II and IV show rebound responses, as expected from Figure 16: L-ON cells in quadrant II in the L plot and in quadrant IV in the M plot; M-ON cells in quadrant IV in the L plot and in quadrant II in the M plot. These neurons are capable of temporal color contrast. Other neurons showed suppressive rebound responses to both states of a given cone-isolating stimulus, depicted in quadrant III. S-cone rebound responses were weaker, shown by the clustering of the responses around the origin.
- Figure 18.
Proposed scheme for processing of red–green cone signals by the early visual system. This scheme reconciles the existence of both double-opponent cells and complex-equiluminant cells within primary visual cortex. Complex-equiluminant cells lack the first-order receptive-field structure of double-opponent cells, yet like double-opponent cells, show responses to equiluminant color boundaries. Type I cells in the LGN form the building blocks for both populations of cells. Single-opponent cells and simple cells may be intermediate stages. A given ON-center luminance simple cell probably gets input from both L-ON and M-ON type I cells given that there is not a separate retinal mosaic for red-ON and green-ON cells (Lee, 1996). Type I cells respond poorly to spatial color contrast, but the color contrast that nulls the response “varie(s) widely from cell to cell” (Hubel and Livingstone, 1990b) and is not restricted to psychophysical equiluminance (Logothetis et al., 1990). This produces neurons with orientation tuning and no equiluminance null, “complex-equiluminance” cells, because the various inputs, each with their own null points, compensate for each other. This compensatory effect would be enhanced with the addition of magnocellular input. Double-opponent cells also lack an equiluminance null yet preserve the opponency of the type I inputs within each receptive-field subregion. The push–pull structure of double-opponent cells (Fig. 3) suggests that they receive both excitatory and inhibitory input. The separate excitatory and inhibitory inputs are shown for a single hypothetical red-ON double-opponent cell (open arrow, inhibitory input; filled arrows, excitatory input). Given four kinds of red–green type I cells and two kinds of synapses (excitatory and inhibitory), several other wiring diagrams can be invented for a red-ON-center double-opponent cell. The double-opponent neuron is depicted with a crescent-shaped surround having two hot spots, reflecting the receptive fields of actual double-opponent cells (Fig. 6).


Tables
Cell type (center ON) Number of cells recorded Number of cells with surrounds Double-opponent (cells having a surround in L or M and S) ¾-Opponent (cells having a surround in L/M or S but not both) Single-opponent cells (cells lacking both L/M and S surrounds) Measured cone L M S L 41 30 of 41 30 of 41 15 of 23 26 of 41 8 of 41 7 of 41 M 25 19 of 25 16 of 25 9 of 15 15 of 25 5 of 25 5 of 25 Total 66 49 of 66 46 of 66 24 of 38 41 of 66 13 of 66 12 of 66 Cell type (center ON) Number of cells recorded Number of cells with surrounds Double-opponent (cells having a surround in L or M and S) ¾-Opponent (cells having a surround in L/M or S but not both) Single-opponent cells (cells lacking both L/M and S surrounds) Measured cone L M S S 10 7 of 10 6 of 9 2 of 10 2 of 10 5 of 10 3 of 10 (L+M) 7 3 of 6 6 of 7 6 of 7 5 of 7 2 of 7 0 of 7 Total 17 10 of 16 12 of 15 8 of 17 7 of 17 7 of 17 3 of 17 Cell type Number of cells recorded Double-opponent ¾-Opponent Single-opponent cells Red–green 66 41 13 12 Blue–yellow 17 7 7 3 Total 83 48 20 15 Center time-to-peak (ms) Surround time-to-peak (ms) L M S L M S Red–green cells 73 ± 1.3 75 ± 1.5 84 ± 2.3 84 ± 2.0 86 ± 2.6 95 ± 4.1 Blue–yellow cells 82 ± 4.3 81 ± 3.3 80 ± 4.0 77 ± 2.4 88 ± 5.6 89 ± 4.8 Single-opponent cells 69 ± 3.4 73 ± 2.3 83 ± 5.8
Supplemental data
Files in this Data Supplement:
- supplemental material - Figure legends
- supplemental material - Supplemental Tables
- supplemental material - Figure 1
- supplemental material - Figure 2
- supplemental material - Figure 3
- supplemental material - Figure 4
- supplemental material - Figure 5
- supplemental material - Figure 6
- supplemental material - Figure 7


