

Article Figures & Data
Figures
- Figure 1.
Diagram of SCN1A Markov model. The SCN1A Markov model consists of 21 states connected by 37 reversible transitions. The model includes states for the following conditions: closed (C), open (O), fast inactivated (F), and slow inactivated (S). The only ion-conducting state is O (Ø states are non-conducting because of inactivation gate closure). Supplemental Table S1 (available at www.jneurosci.org as supplemental material) includes a complete list of the voltage-dependent rate equations.
- Figure 2.
Secondary stabilization is essential for open-state inactivation. SCN1A open-state inactivation was explored by modeling different inactivation mechanisms. A, An open-state inactivation pathway consisting of a single step (O to FØL) was unable to reproduce the biphasic whole-cell current characteristic of SCN1A. B, A two-step inactivation pathway reproduces the SCN1A biphasic whole-cell current decay. The modeled inactivation pathway includes an unstable intermediate state FØ between the open state O and the stabilized latched inactivated state FØL.
- Figure 3.
WT-SCN1A model generates accurate whole-cell currents. A, Representative whole-cell currents recorded from a tsA201 cell coexpressing the human WT SCN1A and the human β1 and β2 accessory subunits. Currents were elicited by voltage steps to potentials between −80 and +60 mV from a holding potential of −120 mV. B, Model WT-SCN1A whole-cell currents recorded in response to the stimulation protocol in A. C, Comparison of actual and model WT-SCN1A current traces for the −10 mV voltage step from A and B, respectively. D, Comparison of actual WT-SCN1A and all previously reported SCN1A computational models (Clancy and Kass, 2004; Spampanato et al., 2004a; Spampanato et al., 2004b; Barela et al., 2006) in response to the −10 mV voltage step.
- Figure 4.
Analysis of simulated WT-SCN1A whole-cell current. The WT-SCN1A computational model (open symbols) reproduces the whole-cell biophysical characteristics of WT-SCN1A heterologously expressed in tsA201 cells (n = 14; filled symbols). Whole-cell currents were elicited by the voltage protocol in the inset in A. A, B, Peak current amplitude and time to peak current were plotted for each potential, respectively. C, The voltage dependence of channel activation was calculated from the normalized conductance values. Data were fit using a Boltzmann equation, and fit parameters are provided in Table 1. D, Inactivation time constants were estimated by fitting the decay phase of the whole-cell current with a two-exponential function. Fit parameters are provided in Table 2, and the fast and slow inactivation time constants are plotted for each potential.
- Figure 5.
Analysis of simulated WT-SCN1A fast inactivation. The WT-SCN1A model (open symbols) reproduces the fast inactivation characteristics of channels heterologously expressed in tsA201 cells (n = 14; filled symbols). A, Voltage-dependent entry into fast inactivation was examined using a two-pulse protocol consisting of a 100 ms conditioning pulse at various potentials, followed by a test pulse at −10 mV. B, Time-dependent recovery from fast inactivation was examined using a two-pulse protocol consisting of a 100 ms inactivation pulse at −10 mV, followed by a variable length return to −120 mV and a second test pulse to −10 mV. Data were fit using either a Boltzmann (A) or two-exponential (B) equation; fit parameters are provided in Table 1.
- Figure 6.
Analysis of simulated WT-SCN1A slow inactivation. The WT-SCN1A model (open symbols) reproduces the slow inactivation characteristics of heterologously expressed channels (n = 11; filled symbols). A, Time-dependent entry into slow inactivation was examined using a two-pulse protocol consisting of a variable length inactivation pulse to −10 mV, followed by a test pulse at −10 mV. Effects of fast inactivation were minimized using a 50 ms inter-pulse step to −120 mV to relieve fast inactivation. B, Voltage-dependent entry into slow inactivation was examined using a two-pulse protocol consisting of a 30 s conditioning pulse at various potentials, followed by a test pulse at −10 mV. Effects of fast inactivation were minimized using a 50 ms inter-pulse step to −120 mV to relieve fast inactivation. C, Time-dependent recovery from slow inactivation was examined using a two-pulse protocol consisting of a 30 s inactivation pulse to −10 mV, followed by a variable length inter-pulse step to −120 mV and a test pulse to −10 mV. Data were fit using either a two-exponential (A, C) or Boltzmann (B) equation; fit parameters are provided in Table 3.
- Figure 7.
Computational model of GEFS+ mutant R1648H. A, The model for R1648H was constructed by destabilizing the fast inactivated state FØL (6-fold increase in β6; inset). Whole-cell current simulations of R1648H reveal increased persistent sodium current compared with simulated WT-SCN1A. B, Levels of simulated persistent current for models WT-SCN1A (open bar; 0.3% of peak current) and R1648H (open bar; 1.8% of peak current) replicate the average persistent current empirically measured for heterologously expressed WT-SCN1A (filled bar; 0.3 ± 0.1% of peak current; n = 9) and R1648H (filled bar; 1.8 ± 0.3% of peak current; n = 6). Persistent current was measured during the final 10 ms of a 200 ms voltage step to −10 mV.
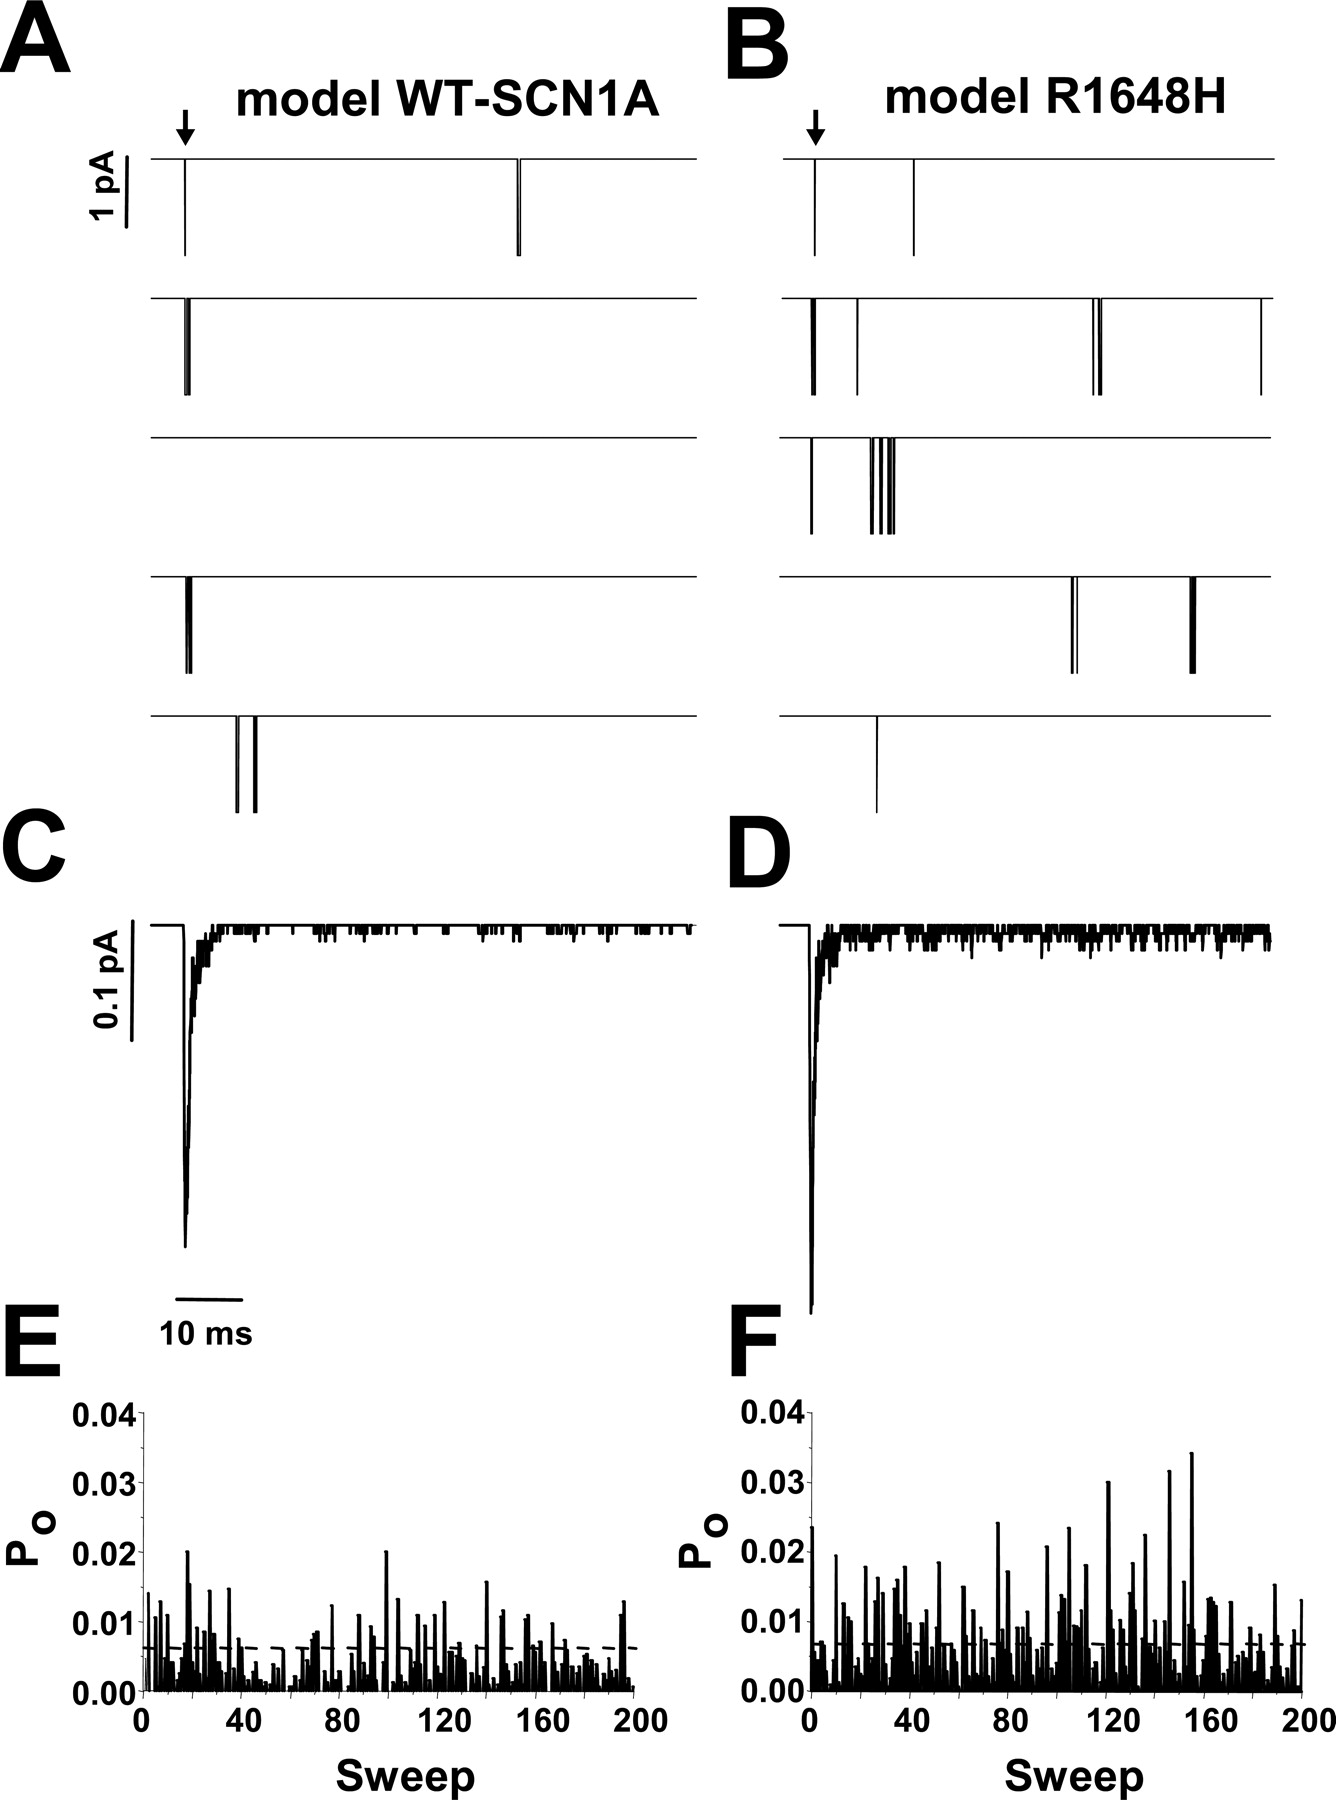
- Figure 8.
Late channel openings underlie model R1648H persistent current. A, B, Five consecutive single-channel simulations for WT-SCN1A and R1648H, respectively. Downward deflections represent channel openings, and arrows indicate onset of voltage step from −120 to −10 mV. C, D, Representative ensemble average of 200 consecutive simulations using WT-SCN1A and R1648H models, respectively. E, F, Open probability (Po) diary for each of the 200 simulations for WT-SCN1A and R1648H, respectively. Po was calculated 0–80 ms after the voltage step.


Tables
Activation Voltage dependence of fast inactivation Recovery from fast inactivationa V1/2(mV) k (mV) n V1/2(mV) k (mV) n τf(ms) τs(ms) n Actual WT-SCN1A −19.4 ± 1.4 7.9 ± 0.2 13 −62.7 ± 1.7 −6.9 ± 0.2 14 2.4 ± 0.3 [85 ± 1%] 41.0 ± 6.0 [15 ± 1%] 14 Model WT-SCN1A −19.9 8.5 −61.3 −7.7 2.2 [82%] 26.6 [18%] Model R1648H −19.9 8.5 −61.3 −7.8 2.1 [81%] 23.0 [19%] -
↵aValues in brackets represent amplitude.
-
Fast componenta Slow componenta Actual WT-SCN1A Model WT-SCN1A Model R1648H Actual WT-SCN1A Model WT-SCN1A Model R1648H −30 mV 2.73 ± 0.49 [69 ± 18%] 2.20 [81%] 2.22 [86%] 6.4 ± 1.5 [31 ± 18%] 5.9 [19%] 7.0 [14%] −20 mV 1.34 ± 0.18 [86 ± 5%] 1.04 [81%] 1.03 [83%] 5.5 ± 0.6 [14 ± 5%] 4.0 [19%] 3.8 [17%] −10 mV 0.72 ± 0.06 [93 ± 1%] 0.62 [82%] 0.68 [87%] 6.0 ± 0.7 [7 ± 0.8%] 3.0 [18%] 3.3 [13%] 0 mV 0.47 ± 0.03 [94 ± 1%] 0.46 [87%] 0.46 [89%] 4.4 ± 0.5 [6 ± 0.7%] 2.8 [13%] 2.6 [11%] 10 mV 0.37 ± 0.02 [94 ± 1%] 0.32 [87%] 0.33 [89%] 3.9 ± 0.6 [6 ± 0.6%] 2.2 [13%] 2.2 [11%] 20 mV 0.31 ± 0.02 [92 ± 1%] 0.26 [89%] 0.23 [85%] 3.0 ± 0.3 [8 ± 1.2%] 1.9 [11%] 1.6 [15%] 30 mV 0.28 ± 0.02 [90 ± 1%] 0.20 [84%] 0.19 [83%] 2.7 ± 0.2 [10 ± 1.3%] 1.5 [16%] 1.4 [17%] -
↵aValues in brackets represent fractional amplitude.
-
Onset of slow inactivationa Voltage dependence of slow inactivation Recovery from slow inactivationa τf(ms) τs(ms) Ir n V1/2(mV) k (mV) Ir n τf(ms) τs(ms) n Actual WT-SCN1A 30 ± 7 [3 ± 1%] 3029 ± 283 [83 ± 1%] 14 ± 1 14 −66.7 ± 2.0 7.8 ± 0.2 10 ± 1 11 238 ± 16 [65 ± 3%] 2487 ± 240 [35 ± 3%] 11 Model WT-SCN1A 30 [1%] 2793 [84%] 15 −68.5 6.2 17 225 [63%] 2647 [37%] Model R1648H 30 [1%] 3112 [83%] 16 −68.6 6.1 18 221 [63%] 2650 [37%] -
↵aValues in brackets represent amplitude.
-
Supplemental data
Files in this Data Supplement:
- supplemental material - Table 1
- supplemental material - Figure S1. Whole-cell currents generated by previously reported SCN1A models Simulated whole-cell currents generated by previously reported computational models for SCN1A (Barela et al., 2006; Clancy and Kass, 2004; Spampanato et al., 2004b; Spampanato et al., 2004a). The stimulation protocol was identical to that used in Fig. 3A and the red trace highlights the voltage step to �10 mV.
- supplemental material - Figure S2. Analysis of whole-cell currents generated by other SCN1A models Comparison of the whole-cell current measured from heterologously expressed WT-SCN1A (black symbols) and those generated by the previously reported SCN1A computational models (colored symbols). Whole-cell currents were elicited by voltage steps to potentials between �80 and +60 mV from a holding potential of �120 mV (stimulation protocol used in Fig. 4A). (A-B) Peak current amplitude and time to peak current plotted for each potential, respectively. (C) The voltage-dependence of channel activation was plotted using the normalized conductance values. (D) Inactivation time constants were estimated by fitting the decay phase of the whole-cell currents in Fig. S1 with a single exponential function. Fitting the current decay with a double exponential equation failed to reveal a second inactivation time component. For comparison with actual SCN1A inactivation, the fast inactivation time constants are plotted for each potential (data from Fig. 4D).
- supplemental material - Figure S3. Fast inactivation exhibited by other SCN1A models Comparison of fast inactivation exhibited by heterologously expressed WT-SCN1A (black symbols) and the previously reported SCN1A computational models (colored symbols). (A) Voltage-dependent entry into fast inactivation was examined using a two-pulse protocol consisting of a 100 ms conditioning pulse at various potentials followed by a test pulse at �10 mV. (B) Time-dependent recovery from fast inactivation was examined using a two-pulse protocol consisting of a 100 ms inactivation pulse at �10 mV followed by a variable length return to �120 mV and a second test pulse to �10 mV.
- supplemental material - Figure S4. Slow inactivation exhibited by other SCN1A models Comparison of the slow inactivation exhibited by heterologously expressed WT-SCN1A (black symbols) and previously reported SCN1A computational models (colored symbols). (A) Time-dependent entry into slow inactivation was examined using a two-pulse protocol consisting of a variable length inactivation pulse to �10 mV followed by a test pulse at �10 mV. Effects of fast inactivation were minimized using a 50 ms inter-pulse to �120 mV to relieve fast inactivation. (B) Voltage-dependent entry into slow inactivation was examined using a two-pulse protocol consisting of a 30 sec conditioning pulse at various potentials followed by a test pulse at �10 mV. Effects of fast inactivation were minimized using a 50 ms inter-pulse to �120 mV to relieve fast inactivation. (C) Time-dependent recovery from slow inactivation was examined using a two-pulse protocol consisting of a 30 sec inactivation pulse to �10 mV followed by a variable length inter-pulse to �120 mV and a test pulse to �10 mV.
- supplemental material - Figure S5. Persistent current exhibited by other SCN1A models (A) Whole-cell simulations of previously reported SCN1A models (colored lines) reveal wide variation in levels of persistent current compared to heterologously expressed WT-SCN1A (black line). Representative currents generated in response to a 200 ms voltage step to �10 mV and normalized to peak current amplitude. (B) The persistent current generated by previously reported SCN1A models varied between 0.06 and 2.28 % of peak. Persistent current measurements were made during the final 10 ms of a 200 ms voltage step.


