

Article Figures & Data
Figures
- Figure 1.
Reduction in peripheral aborization of the ophthalmic projection from trigeminal ganglia in the Slit2;Slit3 or the Robo1;Robo2 double mutant. A , B , The ophthalmic projections of the trigeminal ganglion from E12.5 embryos were visualized by neurofilament immunostaining, which revealed the two ophthalmic branches surrounding the eye (*). When compared with its littermate control from the Slit2;Slit3 cross ( B vs A ), the top branched structure (arrows) is greatly reduced in the double mutant, whereas the bottom one (arrowheads) remains the same. Because of the variation in the overall growth of the two branched structures even in the same litter, a Slit2 +/− ;Slit3 +/+ is shown here as a littermate control to match the bottom arbor in the double mutant. Scale bars, 50 μm. C , The extent of branching in the wild-type or the Slit2;Slit3 mutant animals is quantified by measuring the area occupied by the branched arbors, the number of branching points, or the total branch length. To normalize for slight differences in developmental stages, both are plotted as the ratio of the top arbor versus the bottom one, which appears to follow a normal developmental course in all animals. The ratio of the area, points, or lengths in the wild type is 1.41 ± 0.24, 1.16 ± 0.34, or 1.27 ± 0.22, respectively, whereas the ratio in the mutant is 0.69 ± 0.30, 0.61 ± 0.36, or 0.56 ± 0.23, respectively. D , E , The ophthalmic projections from the Robo1;Robo2 cross are stained with neurofilament antibodies as in A and B . The embryos shown here are slightly younger than those in A and B to illustrate the requirement of Robo signaling in early branch formation. Scale bars, 500 μm. F , Quantification of the difference in Robo1;Robo2 animals as in C . The ratio of branching area, points, or length drops from 1.94 ± 0.26, 1.42 ± 0.22, or 1.57 ± 0.28 in the wild type to 0.79 ± 0.22, 0.59 ± 0.11, or 0.71 ± 0.21 in the mutant, respectively.
- Figure 2.
Misprojections of sensory afferents into the spinal cord are revealed by DiI labeling in Slit1 −/− ;Slit2 −/− or Robo1 −/− ;Robo2 −/− mutant embryo. A , A schematic diagram showing the central and peripheral projections of sensory axons in the spinal cord at E13.5. The viewing planes of DiI labeling shown in B–E and F–I are indicated by the boxes around the diagram. Slit expression is indicated by the letter S. B–E , Central branches labeled with DiI injected into the DRG were visualized in transverse sections of E13.5 spinal cords from the site of dorsal root entry. In either the wild-type ( C ) or the Slit1 +/− ;Slit2 +/− ( B ) animals, collaterals of the Ia muscle afferents (arrowheads) emerge from the dorsal funiculus (*), the bundled axons that extend along the longitudinal tract. These collaterals are also present in their littermate mutants ( D , E ), although their hyperbolic trajectory is slightly altered. In addition, in the most dorsal side of the spinal cord, bundles of labeled axons were found extending inside the spinal cord toward the midline. Some of these overshooting fibers (arrows) turn ventrally at the midline, whereas others venture across the midline and extend on the contralateral side of the spinal cord. L, Left; R, right; D, dorsal; V, ventral. Scale bars, 100 μm. F–I , DRG projections labeled by DiI were visualized from the dorsal side of the spinal cord. In the E13.5 Slit1 +/− ;Slit2 +/− embryo ( F ), the labeled sensory afferents are present in the DREZ along the rostrocaudal axis. A small number of collaterals (arrowheads) just begin to enter the spinal cord and remain close to the DREZ. However, in either the Slit1 +/− ;Slit2 −/− ( G ) or Slit1 −/− ;Slit2 −/− ( H , I ) spinal cord from the same age, bundles of axons (arrows) leave the longitudinal tract and extend toward the midline of the spinal cord. Most of the misprojections appear to extend directly from the dorsal roots (*), whereas some grow out from more distal regions ( H , arrows). In addition, as shown in D , many overshooting fibers stop at the midline, but occasionally one or two (oblique arrows in H and I ) reach the other side of the spinal cord. L, Left; R, right; Ro, rostral; C, caudal. Scale bar, 100 μm.
- Figure 3.
Axon misprojections visualized by TAG-1 and neurofilament immunostaining. Transverse sections of the spinal cord from the brachial region of E11.5 embryos of different genotypes were stained with antibodies against TAG-1 ( A–C ) or neurofilament ( E , F ). Overshooting fibers are seen in the dorsal spinal cord (arrows) of the Slit1 −/− ;Slit2 −/− ( B , D ) or the Robo1 −/− ;Robo2 −/− ( C , F ) animal but not of the wild type ( A , C ). FP, Floor plate; MN, motor neurons. Scale bar, 50 μm.
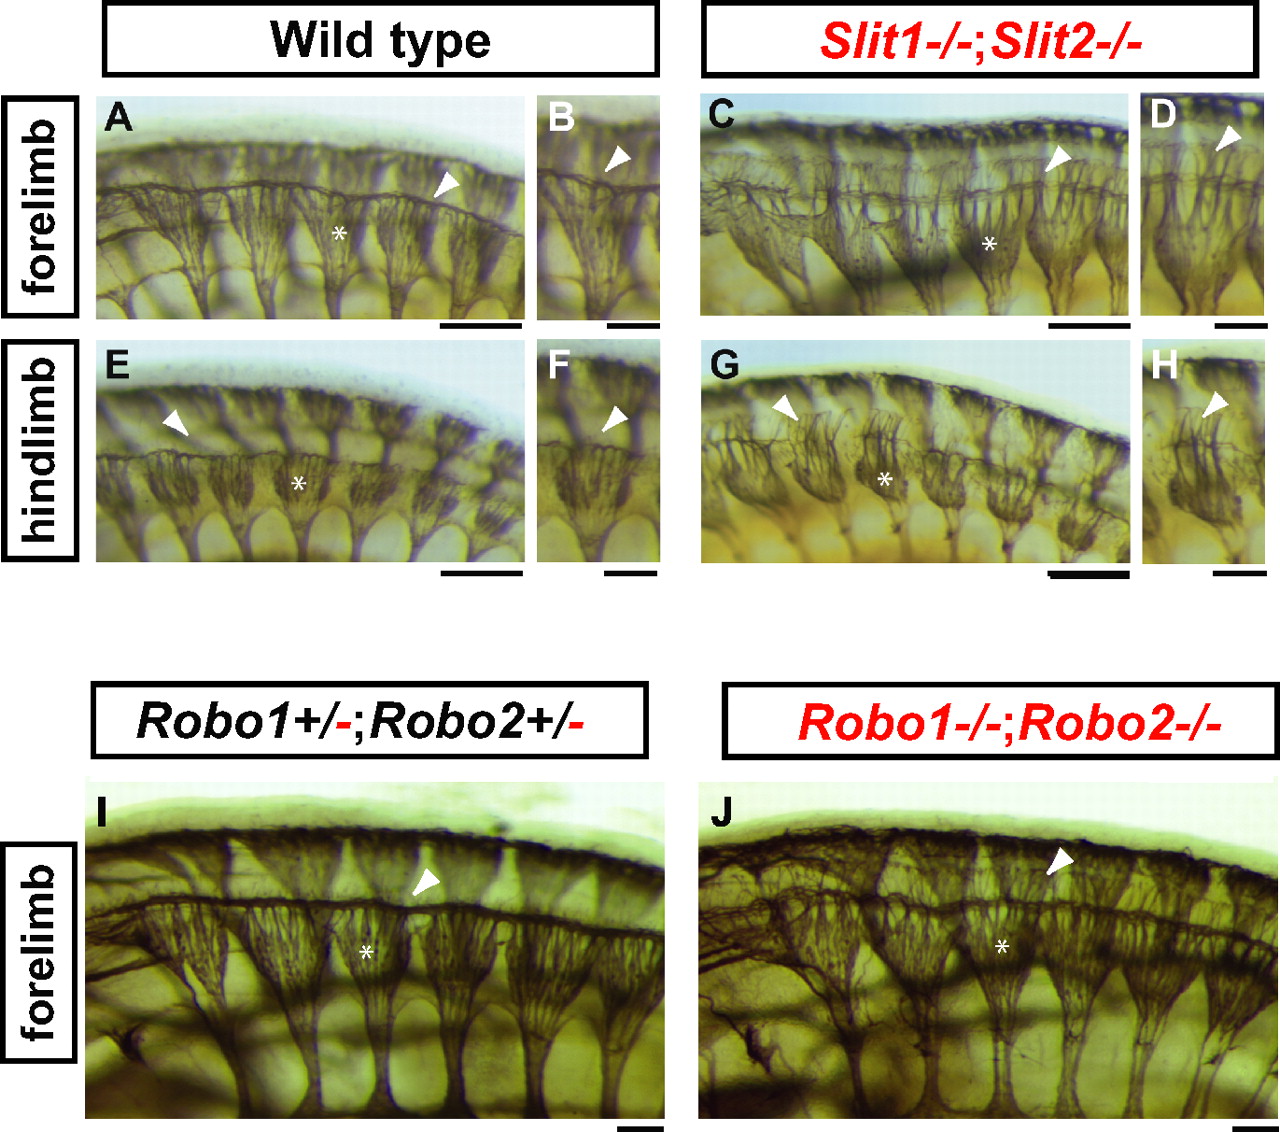
- Figure 4.
Whole-mount neurofilament staining in E10.5 mouse mutants. Sensory axonal projections are visualized by neurofilament immunostaining in the whole-mount preparation, which reveals all of the peripheral nerves in E10.5 embryos. Embryos were viewed from the dorsolateral side of the body, where individual DRGs as well as the bifurcated branches that form the longitudinal tracts at the DREZ (arrows) can be seen easily. In the wild-type ( A ) or the Robo1 +/− ;Robo2 +/− ( I ) embryo, the space (arrowheads) between the left and right dorsal funiculi is devoid of any labeled neurites. However, in either the Slit1 −/− ;Slit2 −/− ( C ) or the Robo1 −/− ;Robo2 −/− ( J ) animal, this space is populated by overshooting fibers that grow out from the DRG (*). In addition, the overshooting fibers can be seen in the hindlimb region ( G vs E ), where sensory afferents just reach the DRZ and start to bifurcate. Higher magnification views of sensory afferents at the DREZ are shown in B , D , F , and H . Scale bars: A , C , E , G , I , J , 100 μm; B , D , F , H , 50 μm.
- Figure 5.
Misguidance of central branches in mutant animals. A–G , Sensory projections visualized at the single-cell level by DiI labeling using iontophoresis. Images were taken from the lateral side of the spinal cord in an open book preparation. Normally, sensory axons bifurcate at the DREZ, and the resulting axons turn 90° and grow straight along the rostrocaudal axis ( A–C ). However, in the Slit1 −/− ;Slit2 −/− mutant spinal cords, one of the two longitudinal branches does not make the right angle turn but instead extends straight along the dorsoventral axis and grows into the spinal cord ( D–G , arrows). Sometimes, the daughter branches that have made correct turns later change growth direction abruptly along their normal trajectory (arrowheads). Note that some collaterals (*) are beginning to sprout from the bifurcated axons. Scale bar, 100 μm. H , The number of afferents that have or have not made the normal 90° turning angle is quantified and plotted as the percentage of the total labeled neurons analyzed. The total number is indicated below each genotype.
- Figure 6.
Slit2N induces transient collapse of young sensory axon growth cones in culture. A , B , E12 rat DRG neurons cultured in the presence of NGF ( A ) or NT-3 ( B ) were stained with rhodamine-phalloidin to reveal the growth cones after the treatment of buffer, Slit2N, or Sema3A for different time duration (0, 6, 15, and 30 min). The percentage of growth cones that have lost their fan shape from cultures treated with buffer control and Slit2N is plotted for each time point. Scale bar, 100 μm. C , Sequential phase contrast images of E12 rat sensory growth cones in culture taken from a time lapse movie. The growth cones were followed for ∼11 min before the addition of Slit2N to the medium (arrow). Note the reduction of growth cone size but no loss of filopodia between 21 and 31 min and the recovery of growth cones after 36 min. Scale bar, 40 μm.


Additional Files
Supplemental Data
Files in this Data Supplement:
- Supplemental Figure - Supplemental Legends
- supplemental material - Supplemental Figure 1
- supplemental material - Supplemental Figure 2
- supplemental material - Supplemental Figure 3
- supplemental material - Supplemental Figure 4, 5
- supplemental material - Supplemental Figure 6
- supplemental material - Supplemental Figure 7


