

Article Figures & Data
Figures
- Figure 1.
A–D, Morphological analysis of Purkinje cell dendrites of newborn WT mice treated with vehicle, EB, tamoxifen, or EB plus tamoxifen. Parasagittal sections of cerebella at 6 d of age were immunostained for calbindin (lobe IX). Scale bars, 10 μm. M, Molecular layer; P, Purkinje cell layer. E–H, Ultrastructural analysis of dendritic spines of Purkinje cells of newborn WT mice treated with vehicle, EB, tamoxifen, or EB plus tamoxifen. Parasagittal sections of cerebella at 6 d of age were immunostained for calbindin (lobe IX). Arrowheads indicate presumptive spine structures. Scale bars, 2 μm. PD, Purkinje cell dendrite.
- Figure 2.
A, Quantitative analysis of the maximal Purkinje dendritic length of newborn WT mice treated with vehicle, EB, tamoxifen, or EB plus tamoxifen. Each column and error bar represent the mean ± SEM (n = 10 in each group). *p < 0.05 versus vehicle; †p < 0.05 EB or tamoxifen vs EB plus tamoxifen; ☆☆p < 0.01 EB vs tamoxifen (by one-way ANOVA, followed by Duncan's multiple range test). B, Quantitative electron microscopic analysis of Purkinje dendritic spine density per unit area (100 μm2 field) of newborn WT mice treated with vehicle, EB, tamoxifen, or EB plus tamoxifen. Each column and error bar represent the mean ± SEM (n = 5 in each group). *p < 0.05 versus vehicle; †p < 0.05 and ††p < 0.01 EB or tamoxifen versus EB plus tamoxifen; ☆☆p < 0.01 EB versus tamoxifen (by one-way ANOVA, followed by Duncan's multiple range test).
- Figure 3.
A, B, Higher magnification of synaptic terminals in the molecular layers of vermal cerebella (lobe IX). Arrows indicate postsynaptic density (psd), synaptic vesicle (sv), synaptic cleft (sc), and presynaptic dense projections (pdp). PD, Purkinje cell dendrite. Scale bars, 500 nm. C, D, Quantitative electron microscopic analysis of Purkinje dendritic synapse density of newborn WT mice treated with vehicle, EB, tamoxifen, or EB plus tamoxifen. C, Axospinous synapse density. D, Shaft synapse density. Ultrathin sections (60 nm in thickness) containing calbindin-immunoreactive Purkinje dendrites in lobe IX at 6 d of age were analyzed. Each column and error bar represent the mean ± SEM (n = 5 in each group). *p < 0.05 and **p < 0.01 versus vehicle; †p < 0.05 and ††p < 0.01 EB or tamoxifen versus EB plus tamoxifen; ☆☆p < 0.01 EB versus tamoxifen (by one-way ANOVA, followed by Duncan's multiple range test).
- Figure 4.
A–C, Morphological analysis of Purkinje cell dendrites of WT (A), ArKO (B), and EB-treated ArKO (C; ArKO + Estradiol benzoate) newborn mice. Parasagittal sections of cerebella at 6 d of age were immunostained for calbindin (lobe IX). Scale bars, 10 μm. M, Molecular layer; P, Purkinje cell layer. D–F, Ultrastructural analysis of dendritic spines of Purkinje cells of WT (D), ArKO (E), and EB-treated ArKO (F) newborn mice. Parasagittal sections of cerebella at 6 d of age were immunostained for calbindin (lobe IX). Arrowheads indicate presumptive spine structures. Scale bars, 2 μm. PD, Purkinje cell dendrite.
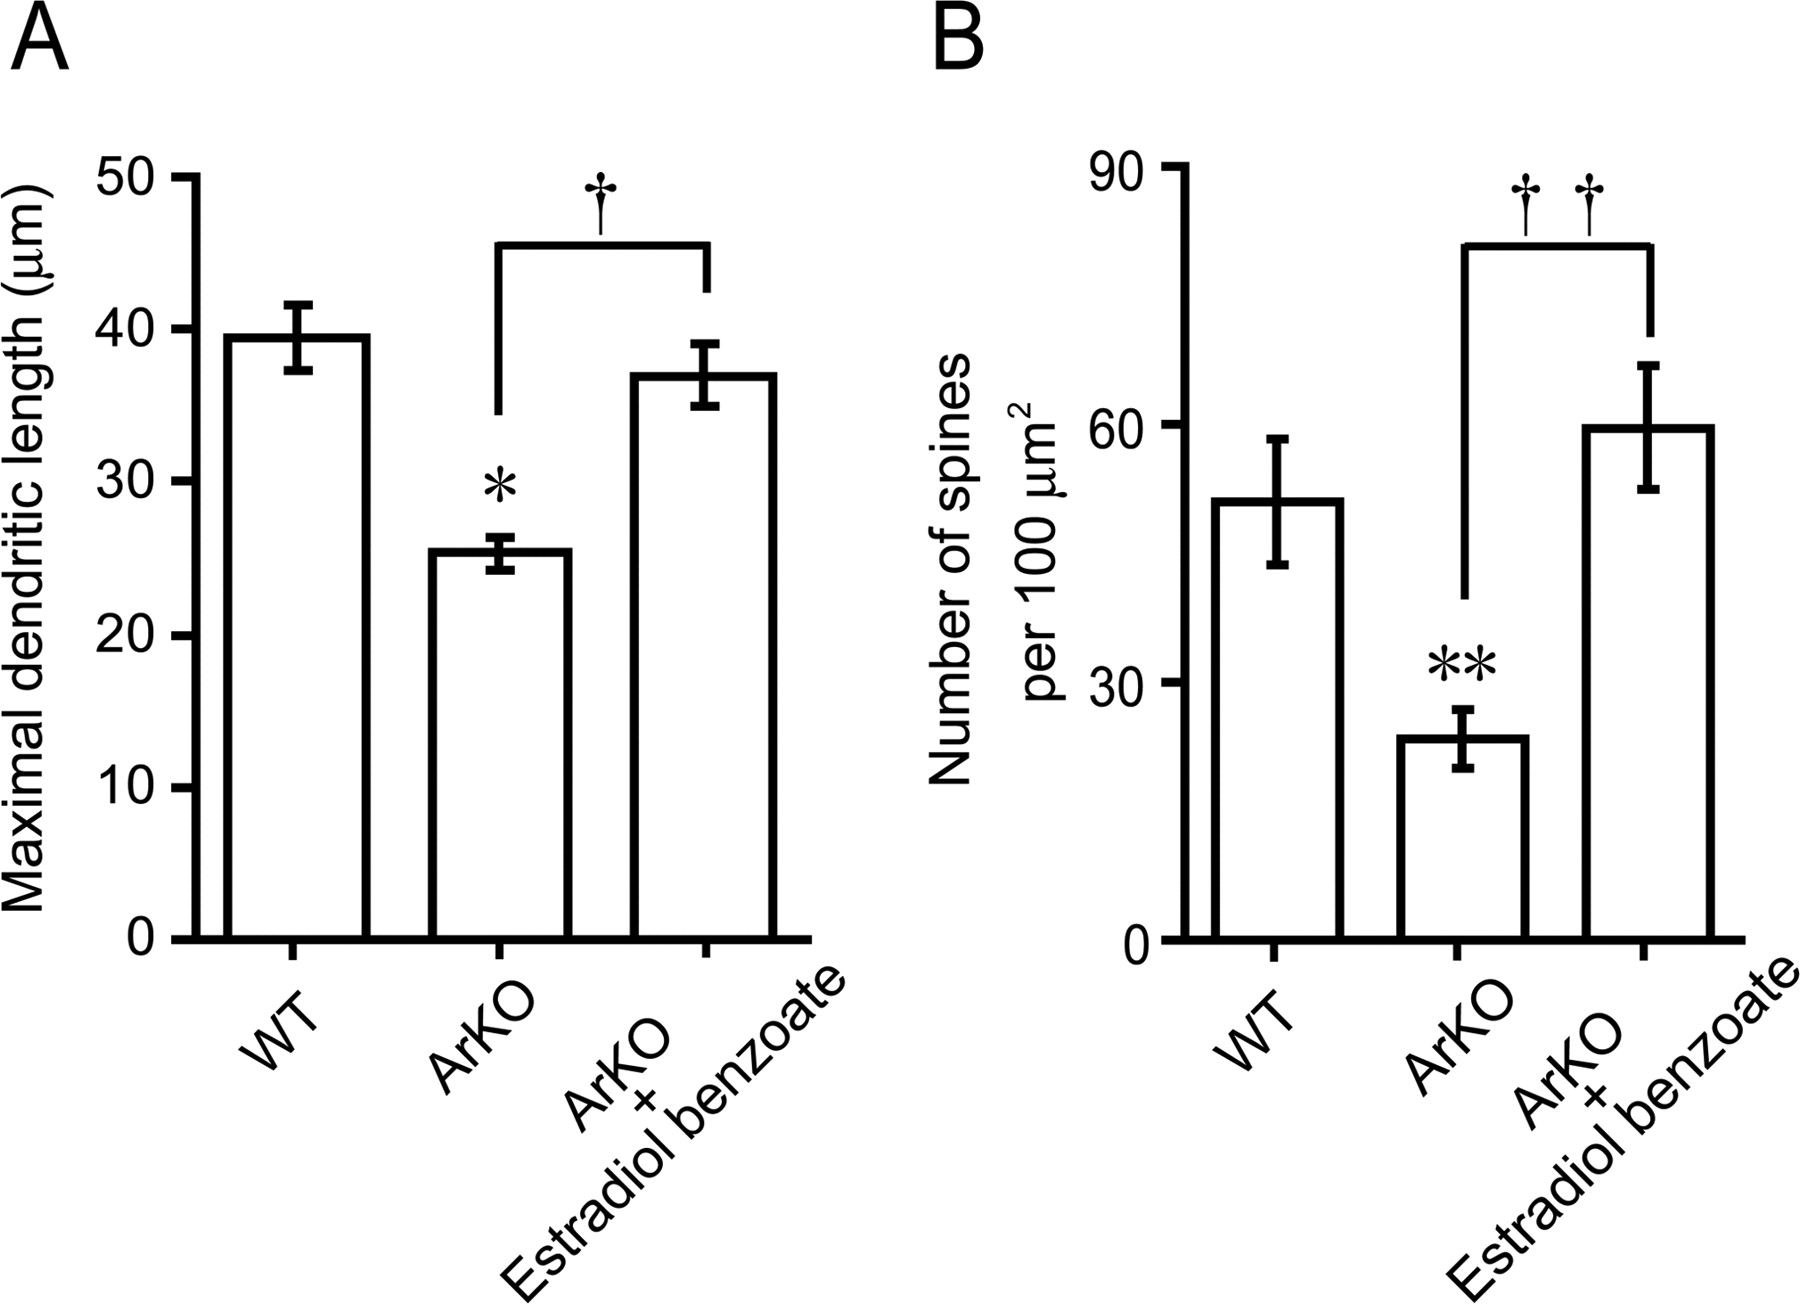
- Figure 5.
A, Quantitative analysis of the maximal Purkinje dendritic length of WT, ArKO, and EB-treated ArKO (ArKO + Estradiol benzoate) newborn mice. Each column and error bar represent the mean ± SEM (n = 5 in each group). *p < 0.05 versus WT; †p < 0.05 ArKO versus ArKO plus EB (by one-way ANOVA, followed by Duncan's multiple range test). B, Quantitative electron microscopic analysis of Purkinje dendritic spine density per unit area (100 μm2 field) of WT, ArKO, and EB-treated ArKO newborn mice. Each column and error bar represent the mean ± SEM (n = 5 in each group). **p < 0.01 versus WT; ††p < 0.01 ArKO versus ArKO plus EB (by one-way ANOVA, followed by Duncan's multiple range test).
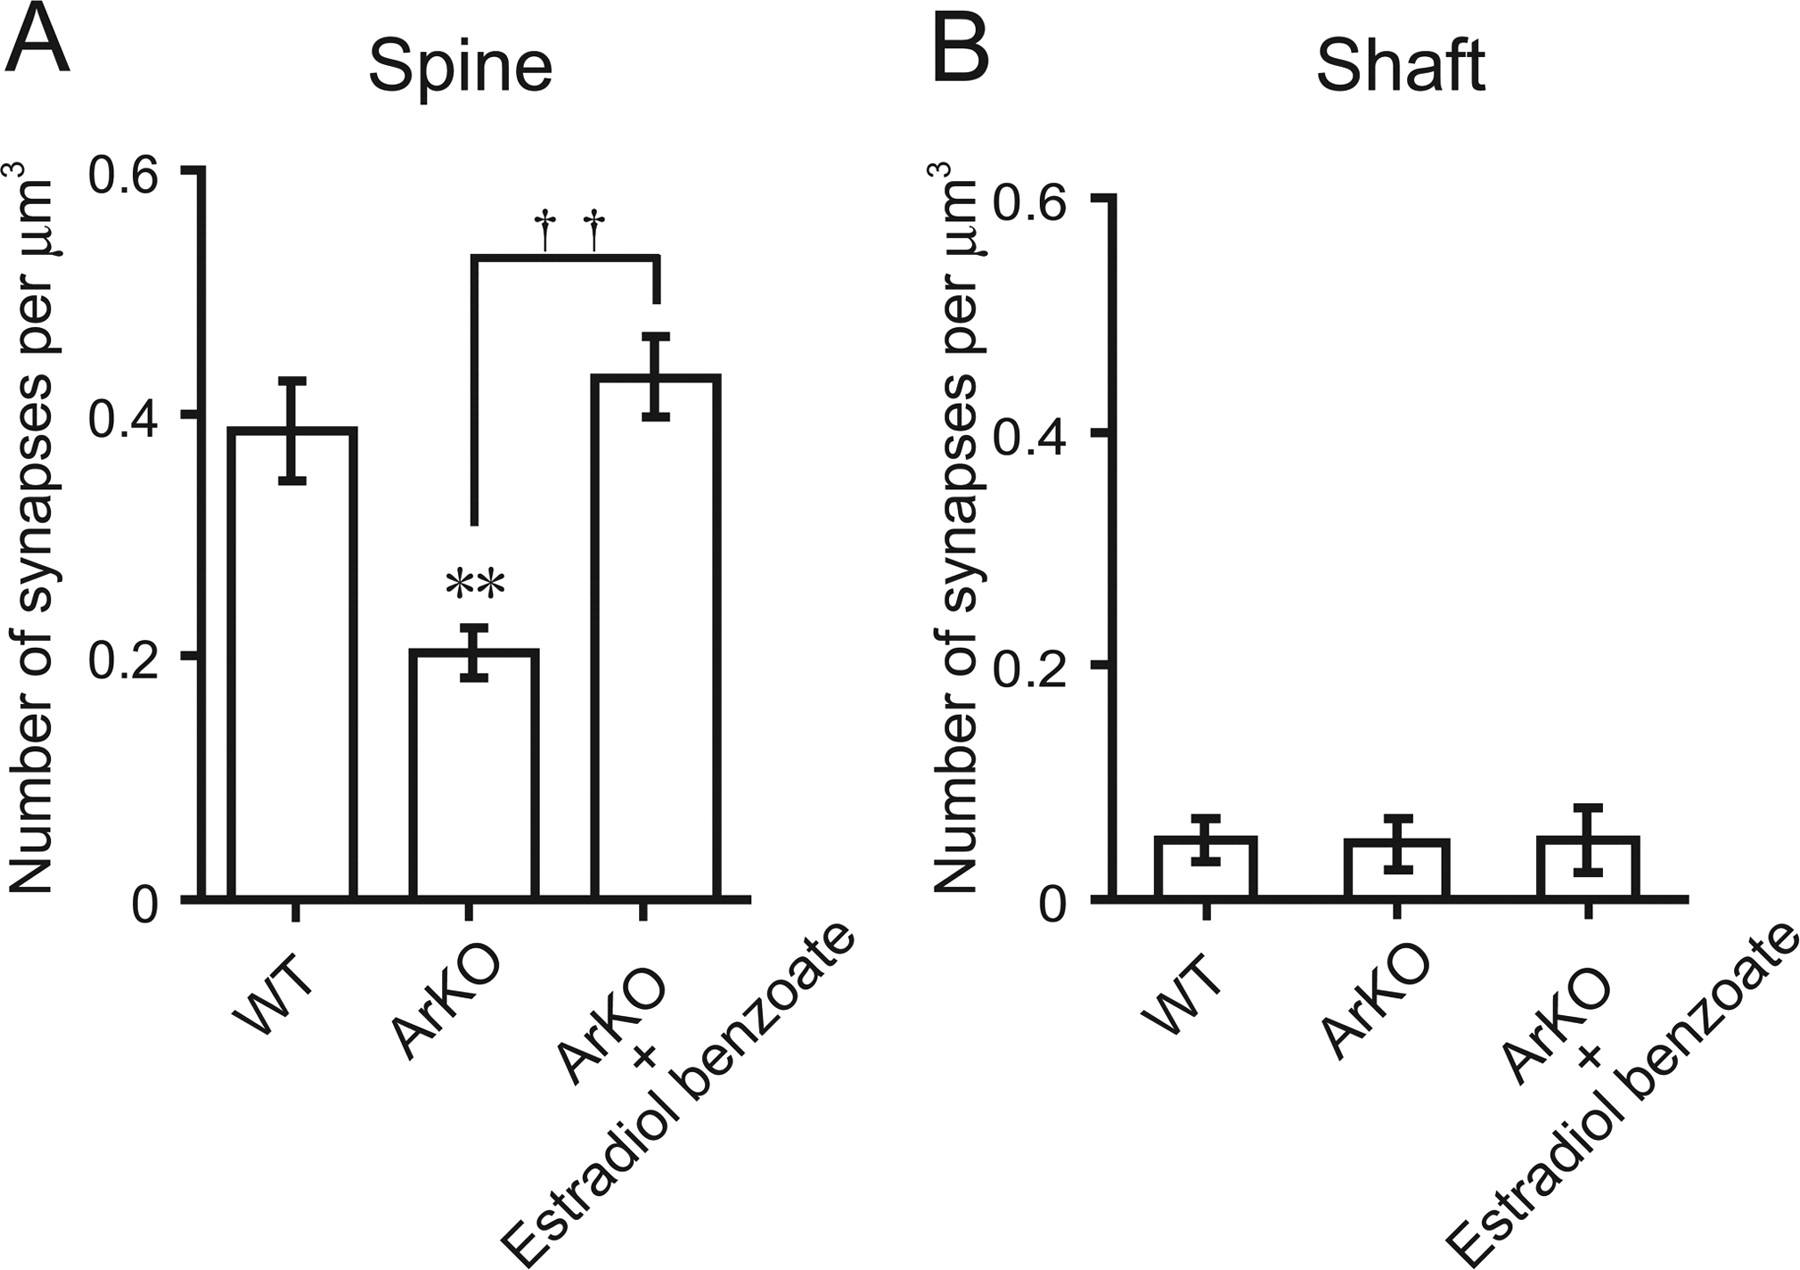
- Figure 6.
Quantitative electron microscopic analysis of Purkinje dendritic synapse density of WT, ArKO, and EB-treated ArKO (ArKO + Estradiol benzoate) newborn mice. A, Axospinous synapse density. B, Shaft synapse density. Ultrathin sections (60 nm in thickness) containing calbindin-immunoreactive Purkinje dendrites in lobe IX at 6 d of age were analyzed. Each column and error bar represent the mean ± SEM (n = 5 in each group). **p < 0.01 versus WT; ††p < 0.01 ArKO versus ArKO plus EB (by one-way ANOVA, followed by Duncan's multiple range test).
- Figure 7.
Changes in the level of BDNF in the neonatal cerebellum after estrogen manipulation. A, Comparison of the level of BDNF in newborn WT mice treated with vehicle, EB, tamoxifen, or EB plus tamoxifen. Each column and error bar represent the mean ± SEM (n = 8 in each group). *p < 0.05 versus vehicle; †p < 0.05 tamoxifen versus EB plus tamoxifen; ☆☆p < 0.01 EB versus tamoxifen (by one-way ANOVA, followed by Duncan's multiple range test). B, Comparison of the level of BDNF in WT, ArKO, and EB-treated ArKO (ArKO + Estradiol benzoate) newborn mice. Each column and error bar represent the mean ± SEM (n = 8 in each group). **p < 0.01 versus WT; †p < 0.05 ArKO versus EB-treated ArKO (by one-way ANOVA, followed by Duncan's multiple range test).
- Figure 8.
Changes in the level of NT-3 in the neonatal cerebellum after estrogen manipulation. A, Comparison of the level of NT-3 in newborn WT mice treated with vehicle, EB, tamoxifen, or EB plus tamoxifen. Each column and error bar represent the mean ± SEM (n = 8 in each group). B, Comparison of the level of NT-3 in WT, ArKO, and EB-treated ArKO (ArKO + Estradiol benzoate) newborn mice. Each column and error bar represent the mean ± SEM (n = 8 in each group).
- Figure 9.
A–C, Morphological analysis of Purkinje cell dendrites of newborn WT mice treated with vehicle, tamoxifen, or BDNF plus tamoxifen. Parasagittal sections of cerebella at 6 d of age were immunostained for calbindin (lobe IX). Scale bars, 10 μm. M, Molecular layer; P, Purkinje cell layer. D, Quantitative analysis of the maximal Purkinje dendritic length of newborn WT mice treated with vehicle, tamoxifen, or BDNF plus tamoxifen. Each column and error bar represent the mean ± SEM (n = 10 in each group). *p < 0.05 versus vehicle; †p < 0.05 tamoxifen versus BDNF plus tamoxifen (by one-way ANOVA, followed by Duncan's multiple range test).


Tables
- Table 1.
Morphological comparisons of Purkinje dendrites, dendritic spines, and dendritic synapses between male and female newborn WT mice
Group Number of mice Maximal dendritic length (μm) Number of cells per mm lobe IX Number of spines per 100 μm2 Number of spine synapses per μm3 Number of shaft synapses per μm3 Male 5 37.8 ± 1.6 38.3 ± 1.7 49.4 ± 1.8 0.331 ± 0.005 0.051 ± 0.002 Female 5 38.4 ± 2.2 39.5 ± 1.5 53.1 ± 5.4 0.363 ± 0.028 0.050 ± 0.008 -
There were no sex differences in these morphological parameters between male and female newborn mice.
-
- Table 2.
Comparison of Purkinje cell number among vehicle-, EB-, tamoxifen-, and EB plus tamoxifen-treated newborn WT mice
Group Number of mice Number of cells per mm lobe IX Vehicle 10 38.9 ± 1.5 EB 10 39.5 ± 1.0 Tamoxifen 10 39.5 ± 1.5 EB + tamoxifen 10 39.3 ± 1.5 -
There was no significant difference in the Purkinje cell number among different treatments.
-
- Table 3.
Comparison of Purkinje cell number among WT, ArKO, and EB-treated ArKO (ArKO + EB) newborn mice
Group Number of mice Number of cells per mm lobe IX WT 5 38.4 ± 2.4 ArKO 5 42.6 ± 5.6 ArKO + EB 5 36.9 ± 1.0 -
There was no significant difference in the Purkinje cell number among different groups.
-


