

Article Figures & Data
Figures
- Figure 1.
Effects of pulse pattern on saccades from an example FEF site. A, Five patterns of electrical microstimulation current pulses were delivered to the FEF (shaded region). Each vertical bar represents a biphasic current pulse (enlarged in inset); the horizontal lines represent time (t) increasing from left to right and with the first pulse at t = 0. Individual IPIs are shown above each pulse train in milliseconds. Each train consisted of eight current pulses delivered over 35 ms, resulting in a mean IPI of 5 ms (the final random train excepted). The pulse patterns depicted are (top–bottom, left–right) as follows: fixed (constant IPI), decel (linearly increasing IPI), accel (linearly decreasing IPI symmetrically opposite of decel), ro (same IPIs as decel and accel but in random order), and ri (random assignment of 8 pulses to 2-ms-wide bins with one pulse per bin; question marks denote random values for IPIs). B–G, Data and example analysis from a single FEF site are shown. B, Raw traces of saccade trajectory evoked at a suprathreshold stimulation current (65 μA) using the fixed pulse pattern are plotted. Open circles indicate saccade endpoints. C, The saccade probability is plotted against the stimulation current for each pulse pattern. D–G, For each stimulation-evoked saccade, latency (D), amplitude (E), peak velocity (F), and duration (G) of individual evoked saccades are plotted against saccade probability of the pulse pattern as obtained for the block of trials in which the saccades were evoked. Lines are shown for significant (p < 0.05) linear regressions.
- Figure 2.
Effect of pulse pattern across all FEF sites. A, Saccade probability is plotted against ordinal current (see Materials and Methods). The vertical dashed line represents the site threshold for all FEF sites (n = 14); stimulation currents from different sites are grouped relative to this line. The median number of trials per pulse pattern in each current group is shown in parentheses. Subsequent analyses focus on the three middling currents (shaded region). No saccades were detected in the no stimcondition. B, The saccade probability for each pulse pattern across the three middling currents is plotted. Significant pairwise differences (p < 0.001, Bonferroni corrected) between any two pulse patterns are shown as a solid line above the two bars. The dashed line represents the one nonsignificant (p > 0.07) difference: between ro and ri. Saccade probability is also indicated individually for monkey W (+) and monkey B (×). C, Effect of absolute current on pulse-pattern efficacy is shown for the three middling currents. For each block of trials, the relative saccade probability (log normalized to fixed) for each pulse pattern is plotted against the stimulation current, and linear regressions are fit (p > 0.05). D, Significant linear regressions (p < 10−16) of saccade peak velocity on amplitude are plotted for each pulse pattern across the three middling currents.
- Figure 3.
Effect of pulse pattern on saccade metrics. A–D, Four metrics are analyzed for saccades evoked at the three middling currents across all FEF sites: latency (A), amplitude (B), peak velocity (C), and duration (D). Plotted separately for each pulse pattern are linear regressions of log normalized values for single saccades on the saccade probability of the pulse pattern as obtained for the block of trials in which the saccades were evoked. Thick lines represent significant (p < 0.05) regressions.
- Figure 4.
Relationship between saccade latency and amplitude for saccades evoked with different pulse patterns. A–E, Log normalized values of amplitude are plotted against log normalized values of latency for individual saccades at the three middling currents across all FEF sites separately for each pulse pattern: fixed (A), decel (B), accel (C), ro (D), and ri (E). Least-square fits are superimposed (dark blue lines). F, The fits are replotted on the same axes with colors and line styles as in previous figures. In addition, histograms of saccade latency (right axis) are superimposed for each pulse pattern, normalized by the total number of saccades in that pulse pattern. The common range of latencies in which ≥95% of saccades occurred for each pulse pattern is denoted by gray shading. This range is enlarged in inset.
- Figure 5.
Saccade-triggered average of random pulse trains. A, B, Frequency distributions are shown for the IPIs drawn for ro (A) and ri (B) across all trials, with downward arrows indicating the mean IPI. C, Train profiles (mean IPI vs interval position) for accel (red circles and line) and decel (blue circles and line) represent our model for the most and least effective pulse patterns, respectively, and are provided for comparison to the random pulse patterns. D, E, Individual pulse trains from ro (D) and ri (E) were stratified into saccade trains and null trains depending on whether they did or did not evoke a saccade, respectively. The train profiles for the saccade trains (red circles) and null trains (blue circles) are plotted. Error bars indicate SEM. Significant linear regressions (p < 0.05) of individual IPIs on interval position are superimposed on the train profiles for saccade trains (red lines) and, separately, for null trains (blue lines) from ro (dashed lines) and ri (dotted lines). The distribution of mean IPIs for ri is lower than that for ro because ri trains could end before, but could not exceed, the 35 ms duration imposed on all other patterns.
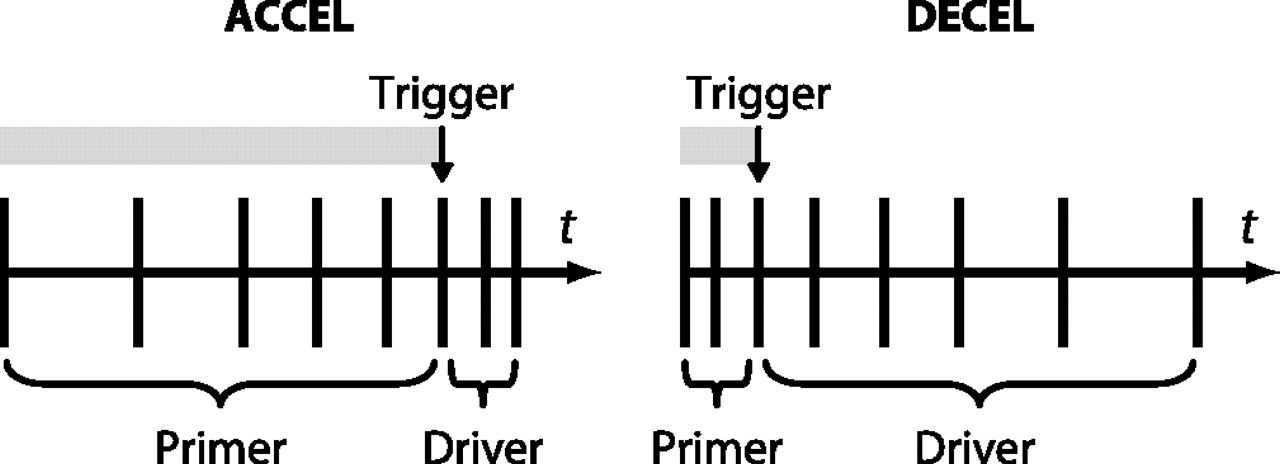
- Figure 6.
Primer–trigger–driver model of the saccade control signal. The pulse patterns for accel (left) and decel (right) are depicted, and their proposed functional phases are labeled. Each vertical bar represents a biphasic microstimulation pulse; the horizontal lines represent time (t) increasing from left to right. The saccade initiation signal (the “trigger”; black downward arrows) is associated with high-frequency pulses and thus occurs more toward the end of accel but more toward the beginning of decel (the exact location of the trigger is approximate). Because the trigger initiates the saccade, a later trigger is associated with greater saccade latency, as represented by the length of the gray bar. The late trigger of accel is consistent with accel saccades demonstrating the longest latencies of all pulse patterns (decel saccades with their early trigger were of the shortest latency). Any pulses occurring before the trigger are termed the “primer,” and those occurring after are termed the “driver.” The primer is associated with preparing the movement and providing a pedestal of activity on which the trigger acts. Therefore, the greater the primer (in number of pulses and duration), the more likely the trigger will successfully evoke a saccade. The greater primer of accel is consistent with accel being the most effective pulse pattern (decel with its lesser primer was the least effective). The driver is associated with extending the eye movement once it has been initiated. The greater driver of decel is consistent with decel saccades commanding the largest amplitude, fastest peak velocity, and longest duration of all pulse patterns (the opposite was true for accel with its lesser driver).


Additional Files
Supplemental Data
Files in this Data Supplement:
- supplemental material - Supplemental material


