

Article Figures & Data
Figures
- Figure 1.
The time course of AMPA-R and NMDA-R EPSCs during development. A1 , EPSCs from an E12 NM neuron comprised AMPA-R and NMDA-R components, separable with specific antagonists, 100 μm APV and 20 μm NBQX, respectively. A2 , AMPA-R and NMDA-R EPSCs (gray lines) isolated by subtraction of current after receptor block from control records. Decays were generally best fit with the sum of two exponentials or, in a few cases such as the NMDA-R EPSC in this example, a single exponential. The exponential fits (black thin lines) are superimposed on the EPSC decay. B , EPSC recorded from an E18 NM neuron was dominated by the AMPA-R component. C , The developmental profile of decay kinetics for AMPA-R EPSC. n = 5–9 terminals for each age. D , Decay kinetics for NMDA-R EPSC during the same development period. C , D , Data from single-axon EPSCs (see Fig. 3). n = 7–18 terminals for each age.
- Figure 2.
The sensitivity of the NMDA-R to ifenprodil remained unchanged during development. A , Ifenprodil (10 μm) reversibly blocked ∼60% of the NMDA-R EPSC. The synaptic response was evoked with electrical stimulation; each trace is the average of three to five sweeps. B , Ifendprodil (10 μm) reversibly blocked about half of the whole-cell response to NMDA puff application (500 μm, 1 s) in another E14 neuron. C , The bar graph summarizes ifenprodil inhibition of NMDA-R EPSC (n = 3–6 cells) and whole-cell response (n = 3–13 cells) at different ages. No significant difference was detected between the two age groups or between the two types of response mediated by NMDA-R.
- Figure 3.
Developmental changes in the strength of single-axon EPSCs mediated by AMPA-R or NMDA-R. A , Single-axon EPSCs recorded in neurons from different ages, with the average responses (red lines) superimposed. Note the changing relative amplitudes of the slower NMDA-R component and faster AMPA-R component. B , Summary of the amplitude of single-axon AMPA-R and NMDA-R EPSCs during development. The AMPA-R EPSC almost continuously grew in strength, whereas the NMDA-R EPSC displayed a bell-shaped growth curve. In neurons from the caudal end of NM (red triangles), the difference between AMPA-R and NMDA-R EPSCs was less. Note log scale. C , The relative strength of single-axon EPSCs mediated by NMDA-R or AMPA-R declined throughout the developmental period. A more modest reduction in the relative strength was seen in caudal neurons (red triangle).
- Figure 4.
Single-axon EPSCs induced with 4-AP. A , Left, Spontaneous EPSCs (sEPSCs) in an E14 neuron after bath application of 30 μm 4-AP. Right, sEPSCs from the same cell overlaid. Four distinct amplitude groups can be discerned corresponding to four inputs. B , sEPSC amplitudes seen in each cell at three ages. For each cell, mean amplitudes in each size group are connected by a vertical line. Thus, the number of points along each line is the number of inputs. Note log scale. C , Cumulative percentage plot of the data from B , preserving the grouping according to age (▵ for E12, red ○ for E14, and ♦ for E16). D , Summary of the estimated number of inputs at various ages. Significant decrease was detected between the consecutive age groups. E , The average amplitude of NMDA-R component in the sEPSCs changed with age. The development of NMDA-R component was bell-shaped, peaking at E14. F , The relative strength of NMDA-R over AMPA-R component of the sEPSCs declined continuously during development.
- Figure 5.
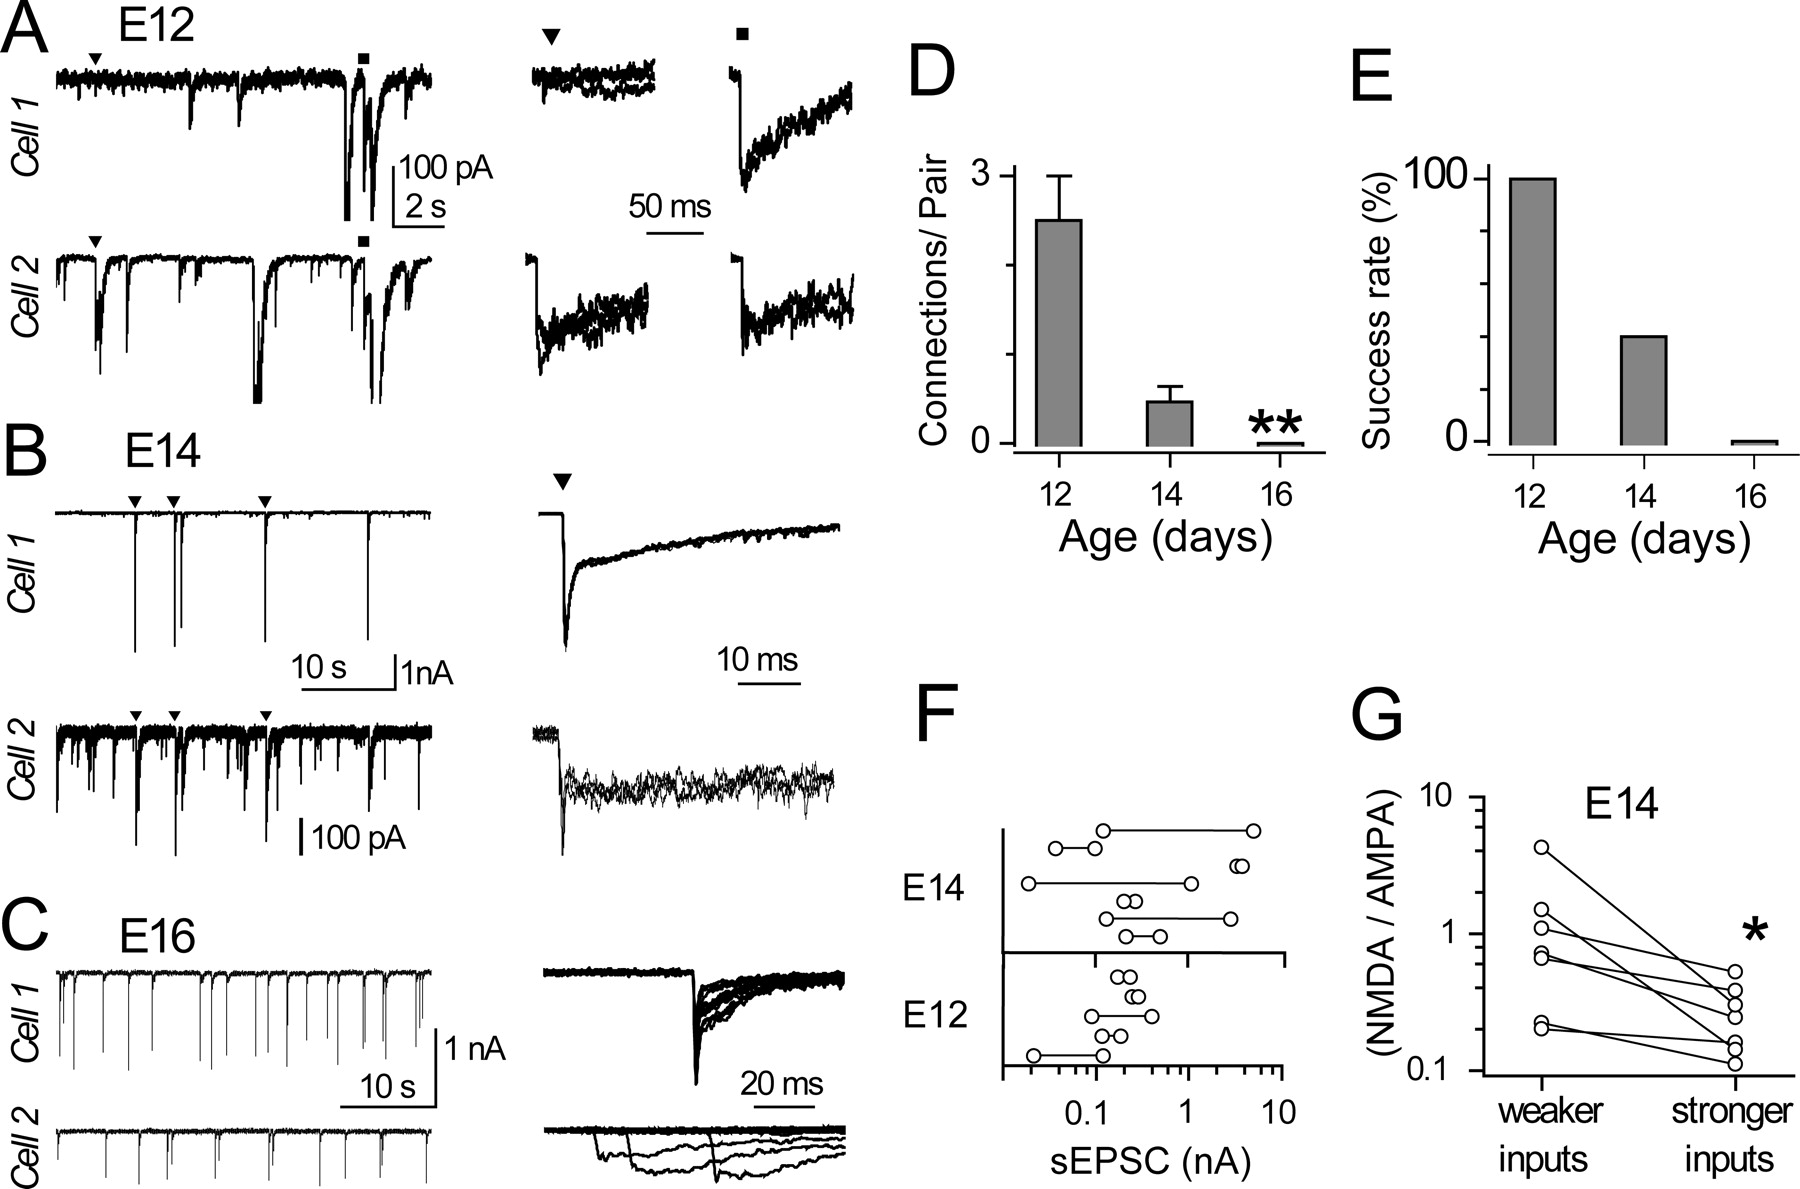
Dual recordings of spontaneous EPSCs. A , Top and bottom traces in the left panel show spontaneous EPSCs simultaneously recorded from adjacent E12 neurons, in the presence of 30 μm 4-AP. Pairs of synchronous events with similar shape or relative amplitudes were presumed to be generated by the same axon. Examples from two such axonal inputs, labeled ▾ and ■, are overlaid and displayed in the right panel. For the pair on the left (▾), the sEPSC in cell 1 is tiny when compared with that in cell 2, whereas for the pair on the right (■), both sEPSCs are comparable in size. B , Similar dual recording from adjacent E14 neurons revealed only one pair of synchronous sEPSCs. Note the vertical scale differs by tenfold between the top and bottom traces. C , Another dual recording from adjacent E16 neurons gave no synchronous sEPSCs, as demonstrated on the right by the random misalignment of sEPSCs in bottom traces when the sEPSCs in top traces were aligned. D , The average number of instances of paired connections found in all of the dual recordings made at various ages. A significant decrease was detected, consistent with the reduction in axon bifurcation during development. E , The success rate of finding any common innervation for all of the dual recordings at a given age. The number of dual recordings were 3 for E12, 16 for E14, and 4 for E16. F , Peak AMPA-R amplitude of sEPSCs, with the horizontal line connecting EPSCs produced by the same axon in adjacent neurons. G , At E14, the NMDA-R component is significantly more prominent in the weaker sEPSCs than in the stronger ones when each two synchronous sEPSCs were compared side-by-side.
- Figure 6.
mEPSCs showed varied contribution from NMDA-R and AMPA-R. A , Examples of mEPSCs recorded in the one E14 neuron in the presence of 1 μm tetrodotoxin. The addition of 100 μm APV helped confirm the existence of predominantly AMPA-only mEPSCs, NMDA-only mEPSCs, or those with mixed contribution from AMPA-R and NMDA-R (“Mixed”). Right, Portions of the recording on the left on an expanded time scale, highlighting the apparent effect of APV. B , From the same neuron in A , overlaid mEPSCs classified as AMPA only, NMDA only, or mixed. C , Average frequency of mEPSCs shows a fivefold increase during development (p = 0.02, ANOVA), consistent with an increase in the number of release sites or release probability. D , The average peak amplitude of mEPSCs showed only a modest (less than twofold) but significant increase during development (p = 0.0002, ANOVA). E , The average amplitude of NMDA-R component (excluding AMPA only events) decreased significantly between E14 and E15 (p = 0.005, ANOVA), consistent with the removal of NMDA-R from postsynaptic sites. F , The relative fraction of all events in the three categories and linear fits. During development, the relative fraction of AMPA-only or mixed events changed significantly (p = 0.0002, ANOVA), whereas NMDA-only mEPSCs remained rare (p > 0.05, ANOVA).
- Figure 7.
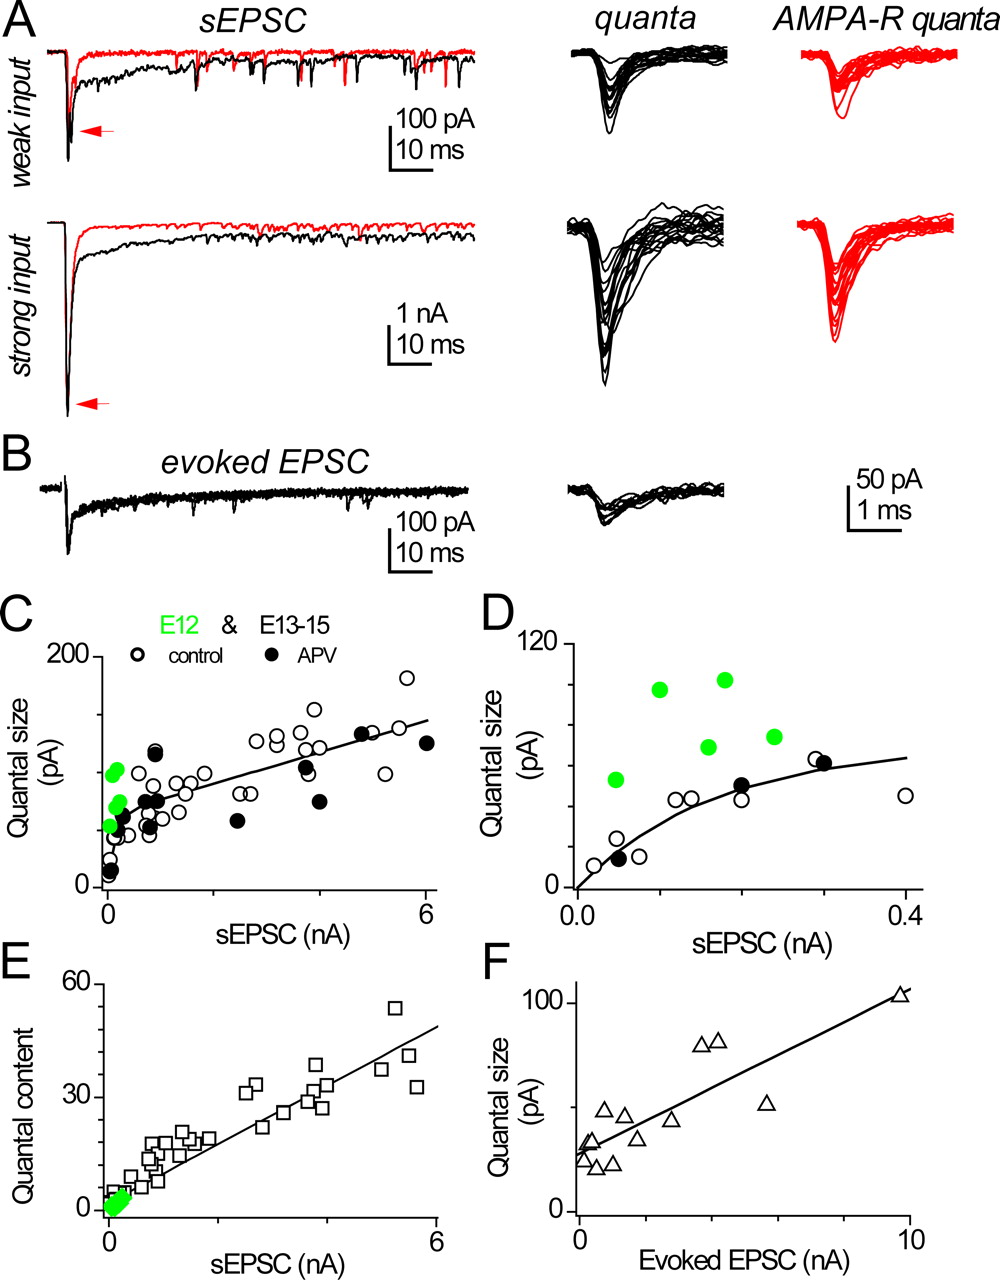
Delayed releases after spike-triggered EPSCs at intermediate age. A , Left, Spontaneous EPSCs (sEPSCs) and numerous delayed-release events in the presence of 50 μm 4-AP. Data in this example are from paired recordings in adjacent E14 neurons. Note the tenfold difference in vertical scales. The addition of 100 μm dl-APV blocked all NMDA-R, which had only minor contribution to the peak response (red line). Right, Overlaid delayed releases collected from the tails of sEPSCs, with (red) or without APV, and the smaller delayed releases were preceded by the weaker sEPSC. B , In an alternative protocol, delayed releases were collected in another E14 neuron after the electrically evoked EPSCs, in the presence of 3 mm SrCl2. C , The quantal size, as measured with the average peak amplitude of delayed releases, shows strong positive correlation to the amplitude of sEPSC for data from E13–E15 chicks (black symbols). The fitted line was of the following form: quantal size = (63 pA + 0.014 × EPSC) × (1 − exp(−EPSC/134 pA)) (r = 0.79, p < 0.0001). This curve has an exponential rise followed by a linear slope. Data were pooled from 19 neurons aged E13–E15, with each neuron contributing data at 1–4 distinct sEPSC amplitudes. Open symbols are recordings in control solutions, whereas filled symbols are from APV-containing solutions to block NMDA-R. Green symbols are data from five E12 synapses. D , Same as C but different scale. E , the quantal content, the ratio of sEPSC amplitude over average quantal size, is linearly correlated with the amplitude of sEPSC (r = 0.93, p < 0.0001). Black symbols are P13–P15 cells, whereas green symbols are from E12. F , The correlation also appears between the average quantal size and the amplitude of stimulus evoked EPSC recorded in 3 mm SrCl2 plus 3 mm CaCl2 (0.86, p = 0.0002), indicating that it is not an artifact related to the 4-AP used in triggering sEPSCs. Data were pooled from seven neurons aged E14. When multiple axons were stimulated, averaged amplitude of EPSC was used.


Additional Files
Supplemental Data
Files in this Data Supplement:
- supplemental material - Supplemental Figure 1 The incremental activation of multiple axons and the separation of single-axon EPSCs. A, a series of EPSCs recorded from an E12 neuron when the stimulation pulse duration was varied systematically between 10-200 μs at 10 μs interval. This protocol was repeated 4X. The inset plots the amplitude of the NMDA-R EPSC against the pulse duration, and the dash horizontal lines represent discrete components of EPSC amplitude. Each vertical jump in the level is presumed to be the result of the activation of an additional axon. B, Similar experiments in an E14 neuron revealed only two components of NMDA-R EPSC amplitude. The arrowhead points to a late-arriving EPSC riding on top of the smaller EPSC, and its existence confirms the larger EPSC was the result of linear summation of two EPSCs. C, only a single level of EPSC was found in an E16 neuron. D, despite variation in the number of inputs found within each age group, significant reduction in the mean was seen between each age group (Kolmogorov-Smirnov test). The means for each age group are indicated by a vertical dashed line and are 3.1�0.3 (E12), 1.9�0.2 (E14-15), and 1.2�0.1 (E16).


