

Article Figures & Data
Figures
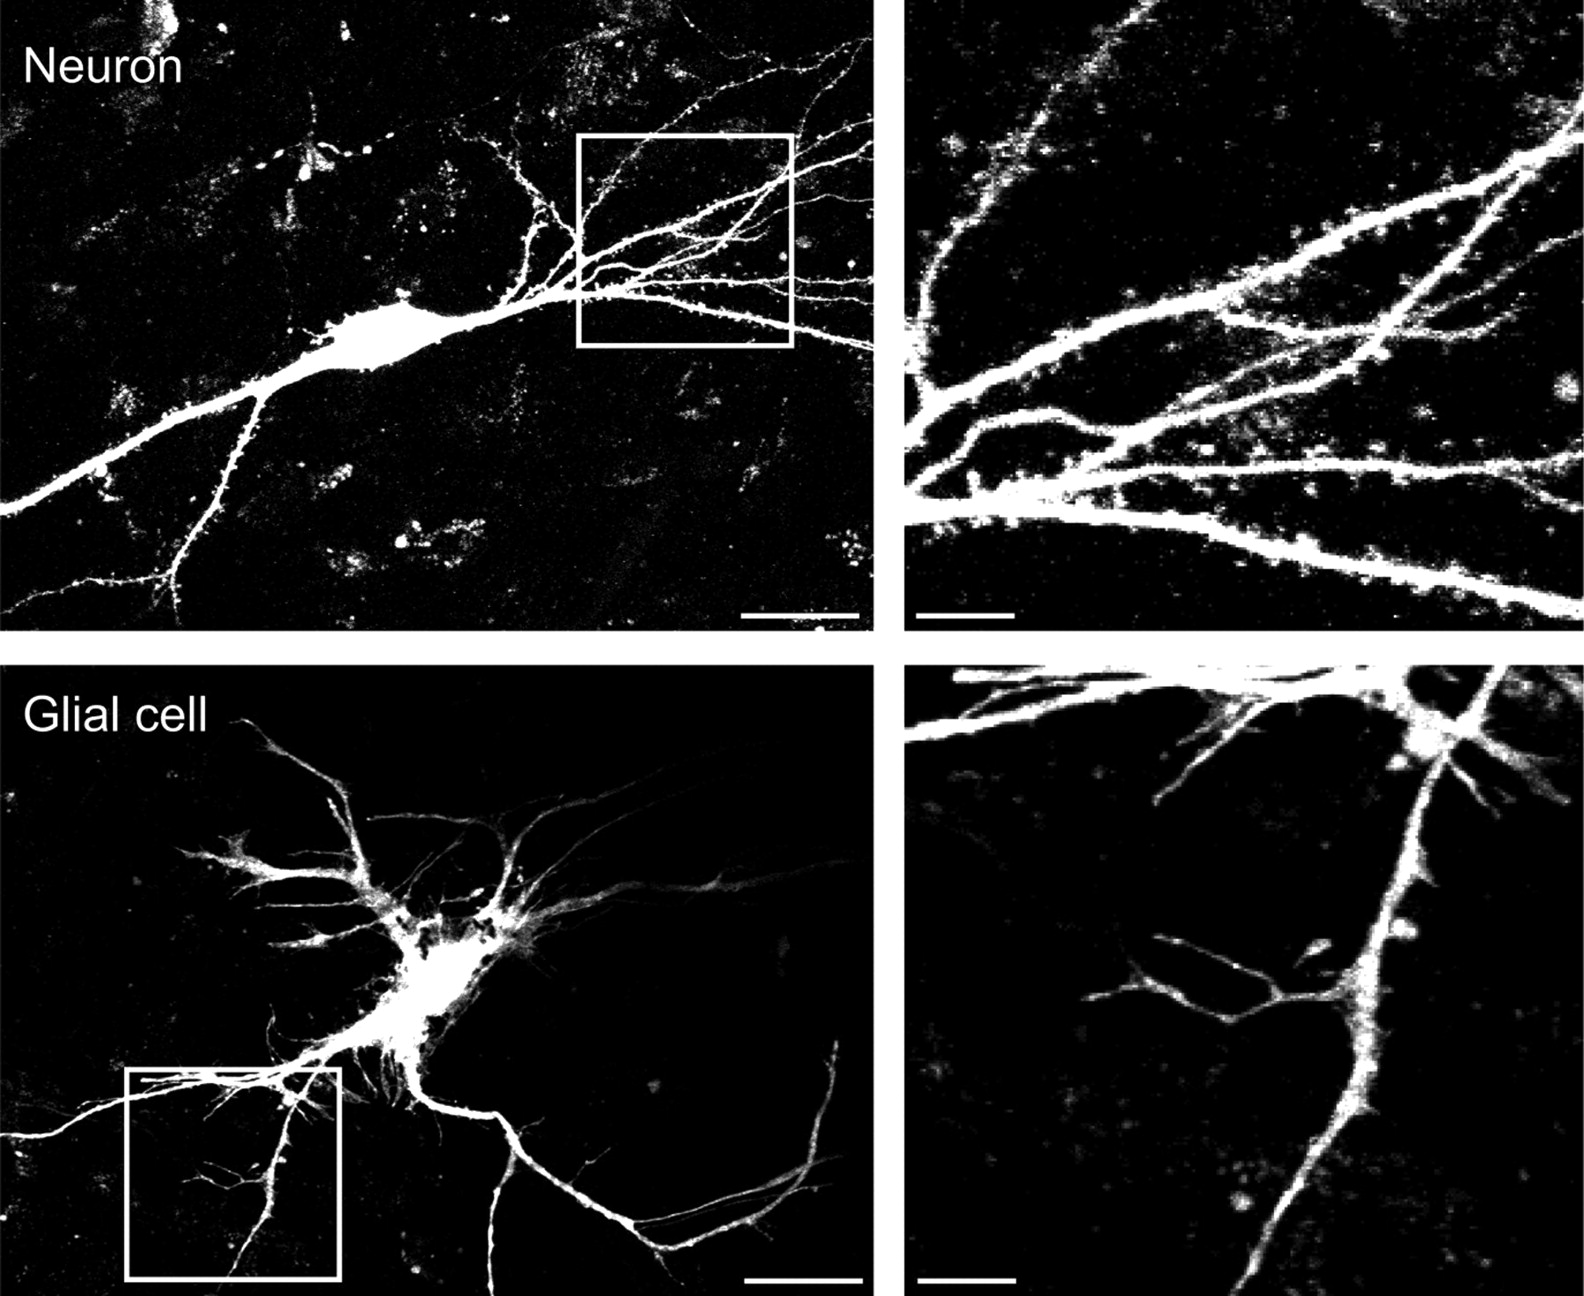
- Figure 1.
Labeling of astrocytic filopodia with GFP. Low-power (left) and high-power (right) images of a GFP-transfected neuron (top row) and glial cell (bottom row) in a hippocampal slice culture demonstrating the differences in the morphology of their branches and fine processes. Scale bars: left, 15 μm; right, 4 μm.
- Figure 2.
Constitutive morphological dynamics in astrocytes. A , B , High-power time-lapse image sequences of filopodia in two GFP-transfected glial cells. Arrows indicate retraction and extension at one site during the baseline activity period. Asterisks indicate ongoing changes in lamellapodia during baseline. Time of image capture is indicated in minutes from start. Scale bar, 4 μm.
- Figure 3.
EphrinA3-Fc induces filopodial outgrowth and elongation. A , B , Time-lapse image sequences of filopodia in two GFP-transfected astrocytes treated with the ephrinA3-Fc construct. Arrows indicate extensive elongation of filopodia ( A ) and extension of new filopodia at two sites in another cell ( B ). Time of image capture indicated in minutes relative to the addition of ephrinA3-Fc (7.6 μg/ml). Scale bar, 4 μm. C , Time-lapse image sequences of filopodia in a GFP-transfected astrocyte treated with the ephrinB1-Fc construct. Time of image capture is indicated in minutes relative to the addition of ephrinB1-Fc (7.6 μg/ml). Scale bar, 4 μm. No changes in filopodia were apparent. D , Plot of the time course of the change in total process length, normalized to the mean length during the baseline period, after addition of 7.6 μg/ml ephrinA3-Fc (black; n = 6 cells) or control saline as a vehicle control (gray; n = 6 cells). Each line represents the values for one cell, normalized to its own mean pre-ephrin value. Significant difference is indicated at times >15 min after application of ephrinA3-Fc (p < 0.05; Friedman's ANOVA). E , Summary of ephrinA3-Fc (n = 6 cells) and ephrinB1-Fc (n = 4 cells), and ephrinB2-Fc (n = 10 cells) effects on the number of filopodial per 30 μm of astrocytic process, the length of pre-existing filopodia, the total process length, and the average length of astrocytic filopodia. Each cell was normalized to its own mean value during the 30 min baseline period. **p < 0.01; *p < 0.05; ANOVA. Only ephrinA3-Fc promoted filopodial outgrowth and extension.
- Figure 4.
Release of endogenous ephrinAs also promotes filopodia growth. A , Images of an astrocytic process 10 min before and 30 min after addition of PI-PLC at 37°C to cleave GPI-anchored endogenous ephrinAs. Note the increase in process number in this example. Scale bar, 4 μm. B , Summary of PI-PLC effects on the normalized number of filopodia per 25 μm of astrocytic process, the length of pre-existing filopodia, the total process length, and the average length of astrocytic filopodia at 37°C (n = 4 cells) and 22°C (n = 4 cells) (**p < 0.01; *p < 0.05; ANOVA). C , EphA4Rs were immunoprecipitated from rat hippocampal slice cultures, and their level of activation was assayed by probing with an anti-phosphotyrosine antibody (top row). Increased phosphotyrosine labeling was seen after application of ephrinA3-Fc and after application of PI-PLC at 37°C but not at 22°C (bands ≈ 98 kDa). The membranes were stripped and reprobed with the anti-EphA4R antibody to control for loading (bottom row).
- Figure 5.
Expression and activation of EphRs in astrocytes. A , PCR analysis of EphR expression in adult rat astrocytes acutely dissociated from hippocampal str. radiatum reveals the large number of EphRs they express. B , Immunocytochemical staining for anti-EphA4R (red) in hippocampal slice cultures from S100B-GFP mice at high and low magnification reveals that the filopodial processes of hippocampal astrocytes express the EphA4R. Scale bars: B , top left, 15 μm; bottom right, 4 μm.
- Figure 6.
EphrinA3-Fc- and PI-PLC-induced outgrowth is blocked in astrocytes expressing a dominant-negative EphAR. A , Images of filopodial processes 5 min before and 45 min after addition of ephrinA3-Fc (left column, 7.6 μg/ml) or PI-PLC (right column) at 37°C in astrocytes transfected with a dominant-negative kinase-dead EphA4 construct. Scale bar, 5 μm. B , Summary of the effects of addition of the ephrinA3-Fc construct or PI-PLC on the normalized number of filopodia per 25 μm of astrocytic process, the length of pre-existing filopodia, the total process length, and the average length of astrocytic filopodia, measured 30 min after addition of the ephrinA3-Fc construct and normalized to mean pre-ephrin values. All values are not significantly different (ANOVA).
- Figure 7.
EphrinA inhibits glial release of glutamate. A , DHPG-evoked SICs in a CA1 pyramidal cell before and 15 min after application of ephrinA3-Fc (7.6 μg/ml), recorded under whole-cell voltage clamp (−50 mV) in the presence of Mg2+-free saline containing DNQX (40 μm), TTX (1 μm), bicuculline methobromide (40 μm), CGP52432 (2 μm), and DHPG (3 μm). B , Cumulative probability plots of all intervals between SICs during the 10 min control period and for the time from 15 to 50 min after application of a control Fc-construct (left graph; 5 cells); after addition of 7.6 μg/ml ephrinA3-Fc (right graph; 7 cells); and without addition of any construct (middle graph; 5 cells). C , Mean interevent intervals for astrocytes in B are plotted for control saline, control-Fc, and ephrinA3-Fc. Only ephrinA3-Fc produced a significant change in the distribution (7 of 7 cells; Komolgorov–Smirnov test; *p < 0.05).
- Figure 8.
EphrinA does not affect neuronal NMDAR sensitivity. A , Representative NMDAR-mediated responses are shown before and 50 min after the application of ephrinA3-Fc (7.6 μg/ml). Responses were elicited with Schaffer collateral stimulation (top traces) in control saline with the cell voltage clamped at −50 mV or with photolysis of caged glutamate at extrasynaptic dendritic sites (bottom traces) in Mg2+-free saline with the cell voltage clamped at −70 mV. All salines contained DNQX (40 μm), bicuculline methobromide (40 μm), and CGP52432 (2 μm). B , Images of dye-filled CA1 cell dendrites used for uncaging experiments at high and low magnification. Scale bar, 4 μm. The UV spot used for uncaging was targeted to dendritic shaft sites at distances of >1 μm from the base of dendritic spines to ensure that primarily extrasynaptic NMDARs were stimulated. C , Summary graphs indicating that application of ephrinA3-Fc had no effect on the amplitude or decay time of NMDA receptor-mediated currents elicited with either synaptic stimulation or photolysis of caged glutamate at extrasynaptic sites.
- Figure 9.
EphrinAs inhibit spontaneous calcium oscillations in astrocytes. A , Image of peak fluo-4 emission from cultured primary mouse astrocytes indicating regions of interest used for measurements of intracellular [Ca2+] oscillations shown at right before and 30 min after application of ephrinA3-Fc (7.6 μg/ml). Scale bar, 10 μm. B , Normalized frequency of intracellular [Ca2+] oscillations in astrocytes at various times after treatment with ephrinA3-Fc (circles; n = 84 cells) or control Fc (squares; n = 71 cells). Significant difference is indicated at times after 10 min (p < 0.05, Friedman's ANOVA). C , We observed no significant difference in the amplitude of Ca2+ oscillations in astrocytes treated with either ephrinA3-Fc or Fc-controls, compared with their starting amplitude (Friedman's ANOVA, p > 0.05).


Additional Files
Supplemental Data
Files in this Data Supplement:
- supplemental material - Supplemental Legend
- supplemental material - Supplemental Figure 1
- supplemental material - Supplemental Figure 2


