

Article Figures & Data
Figures
- Figure 1.
Functional classification of retinal ganglion cells in one recording. A, Principal components analysis of the STA time courses for all cells in a single preparation. The location of each point represents the weights on the first two principal components that summarize the time course for a single cell. Each cluster of points reflects the similarity of the time courses of a collection of cells and defines a functional cell class. Each functional cell class is subsequently identified with an anatomical cell type (see Methods). B, Properties of a single cell class, identified as OFF-parasol, from the same recording. Top: receptive field outlines drawn at the 1 SD contour of Gaussian fits to the STA (see Methods). Rectangle indicates the outline of the 512-electrode array (1800 μm × 900 μm). Bottom left: STA time courses for red, green, and blue display phosphors. Bottom right: autocorrelation functions. STA time course and autocorrelation function amplitudes are normalized to arbitrary units to allow comparison of shape. C–F, Properties of cell classes identified as ON-parasol, OFF-midget, small bistratified, and ON-midget cell types; other details are as in A.
- Figure 2.
Spatial receptive field structure of SBCs. A, STA time course for an SBC computed from an S versus L+M cone-isolating white noise stimulus (see Materials and Methods). The S component is shown in blue, and the L+M component in yellow. The vertical axis has arbitrary units. Left inset shows the spatial profile of both components combined, at the time of peak of the S-ON component. The rectangle indicates the outline of the electrode array (1800 μm × 900 μm). Right insets show the spatial profiles of the S (top) and L+M (bottom) components in grayscale. Ellipses represent the 1 SD contours of Gaussian fits to the spatial profiles. B, One SD contours of Gaussian fits to the S (blue) and L+M (yellow) spatial profiles for 44 simultaneously recorded SBCs. Thick outline represents the cell shown in A. Rectangle is the outline of the array. C, S and L+M receptive field radii for the cells in B. D, Mean ± SD of S compared with L+M receptive field radii in seven preparations. Slope of best fit line (gray) is 1.48. E, Spatial offsets between the centroid of the Gaussian fit to the L+M receptive field and that of the S receptive field. Displacement for each cell is normalized by its measurement uncertainty (SE). Dark (light) circle indicates a displacement at the p = 0.05 (0.001) significance level according to a χ2 test (see Materials and Methods). Same preparation as shown in B.
- Figure 3.
Comparison of response kinetics in SBCs and parasol cells. A, Superimposed STA time courses obtained with an S versus L+M cone-isolating white noise stimulus for SBCs (top), ON-parasol cells (middle), and OFF-parasol cells (bottom), from three preparations. For SBCs, blue represents the S component, and yellow represents the L+M component. For parasol cells, only the L+M component is shown. Time course amplitudes are normalized to arbitrary units (a.u.) to allow comparison of shapes. B, Fits to the S and L+M time courses as well as L+M time-to-peak and time-to-zero crossing for an example cell. C, Comparisons across cell and cone types of mean time-to-peak (left), time-to-zero crossing (middle), and degree of transiency (right) for the three preparations shown in A. Error bars show SE.
- Figure 4.
APB attenuates the (L+M)-OFF response in SBCs. A, Average response time courses for the S cone response in SBCs before (line), during (thick line), and after (dashed line) application of l-APB in a single preparation with 22 SBCs and 142 OFF-parasol cells. B, Change in response amplitude (see Materials and Methods) across conditions. C–F, Same as in A and B, but for the (L+M)-OFF response in SBCs (C, D) and OFF-parasol cells (E, F).
- Figure 5.
Mosaics of small bistratified and ON-parasol cell receptive fields. Data are from six retinas. SBC receptive fields from retinas 1–4. Spatial profile of each cell is represented by the 1 SD contour of a two-dimensional Gaussian fit. Retinas 5 and 6 show simultaneously recorded SBC (left) and ON-parasol cell (right) receptive fields. Rectangles indicate the outline of the electrode array (1800 μm × 900 μm).
- Figure 6.
Mosaic regularity. A, Gray histograms show distributions of NNDs for a collection of SBCs and ON-parasol cells recorded in one preparation (retina 5 in Fig. 5). NND was based on the center point (mean) of the Gaussian fits. Smooth curves show NND distributions expected from random placement of the observed number of cells (see Materials and Methods). Insets show the SBC mosaic (top) and a simulated mosaic of cells placed randomly (bottom). B, Scatter plot of NND distribution conformity ratios of SBC versus those of simultaneously recorded ON-parasol cells for 19 preparations (see Materials and Methods). The cross indicates SBC and ON-parasol NND mean (and SE) conformity ratios over these preparations.
- Figure 7.
Receptive field size and its variability. A, Scatter plot compares the mean SBC and ON-parasol receptive field radii across 31 preparations. Error bars span ± 1 SE. First-degree polynomial with zero intercept fit to the data (gray line) has a slope of 1.10. B, Scatter plot compares conformity ratio of the distribution of receptive field sizes for SBC and ON-parasol cells for same preparations as in A.
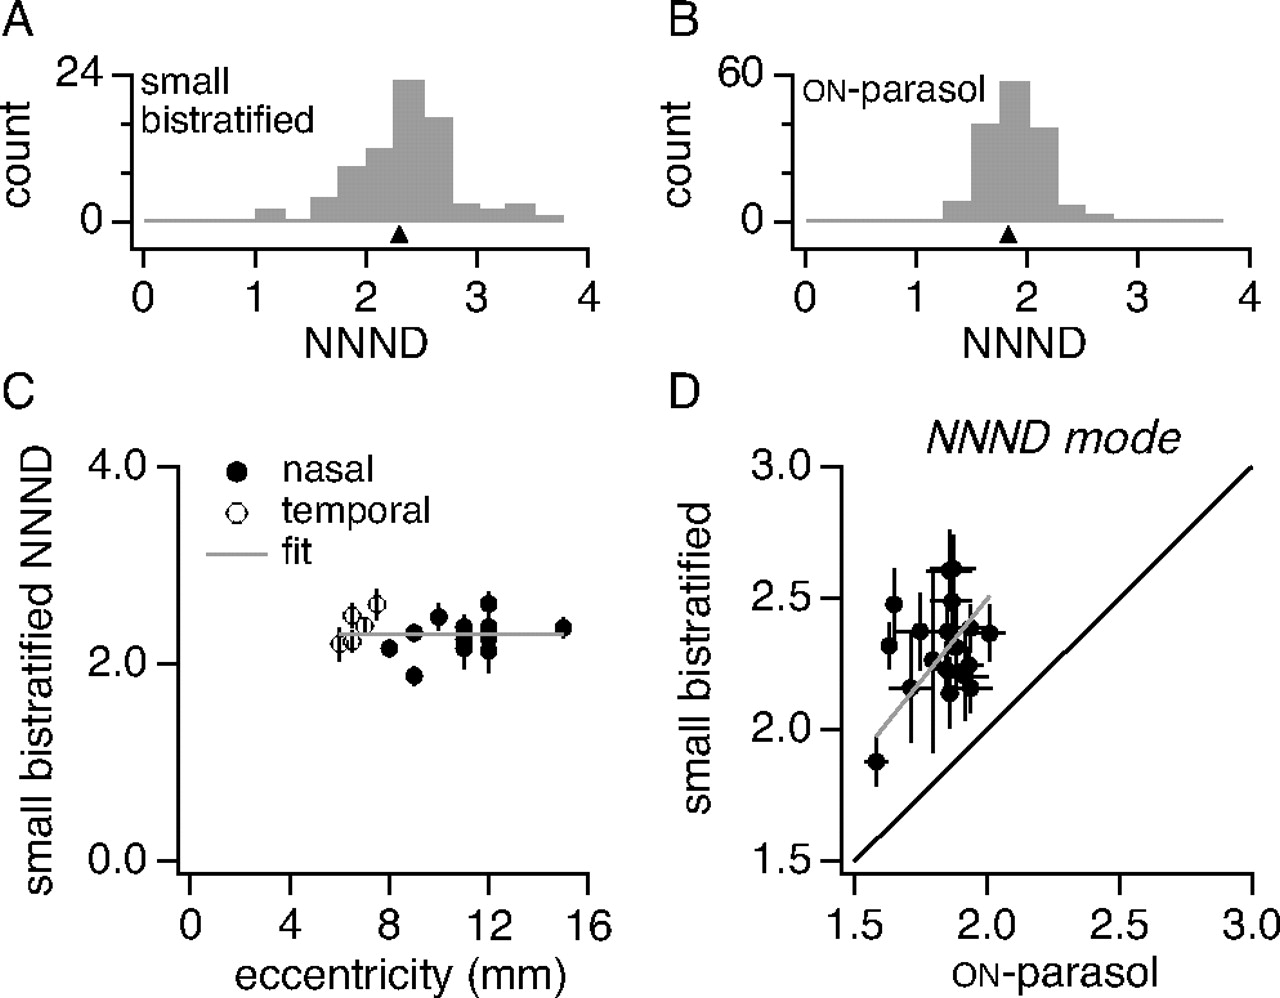
- Figure 8.
Mosaic overlap. A, Histogram of normalized nearest neighbor distances (NNND) for SBCs from retina 5 in Figure 5. Black triangle shows the mean of densest 75% (mode) of the distribution. B, Histogram of NNNDs for ON-parasol cells recorded simultaneously with the SBCs in A. C, NNND modes for SBCs from 18 preparations across retinal eccentricities 6–15 mm from the fovea. Nasal (temporal) recordings are shown in filled (open) circles with SE. Line is a zero slope fit to the data yielding a mean NNND across eccentricities of 2.30 ± 0.18. D, Scatter plot comparing NNND modes and SEs for simultaneously recorded SBCs and ON-parasol cells. Regression line with zero intercept has a slope of 1.25.
- Figure 9.
Comparison of anatomical and functional mosaic regularity. Anatomical mosaic CRs were based on cell soma positions and are taken from the literature (Wassle and Riemann, 1978; Wassle et al., 1981; Curcio et al., 1990; Dacey, 1993b; Kouyama and Marshak, 1997). All values are from primate except where noted. Physiological mosaic regularity is based on receptive field center locations. Note that the CR for SBCs and ON-parasol cells were not statistically different (Fig. 6B). For comparison, random mosaics have an expected CR of 1.913 (Cook, 1996).


Additional Files
Supplemental Data
Files in this Data Supplement:
- supplemental material - Supplemental Legend
- supplemental material - Supplemental Figure


