

Article Figures & Data
Figures
- Figure 1.
Effects of benzolamide and APV on stimulus-evoked pHe transients. A, Traces obtained in 0 Mg2+/PTX ACSF show a control alkaline shift (Ctl, black trace) and the enlarged response after application of benzolamide (Bz, gray trace). B, Traces obtained in standard ACSF show a control alkaline shift and the enlarged response in benzolamide. Time calibration in A applies to B. C, Traces obtained in 0 Mg2+/PTX. Left shows overlay of a control trace (black trace) and the diminished response after application of 50 μm APV (gray trace). Right displays the same record in APV (gray trace) and overlay of a trace after subsequent addition of benzolamide (dashed black trace). D, Similar sequence of traces obtained in standard ACSF shows attenuation of the alkaline transient in APV and subsequent increase in APV plus benzolamide. Note scale differences for A versus B and for C versus D. All responses shown were recorded in area CA1 stratum radiatum and were elicited by a supramaximal, three-pulse, 100 Hz stimulus train to the Schaffer collaterals. Benzolamide concentration was 10 μm in this and all subsequent figures. Arrows indicate onset of stimulus.
- Figure 2.
Effects of benzolamide on stimulus-evoked [Ca2+]e transients. A, Traces obtained in 0 Mg2+/PTX ACSF show control (Ctl) [Ca2+]e transient and its increase in the presence of benzolamide (Bz). B, Traces obtained in standard ACSF show a similar increase in the [Ca2+]e transient in benzolamide. The calibration in A applies to B. C, Normalized mean responses in 0 Mg2+/PTX ACSF indicating a significant increase in peak amplitude and half-time of decay in the presence of benzolamide. D, Normalized mean responses in standard ACSF show similar increase in amplitude and half-time of decay in benzolamide. E, [Ca2+]e transients recorded in nominally 0 bicarbonate ACSF, buffered with 26 mm HEPES. Application of benzolamide to this saline had no effect on the peak amplitude of the response. In this and subsequent figures, statistical significance in bar graphs is designated as *p < 0.05, **p < 0.01, or ***p < 0.001.
- Figure 3.
Effect of benzolamide on evoked [Ca2+]e transients in APV. A, Traces obtained in standard ACSF. Left shows overlay of a control trace (Ctl, black trace) and the diminished response after application of 50 μm APV (gray trace). Right displays the same record in APV (gray trace) and overlay of a trace after subsequent addition of benzolamide (Bz, dashed black trace). Note the increase in duration, with no change in amplitude. B, Mean effects of benzolamide in standard ACSF. Left displays the mean normalized response amplitudes. There was no significant difference for APV versus APV plus benzolamide (NS, p > 0.05). Differences for control versus APV and control versus APV plus benzolamide were significant (p < 0.01) but were not displayed for clarity. Right displays the mean normalized decay half-times. Note the significant increase in decay half-time after addition of benzolamide. C, Traces obtained in 0 Mg2+/PTX ACSF, displayed as in A. APV diminished the [Ca2+]e transient (left), and subsequent addition of benzolamide (right) prolonged the decay half-time in this instance by 42%, with no effect on its amplitude. D, Mean effects of benzolamide in 0 Mg2+/PTX ACSF. Left, Normalized response amplitude with no significant difference for APV versus APV plus benzolamide. Differences between control versus APV and control versus APV plus benzolamide were significant but were not displayed for clarity. Right, Normalized differences in the decay half-time. On average, the decay time in APV was approximately doubled after addition of benzolamide.
- Figure 4.
Effect of benzolamide on [Ca2+]i responses in 0 Mg2+/PTX ACSF. A, Images of a CA1 pyramidal neuron before and after a 10 pulse, 100 Hz stimulus. First pair of images in control and benzolamide (Bz, far left) shows Alexa 594 fluorescence before stimulus. Approximate regions of interest are shown for soma (1), proximal dendrite (2), and background (3). Subsequent images to the right show progression of Fluo-5F fluorescence at 300 ms intervals, with 0.0 s corresponding to the start of the stimulus train. Note increased intensity of images in benzolamide. B, Line traces of Fluo-5F response in proximal dendrite (top) and soma (middle), with simultaneous electrical response recorded in current clamp at the soma (bottom). Benzolamide increased the amplitude of the [Ca2+]i responses in the dendrite but not the soma. Overlay in bottom illustrates increased duration of the electrical response in benzolamide (gray trace). C, Normalized effect of benzolamide on the peak amplitude of the [Ca2+]i response at the soma and dendrite. D, Normalized effect of benzolamide on the half-time of decay of the [Ca2+]i response at the soma and dendrite. Ctl, Control.
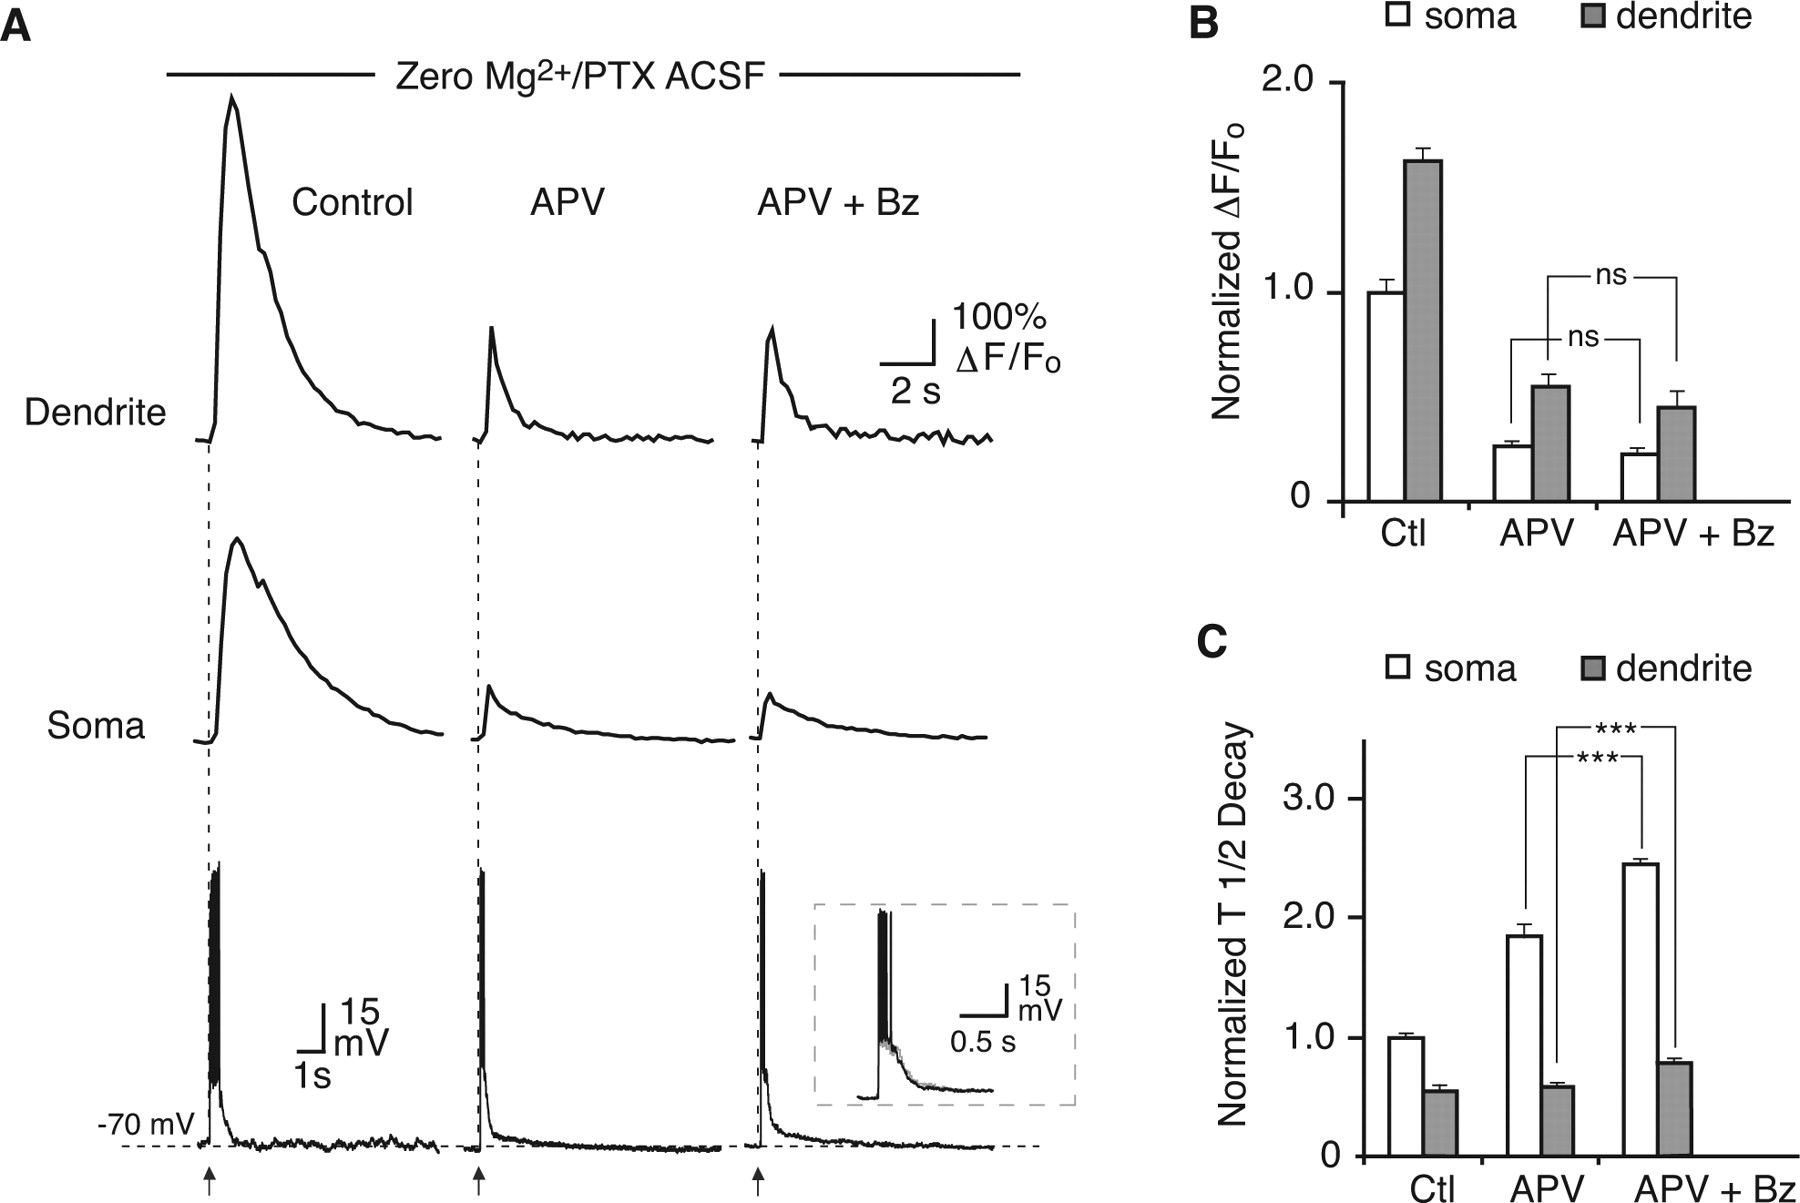
- Figure 5.
Effect of benzolamide on [Ca2+]i responses in 0 Mg2+/PTX with APV. A, The application of 50 μm APV markedly diminished the amplitude of the [Ca2+]i response in the dendrite (top) and soma (middle) and decreased the duration of the electrical response. With subsequent application of benzolamide (Bz), the amplitude of the [Ca2+]i response was unaffected. The duration of the electrical response (bottom) was also unchanged by benzolamide in the presence of APV. Overlay in the bottom shows the postsynaptic electrical response in APV (black) and in APV plus benzolamide (gray). B, Mean normalized effects of APV and APV plus benzolamide on the amplitude of [Ca2+]i responses at the soma and dendrite. There was no significant change in amplitude at the soma or dendrite after benzolamide was added to APV. Control (Ctl) versus APV and control versus APV plus benzolamide were significant for soma and dendrite but were not shown for clarity. C, Mean normalized effects of APV and APV plus benzolamide on the half-time of decay of the [Ca2+]i transients. Addition of benzolamide to APV caused a significant increase in half-time at the soma and dendrite. Control versus APV and control versus APV plus benzolamide were significant for the soma and dendrite but were not shown for clarity.
- Figure 6.
Effect of benzolamide on [Ca2+]i responses in standard ACSF. A, Benzolamide (Bz) increased the amplitude of the responses in the dendrite (top) and the soma (middle). Overlay in the bottom illustrates increased duration of the electrical response in benzolamide (gray trace). B, Mean normalized effect of benzolamide on the amplitude of the [Ca2+]i responses in the soma and dendrite. C, Mean normalized effect of Bz on the half-time of decay of the [Ca2+]i responses in the soma and dendrite. Ctl, Control.
- Figure 7.
Effect of benzolamide on [Ca2+]i responses in standard ACSF with APV. A, The application of 50 μm APV markedly diminished the amplitude of the [Ca2+]i response in the dendrite (top) and soma (middle) and decreased the duration of the electrical response. With subsequent application of benzolamide (Bz), the amplitude of the [Ca2+]i response was unaffected. B, Mean normalized effects of APV and APV plus benzolamide on the amplitude of the [Ca2+]i responses at the soma and dendrite. There was no significant difference between APV and APV plus benzolamide for the soma and dendrite. Control (Ctl) versus APV and control versus APV plus benzolamide were significant but were not shown for clarity. C, Mean normalized effects of APV and APV plus benzolamide on the half-time of decay of the [Ca2+]i transients. Addition of benzolamide to APV caused a significant increase in half-time at the soma and dendrite. Control versus APV and control versus APV plus benzolamide were significant for the soma and dendrite but were not shown for clarity.


