

Article Figures & Data
Figures
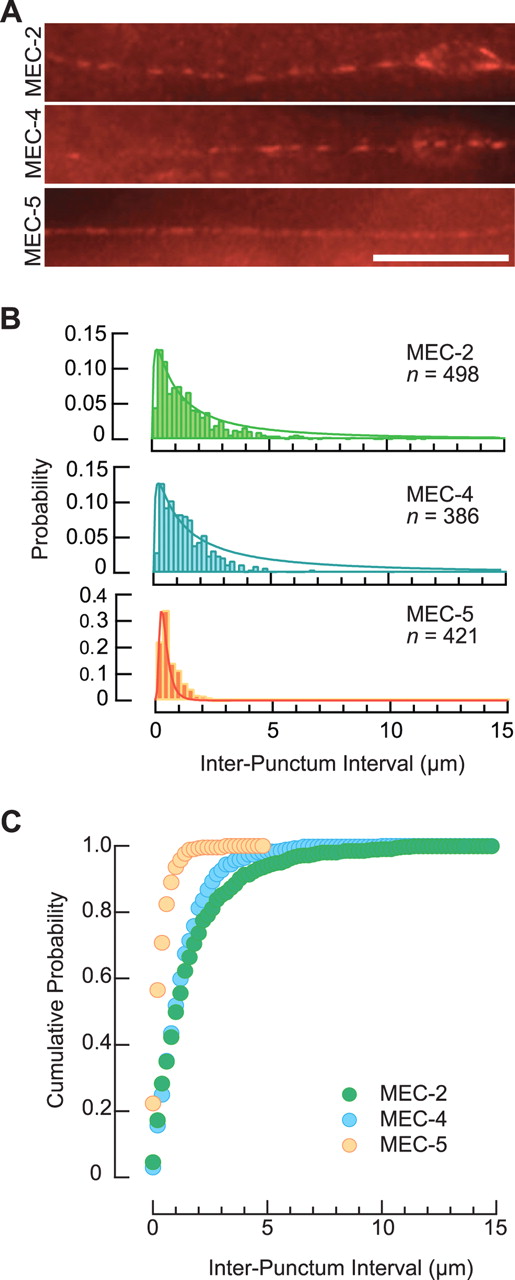
- Figure 1.
Native MeT channels and MEC-5 collagen decorate TRN neurites. A , Indirect immunofluorescence labeling of PLM in wild-type animals. Similar results were observed in 22, 18, and 15 neurites labeled with anti-MEC-2, anti-MEC-4, and anti-MEC-5 antibodies, respectively. Anterior is to the left. Scale bar, 10 μm. B , Probability distributions (pdfs) of interpunctum intervals for MeT channel subunits (MEC-2 and MEC-4) and MEC-5 collagen. Smooth curves were fit to the data according to a log-normal distribution. Fitting parameters were as follows (peak, width in μm): MEC-2 (0.2, 2.15), MEC-4 (0.2, 2.34), and MEC-5 (0.263, 0.84). C , Cumulative probability distribution functions for the data shown in B .
- Figure 2.
The MEC-2 channel subunit colocalizes with MEC-4 but not with MEC-5. Indirect immunofluorescence double labeling of TRNs with antibodies specific for the following: A , two distinct domains of MEC-2; B , MEC-2 and MEC-4; and C , MEC-2 and MEC-5. D , Quantification of colocalization in the double-label experiments. Intensity correlation quotient values are as follows (average ± SD, n indicates double-labeled neurites): MEC-2/MEC-2 (0.3 ± 0.06; n = 8), MEC-2/MEC-4 (0.28 ± 0.02; n = 8), and MEC-2/MEC-5 (0.11 ± 0.03; n = 8). *p < 0.01, Student's t test. Scale bar, 10 μm.
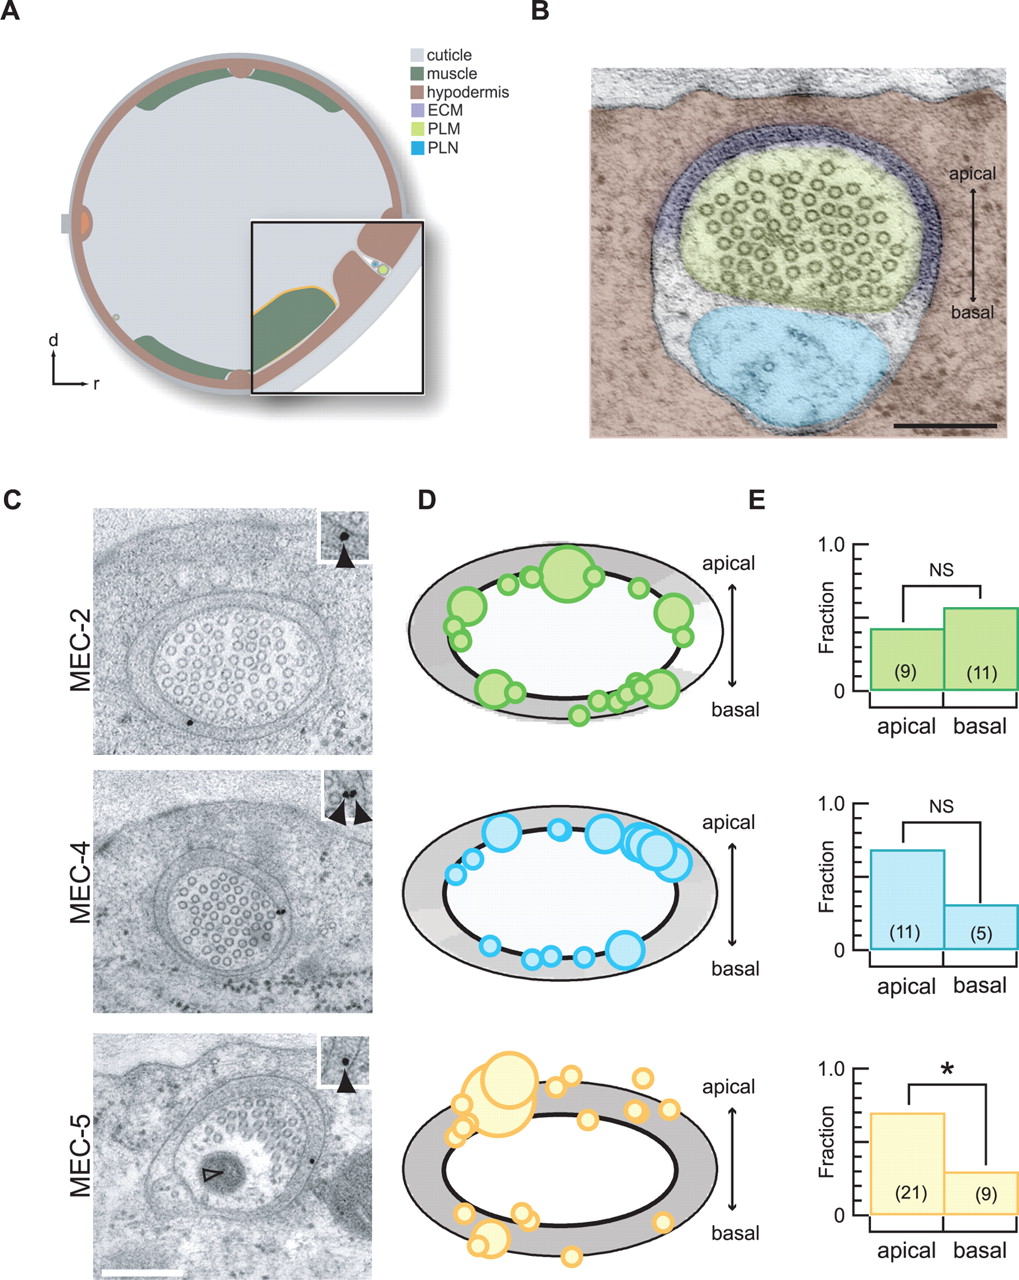
- Figure 3.
Nanoscale position of the MEC-2 and MEC-4 MeT channel subunits and MEC-5 collagen in wild-type TRNs. A , Schematic cross-section showing the relative positions of the cuticle (gray), four muscle quadrants (green), hypodermis (brown), PLM (green), PLN (blue), and ECM (purple). Structures not to scale. Adapted from WormAtlas (Altun and Hall, 2005). B , Electron micrograph showing a cross-section through the cuticle (gray), ECM (purple), PLM (blue), and PLN (green). Cuticle (apical) side is up. Scale bar, 200 nm. C , Immunoelectron micrographs of thin sections labeled with anti-MEC-2 (top), anti-MEC-4 (middle), and anti-MEC-5 (bottom). Insets are digitally magnified (2×) views of each label cluster. Filled arrowheads indicate gold beads; open arrowhead indicates a mitochondrion in PLM. Scale bar, 200 nm. D , Circumferential position of MEC-2 (top), MEC-4 (middle), and MEC-5 (bottom). Symbol size is proportional to the number of gold beads in a cluster in each section; the smallest symbol corresponds to a single gold bead and the largest symbol corresponds to four gold beads. The average ECM density for the labeled sections is shown as a grayscale annulus around the neurite cross-section. E , MEC-5 collagen but not MeT channel subunits exhibit an apical bias. *p < 0.01, χ2 test. The number of labels in each category is indicated in parentheses.
- Figure 4.
Sequential immunoelectron micrographs of 50 nm sections labeled with anti-MEC-2 (top) and anti-MEC-4 (bottom). Scale bar, 200 nm.
- Figure 5.
Position of distal endpoints of 15pf microtubules and the distance between endpoints and native MeT channels. A , Position of distal endpoints detected in SS-IEM reconstructions of lateral TRN neurites. Dashed line indicates the border between the center and rim of a normalized TRN profile; the center and rim zones have equal areas. B , Fraction of endpoints in the rim and center of the TRN cross-section. *p < 0.0001, χ2 test. C , Fraction of endpoints on the apical and basal sides of the TRN. Numbers in each category indicated in parentheses. D , 3-D digital model of a 7.5 μm fragment of PLM derived from 151 serial sections labeled with anti-MEC-2 antibody. For clarity, only the following structures are shown: the plasma membrane (transparent gray); terminating microtubules (aqua) and their distal endpoints (red); and plasma membrane-associated MeT channels (gold spheres). An animated fly-through of the model is included in supplemental data (available at www.jneurosci.org as supplemental material). The distance between each membrane-associated channel and the nearest microtubule endpoint was measured as illustrated. E , Histogram of the distance between plasma membrane-associated MeT channels and the nearest microtubule endpoint. The average and median distances were 347 and 328 nm, respectively. Measurements were made of 271 distal 15pf microtubule endpoints and endpoint-to-channel distances for 14 channels localized in five 3-D models derived from SS-IEM of lateral TRNs (4 PLMs and 1 ALM).
- Figure 6.
Concordance between MEC-2 immunofluorescent puncta and the distribution of anti-MEC-2 labels in SS-IEM. A , Simulated immunofluorescent image (top) and associated intensity profile (bottom) derived from SS-IEM of a 20 μm segment of PLM. AU, Arbitrary units. B , Histogram of the length (full-width half-maximum) of mouse anti-MEC-2 immunofluorescent (IF) puncta. n = 445 IF puncta measured in 21 TRN neurites. Smooth line is the sum of two Gaussians with centers at 870 nm and 1.44 μm that was fit to the data. Inset shows the average intensity profile of 15 fluorescent microspheres (d = 175 nm) imaged under the same conditions as IF samples; smooth line is a Gaussian fit to the data with a FWHM of 750 nm. C , Cumulative probability distribution of interlabel intervals for experimental and simulated IF puncta; intervals were defined as the peak-to-peak distance for puncta detected from intensity profiles of real and simulated IF images.
- Figure 7.
A network of filaments links individual 15 protofilament microtubules to each other and connects the microtubule bundle to the plasma membrane. A , Electron micrographs showing filaments that link 15pf microtubules to one another and to the plasma membrane. Individual microtubules are linked to the majority of their nearest neighbors in the bundle. Filaments linking microtubules to the plasma membrane are more numerous and are organized into a more elaborate network. Scale bars, 150 nm. B , Digital rendering of the filaments and microtubules in four serial sections of PLM reveals the density of filaments and the extent of the connections they make. Microtubule fragments are shown in aqua, and filaments are in black. The panels are rotamers of a single 3-D digital model. C , Distribution of the lengths of inter-microtubules links. A total of 315 links were analyzed in five electron micrographs of a series of consecutive 50 nm sections containing 64 15pf microtubules. D , Distribution of the lengths of filaments linking the microtubule bundle to the plasma membrane. A total of 215 filaments were analyzed in the same electron micrographs as in C .


Additional Files
Supplemental Data
Files in this Data Supplement:
- supplemental material - Supplemental Legend
- supplemental material - Supplemental Figure 1
- supplemental material - Supplemental Figure 2
- supplemental material - Supplemental Figure 3
- supplemental material - Supplemental Movie 1
- supplemental material - Supplemental Movie 2


