

Article Figures & Data
Figures
- Figure 1.
MEA recordings in acute cerebellar slices. A, The picture in the middle shows a parasagittal slice of the cerebellar vermis (thickness, 220 μm) placed on an MEA. Electrodes are indicated by (x, y) coordinates. Mf, Mossy fiber; GL, granular layer; PCL, Purkinje cell layer (white circles); ML, molecular layer. The pair of white dots indicates stimulating electrodes. The left traces show spontaneous activity on different electrodes. The GL is usually silent [electrode (3,5)] except for the occasional observation of low-frequency Golgi cell rhythmic firing [electrode (5,4)]. Spontaneous high-frequency discharge is usually found in the PCL [electrode (5,3)]. The right traces show evoked activity on two different electrodes. The granular layer electrode [electrode (2,4)] shows the typical N1–N2–P2 complex. The molecular layer [electrode (1,5)] shows a wave complex with inverted polarity. Each trace is the average of 10 responses. The stimulus artifact was digitally subtracted using the TTX-trace obtained at the end of the recording (data not shown). The inset shows an enlarged view of the granular layer field response [electrode (2,4)]. The vertical arrows indicate the amplitude of N2a and N2b. B, Time course of N2a and N2b peak amplitude for a granular layer electrode demonstrating recording stability over time. The inset shows individual traces used to measure average amplitudes (the stimulus artifact is partially blanked).
- Figure 2.
Electrical maps of evoked granular layer activity. Electrical 3D maps for N2a and N2b were constructed from responses to mossy fiber stimulation at two different intensity (3 and 7 V). Pseudocolors improve perception of the vertical dimension. Excitation diffused to both sides of the mossy fiber bundle, revealing patches of activity. Increasing stimulation intensity enhanced the signal. In these and subsequent maps, the granular layer is delimited with thin dashed contours passing over the Purkinje cell layer, and continuous white lines indicate the mossy fiber bundle. Two white dots indicate the stimulation site. Also note that, to complete the graphic matrix, the corner points have been artificially set to 0.
- Figure 3.
The relationship between field potentials and granule cell activity. A, Signals recorded at high and low stimulation intensity (red and black traces) are compared in the field response (bottom) and in WCRs (top). Several sweeps are shown for the high-intensity intracellular signal to illustrate the variability of the spike generation mechanism (traces show either one or two spikes with variable latency). When stimulus intensity is increased, a spike appears followed by an afterhyperpolarization, and then N2a splits from N2b. Intracellular EPSPs and spikes (single responses) occur in correspondence with the extracellular signals (average of 10 responses). A double arrow indicates the stimulation time. B, Granule cell spikes were recorded in LCA. At low intensity of stimulation, only a delayed spike response is observed (open circles). By raising stimulation intensity, the spike anticipates and becomes more regular. Moreover, a second spike emerges (filled circles). The PSTH shows peaks corresponding to N2a and N2b. The colors indicate different stimulation intensities. C, The plot shows the relationship between peak amplitude and slope for N2a (linear fit, R2 = 0.78; 120 electrodes in 7 slices). The different symbols indicate different slices.
- Figure 4.
The pharmacology of field potentials. A, Field potentials on a single electrode are reported from a sequential experiment in which, after a control period, drugs were added to the extracellular solution. The control field potentials are modified by application of 10 μm bicuculline. EPSP-like responses show a slow, smooth time course. In spiky responses, N2a peak is left unchanged by bicuculline, but N2b is markedly enhanced and is followed by oscillations, the first of which corresponds to N2b. B, In a different experiment than in A, after application of 10 μm bicuculline, N2b is enhanced. Then, subsequent application of the NMDA receptor blocker, 50 μm d-APV, reduces N2b. Addition of the AMPA receptor blocker, 10 μm NBQX, abolishes the postsynaptic field response. N1 is left unchanged by these receptor antagonists, confirming its presynaptic nature. Each trace in A and B is the average of 10 responses. C, Granule cell spikes were recorded in LCA before and after application of 10 μm bicuculline. In control, a delayed and scattered spike response is observed (open circles). After bicuculline application, the first spike anticipates and a second spike emerges (filled circles). The PSTH shows peaks corresponding to N2a and N2b.
- Figure 5.
The relationship between excitation and inhibition. A, Electrical 3D maps show N2b amplitude before and after application of 10 μm bicuculline. Bicuculline disinhibited several areas. The distribution and intensity of the inhibitory effect is demonstrated by the subtraction map (control − bicuculline). B, In the same slice shown in A, the number of electrodes measuring a detectable N2b response after bicuculline application (black dots) is increased. Note that N2a was already measurable over the electrodes showing N2b after bicuculline application (large open dots). C, Left, Plot of N2b changes caused by bicuculline as a function of N2a amplitude. The plot reveals a strong negative correlation between the parameters. The thick line is a monoexponential fitting to the whole dataset [y = y0 + A × exp(−x/τ), with y0 = 95, x0 = 0, A = 1174, τ = 0.09; p(χ2) < 0.001; R2 = 0.72; n = 180 in 7 slices], the thin dashed lines are fittings to single-slice data (always R2 > 0.6). Right, Plot of N2b versus N2a initial amplitude from the same slices: note the absence of correlation. For each slice, N2a and N2b amplitudes are normalized to their maximum control value. D, The histogram shows the average change caused by bicuculline in the electrodes with a local peak of excitation versus the surrounding ones. The effect of bicuculline is stronger in the surround (n = 60 from 7 slices; *p < 0.03, paired t test). No comparable difference is observed by random sampling the granular layer electrodes and measuring the surrounding activity (n = 60 from 7 slices; p = 0.74, paired t test). Error bars indicate SEM.
- Figure 6.
The spatial organization of the excitatory/inhibitory balance. A, The top panel shows an average excitation map (measured from N2a) obtained from seven MEA recordings and 156 electrodes by centering over the highest responses and aligning the corresponding slices along the mossy fiber bundle. To visualize the excitatory/inhibitory balance, we first measured the variation of N2b after bicuculline perfusion, obtaining an inhibition map (data not shown). Then, the inhibition map was subtracted from and normalized to the corresponding excitation map according to the E/I definition reported in Results. B, The cross section reveals a bell-shaped profile (black line) for excitation. When synaptic inhibition is blocked by bicuculline (red line), the profile broadens and shows depression in the center. The excitatory/inhibitory balance (see definition given above) reveals lateral inhibition (dotted line).
- Figure 7.
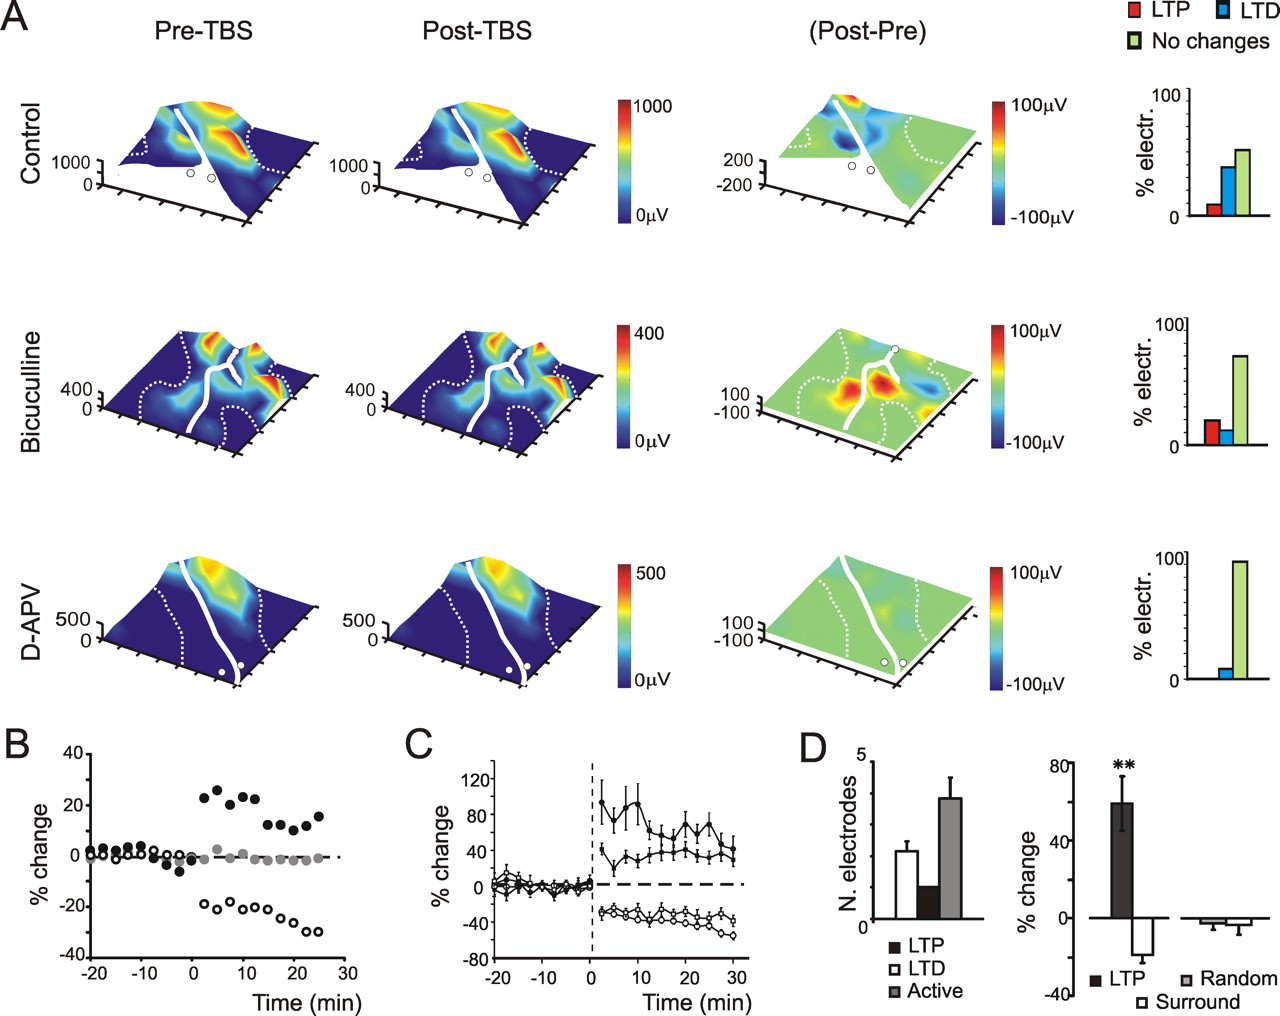
Long-term synaptic plasticity. A, Electrical 3D maps for N2a amplitude were obtained before (Pre-TBS) and after (Post-TBS) application of a TBS in three different solutions (control, bicuculline, APV). The subtraction map (Post–Pre) reveals the localization of LTP (red) and LTD (blue). The histograms at the right indicate the percentage of electrodes generating either LTP, LTD, or no change. After TBS delivered in control extracellular solution, LTD prevails over LTP. After TBS delivered in the presence of 10 μm bicuculline, LTP prevails over LTD. After TBS delivered in the presence of 50 μm [scap]d-APV, no remarkable LTP or LTD changes are observed except for a minor occurrence of LTD. The experiments reported in this figure are different from those reported in Figure 4. B, The time course of N2a amplitude changes in control extracellular solution on single electrodes, one showing LTP, one showing LTD, and one showing no long-term plasticity changes [data corresponding to electrodes (2,1), (3,4), and (6,4) in the top right panel of Fig. 6]. C, Time course of N2a amplitude changes in control extracellular solution (circles) and in presence of 10 μm bicuculline (square). The measures were obtained from electrodes showing either positive or negative response variations >10% after TBS (control: n = 50 electrodes for LTD, n = 12 electrodes for LTP, data from 4 slices; bicuculline: n = 16 electrodes for LTD, n = 26 electrodes for LTP, data from 7 slices). D, The left histogram shows that around the LTP electrode, there are on average 3.8 ± 0.7 active granular layer electrodes, 2.2 ± 0.3 of which showing LTD (n = 28 from 6 slices). The right histogram shows the average change in the electrodes surrounding the one with maximal LTP. The net change around the LTP electrode is a significant LTD (n = 28 from 6 slices; **p < 10−5, paired t test). No comparable changes are observed by randomly sampling the granular layer electrodes and measuring the surrounding activity (n = 34 from 6 slices; p = 0.96, paired t test). Error bars indicate SEM.
- Figure 8.
The spatial organization of synaptic plasticity. A, Average plasticity maps are generated from five experiments (62 electrodes) performed in the presence of bicuculline by centering over the electrodes showing maximal LTP and aligning the slices along the mossy fiber bundle (top panel). The averaging procedure was repeated for four MEA experiments and 38 electrodes in control solution (bottom panel). LTP emerges as a red-tipped cone surrounded by a blue ring of LTD, which is almost absent with bicuculline in the bath. B, The cross section reveals a Mexican-hat profile (black line). When synaptic inhibition is blocked by bicuculline (red line), LTD tends to disappear. Note that, because the 3D maps in A and B are rather symmetric, the cross section in a plane (indicated by a dotted frame) is representative of the average map profile.
- Figure 9.
The relationship between plasticity and excitation (A). The plot shows the relationship between the relative change during long-term synaptic plasticity and excitation measured as N2a control amplitude. The data shown in this panel were obtained from the electrodes displaying significant N2a changes after TBS, as in B. Note that, for small N2a amplitudes, the electrodes usually show LTD, whereas at large amplitudes they tend to show LTP. The data are interpolated with a double exponential equation [y = y0 + A1 × exp(−(x − x0)/τ1) + A2 × exp(−(x − x0)/τ2), with y0 = 29.5, x0 = 45.13, A1 = 99.5, τ1 = 24.1, A2 = −93, and τ2 = 266; n = 62 electrodes from 4 slices; p(χ2) < 0.01]. Note also that, in the very low amplitude region, some data points (enclosed in a dashed circle) show LTP. These data have not been used for fitting. B, Same as in A, but in the presence of 10 μm bicuculline [double exponential fitting with y0 = 23.5, x0 = −12, A1 = 3354, τ1 = 9.65, A2 = −450, and τ2 = 31.1; n = 42 electrodes from 7 slices; p(χ2) < 0.01].
- Figure 10.
The relationship between plasticity and inhibition. A, The electrical 3D maps compare distribution of plasticity and inhibition. After a control period, synaptic plasticity was induced with TBS. Then, after allowing plasticity to attain a steady level (30 min), 10 μm bicuculline was perfused. It was therefore possible to obtain a plasticity map (post-TBS − control) and the corresponding inhibition map (post-TBS − bicuculline) in the same MEA recording experiment. B, The plot shows the relationship between synaptic plasticity and inhibition for MEA recordings in which inhibition was evaluated after TBS (closed circles; n = 4 MEA recordings, n = 23 electrodes) (e.g., see A) or before TBS (open circles; n = 4 MEA recordings, n = 22 electrodes). The colored points code plasticity for the slice shown in A. LTP prevails with little inhibition, LTD with large inhibition. The dotted line is a biexponential fitting to the data [y0 = −25, x0 = 0, A1 = 142.15, τ1 = 90, A2 = −100, τ2 = 160; p(χ2) < 0.01]. C, The plot shows the relationship between synaptic plasticity and the excitatory/inhibitory balance (E/I) (definition in the text) for the same recordings used in B. Whereas LTP occurs only at high E/I, LTD occurs at all values. The colored points code plasticity for the slice shown in A. To complete the dataset representation, the white dots show results recorded within the plasticity rejection threshold (less than ±10% change).


Additional Files
Supplemental Data
Files in this Data Supplement:
- supplemental material - Supplemental material


