

Article Figures & Data
Figures
- Figure 1.
Experimental paradigm. Each trial was initiated by a cue-fixation period of 500 ms. Afterward, either the pursuit target immediately appeared at an eccentric position and started to move at 65°/s for 500 ms (A, C), or a delay period was introduced before target motion onset (400 ms in monkey P, 600 ms in monkey T; B, D). At the end of the pursuit period, subjects had to maintain fixation of the target in its final eccentric position for 500 ms. Target motion direction, to the left or to the right, was randomized. A, B, In neutral cue trials, the fixation point was always green before leftward or rightward target motion. C, D, In directional cue trials, the color of the fixation point informed subjects about upcoming target motion direction: red before rightward and yellow before leftward target motion, respectively. E, Example of a smooth-pursuit trial with anticipatory pursuit during the delay period (shaded area). Eye position and velocity signals are represented in red. The vertical arrow indicates anticipatory pursuit onset. The asterisk shows the time of maximum velocity. Dashed lines, Position (top) or velocity (bottom) of the target; filled horizontal bars, fixation periods; open horizontal bar, the period of target motion.
- Figure 2.
Influence of experimental conditions on anticipatory pursuit movements and neuronal activity. An example of activity of a single SEF neuron is shown. The four experimental conditions tested were randomly interleaved in a block of 200 trials. Each panel shows individual eye velocity traces (thin gray traces, leftward movements; thin black traces, rightward movements), average eye velocity (thick traces), spike densities (red, preferred direction; blue, antipreferred direction), and raster displays (preferred direction only) for the four experimental conditions tested. Upward arrows show when spike densities become statistically significantly different (Wilcoxon rank sum test, p < 0.05 for 100 ms). Boxes labeled fix, d1, and d2 indicate 200 ms periods of neuronal activity during which the influence of cue type and direction was measured and tested for statistical significance of observed effects. For this neuron, there was a significant effect of cued direction during the three periods fix, d1, and d2 (indicated with asterisks; ANOVA, p < 0.01). A1, A2, Neutral cue/no-delay condition. B1, B2, Directional cue/no delay. C1, C2, Neutral cue/delay. D1, D2, Directional cue/delay.
- Figure 3.
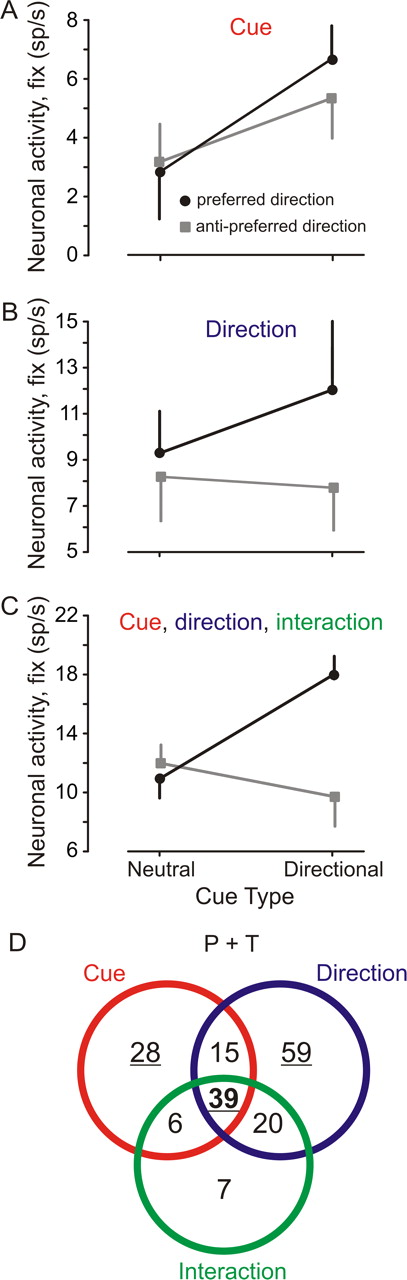
Examples of the outcome of the ANOVA applied to the data collected from each neuron. Factors were cue type and direction; dependent variables were the three predefined epochs fix, d1, and d2. Black symbols, Preferred direction; gray symbols, antipreferred direction. A, Neuron with a significant main effect of cue type only. B, Neuron with a significant main effect of cued direction only. C, Neuron with a significant main effect of cue type and cued direction and a significant interaction between factors. D, Venn diagram showing the number of neurons with the different statistical effects observed. Underlined figures show categories where examples presented in A–C were drawn. Data of the two subjects were pooled together.
- Figure 4.
Population-averaged neuronal responses. A–D, Population-averaged normalized spike densities in the different experimental conditions. We included only neurons that were tested in all conditions and that showed a significant effect in the ANOVA with cue type and cued direction as independent variables and fix, d1, and d2 periods activity as dependent variables. See inset for color code. A, B, Monkey P. C, D, Monkey T. Left column, No delay; right column, delay condition. Upward arrows indicate when directional selectivity emerged, on average, in the directional (red arrow) and neutral (gray arrow) cue conditions using the Wilcoxon rank sum test. E, F, Relationship between activity in the neutral and directional cue conditions in the preferred (E) and in the antipreferred (F) directions. Red symbols represent neurons with a significant difference between directional and neutral cue activity (p < 0.05). In the preferred direction, most data points clustered above the diagonal line (thin dashed line), showing an increase in activity in the cued preferred direction (red line; y = 1.3 × x + 4.6; r = 0.94; n = 82). In the antipreferred direction, most points clustered below the diagonal line, showing a reduction in activity in the antipreferred cued direction (red line; y = 0.7 × x − 2.5; r = 0.92; n = 72). Blue symbols represent neurons without a significant difference between directional and neutral cue activity (p > 0.05; blue lines; preferred direction: y = 1.1 × x + 0.5; r = 0.95; n = 40; antipreferred direction: y = 0.9 × x + 0.4; r = 0.94; n = 50). Data from the two subjects are pooled together (total of 122 neurons).
- Figure 5.
Emergence of directional selectivity for the population of recorded neurons. A1, B1, Fraction of neurons becoming directionally selective as a function of elapsed time. The x-axis represents time, and the y-axis represents the cumulative fraction of neurons that became directionally selective at corresponding times. Filled circles, Fraction of neurons in bins of 50 ms; black curve and symbols, directional cue condition; gray curve and symbols, neutral cue condition. The first vertical line shows the median latency of anticipatory pursuit onset. The second vertical line shows the latency of visual pursuit. A2, B2, Cumulative latency distribution of anticipatory pursuit movements. A3, B3, Velocity of the eye as a function of time during electrophysiological recordings of neurons represented in A1 and B1. Red curves, Directional cue/delay condition, preferred direction; blue curves, directional cue/delay condition, antipreferred direction; gray curves, neutral cue/delay condition. Left column, Monkey P; right column, monkey T.
- Figure 6.
Behavioral relevance, I. Shown is an example of a single neuron with activity that was significantly modulated during anticipatory pursuit trials. A1, Average eye velocity as a function of time for trials with anticipatory pursuit in the preferred (red curve) or in the antipreferred (blue curve) direction and for trials without anticipatory pursuit (black curve). A2, Neuronal activity recorded during the same pursuit trials as above. Asterisks indicate the period during which a significant difference in spike density was observed between trials without or with anticipatory pursuit in the preferred direction (ANOVA, p < 0.05). B, Relationship between neuronal activity during trials without (x-axis) or with (y-axis) anticipatory pursuit in the preferred direction. Red dots represent neurons with a significant difference in average spike density before target motion onset between these two types of trials (ANOVA, p < 0.05). Most neurons with a significant effect were clustered above the diagonal, showing an increase in activity during anticipatory pursuit trials. The red line is the regression line through data points representing neurons with a significant increase in neuronal activity (y = 3.3 + 1.2 × x; r = 0.92; n = 37). The blue line is the regression line through data points representing neurons without a significant difference (y = 0.8 + 1.0 × x; r = 0.91; n = 85). Data for the two subjects are pooled together. Blue squares represent the average activity during the two types of trials for neurons not significantly modulated by anticipatory pursuit occurrence (±SD), and red squares represent the average activity for neurons that were significantly modulated.
- Figure 7.
Behavioral relevance, II. A, Average spike density for 29 neurons tested with a 400 ms delay during anticipatory pursuit trials in the preferred direction (red curve), in the antipreferred direction (blue curve), and in the absence of anticipation (black curve). B, Comparison between normalized spike density in the preferred direction (red curve; same data as red curve in A) and normalized eye velocity of anticipatory pursuit movements during the same trials (black dashed curve). Note the early increase in the spike density at the end of the fixation period, before movement initiation.
- Figure 8.
Neuronal correlate of anticipatory pursuit initiation. A, Eye velocity during compatible and incompatible anticipatory pursuit trials in the preferred (yellow and orange curves) and antipreferred (green and blue curves) directions. Small arrows indicate when eye velocity abruptly changed because target motion direction did not coincide with the anticipatory pursuit “guess.” B, Average spike density during the same compatible and incompatible trials for 29 neurons. See Results for details.
- Figure 9.
Temporal relationships. Cumulative distribution of directional selectivity onset (filled symbols) and cumulative anticipatory pursuit latency distribution (open symbols) as a function of time during the fixation and delay periods. Double-headed arrows show the temporal delay between rapid increases in the two distributions. See Results for details.
- Figure 10.
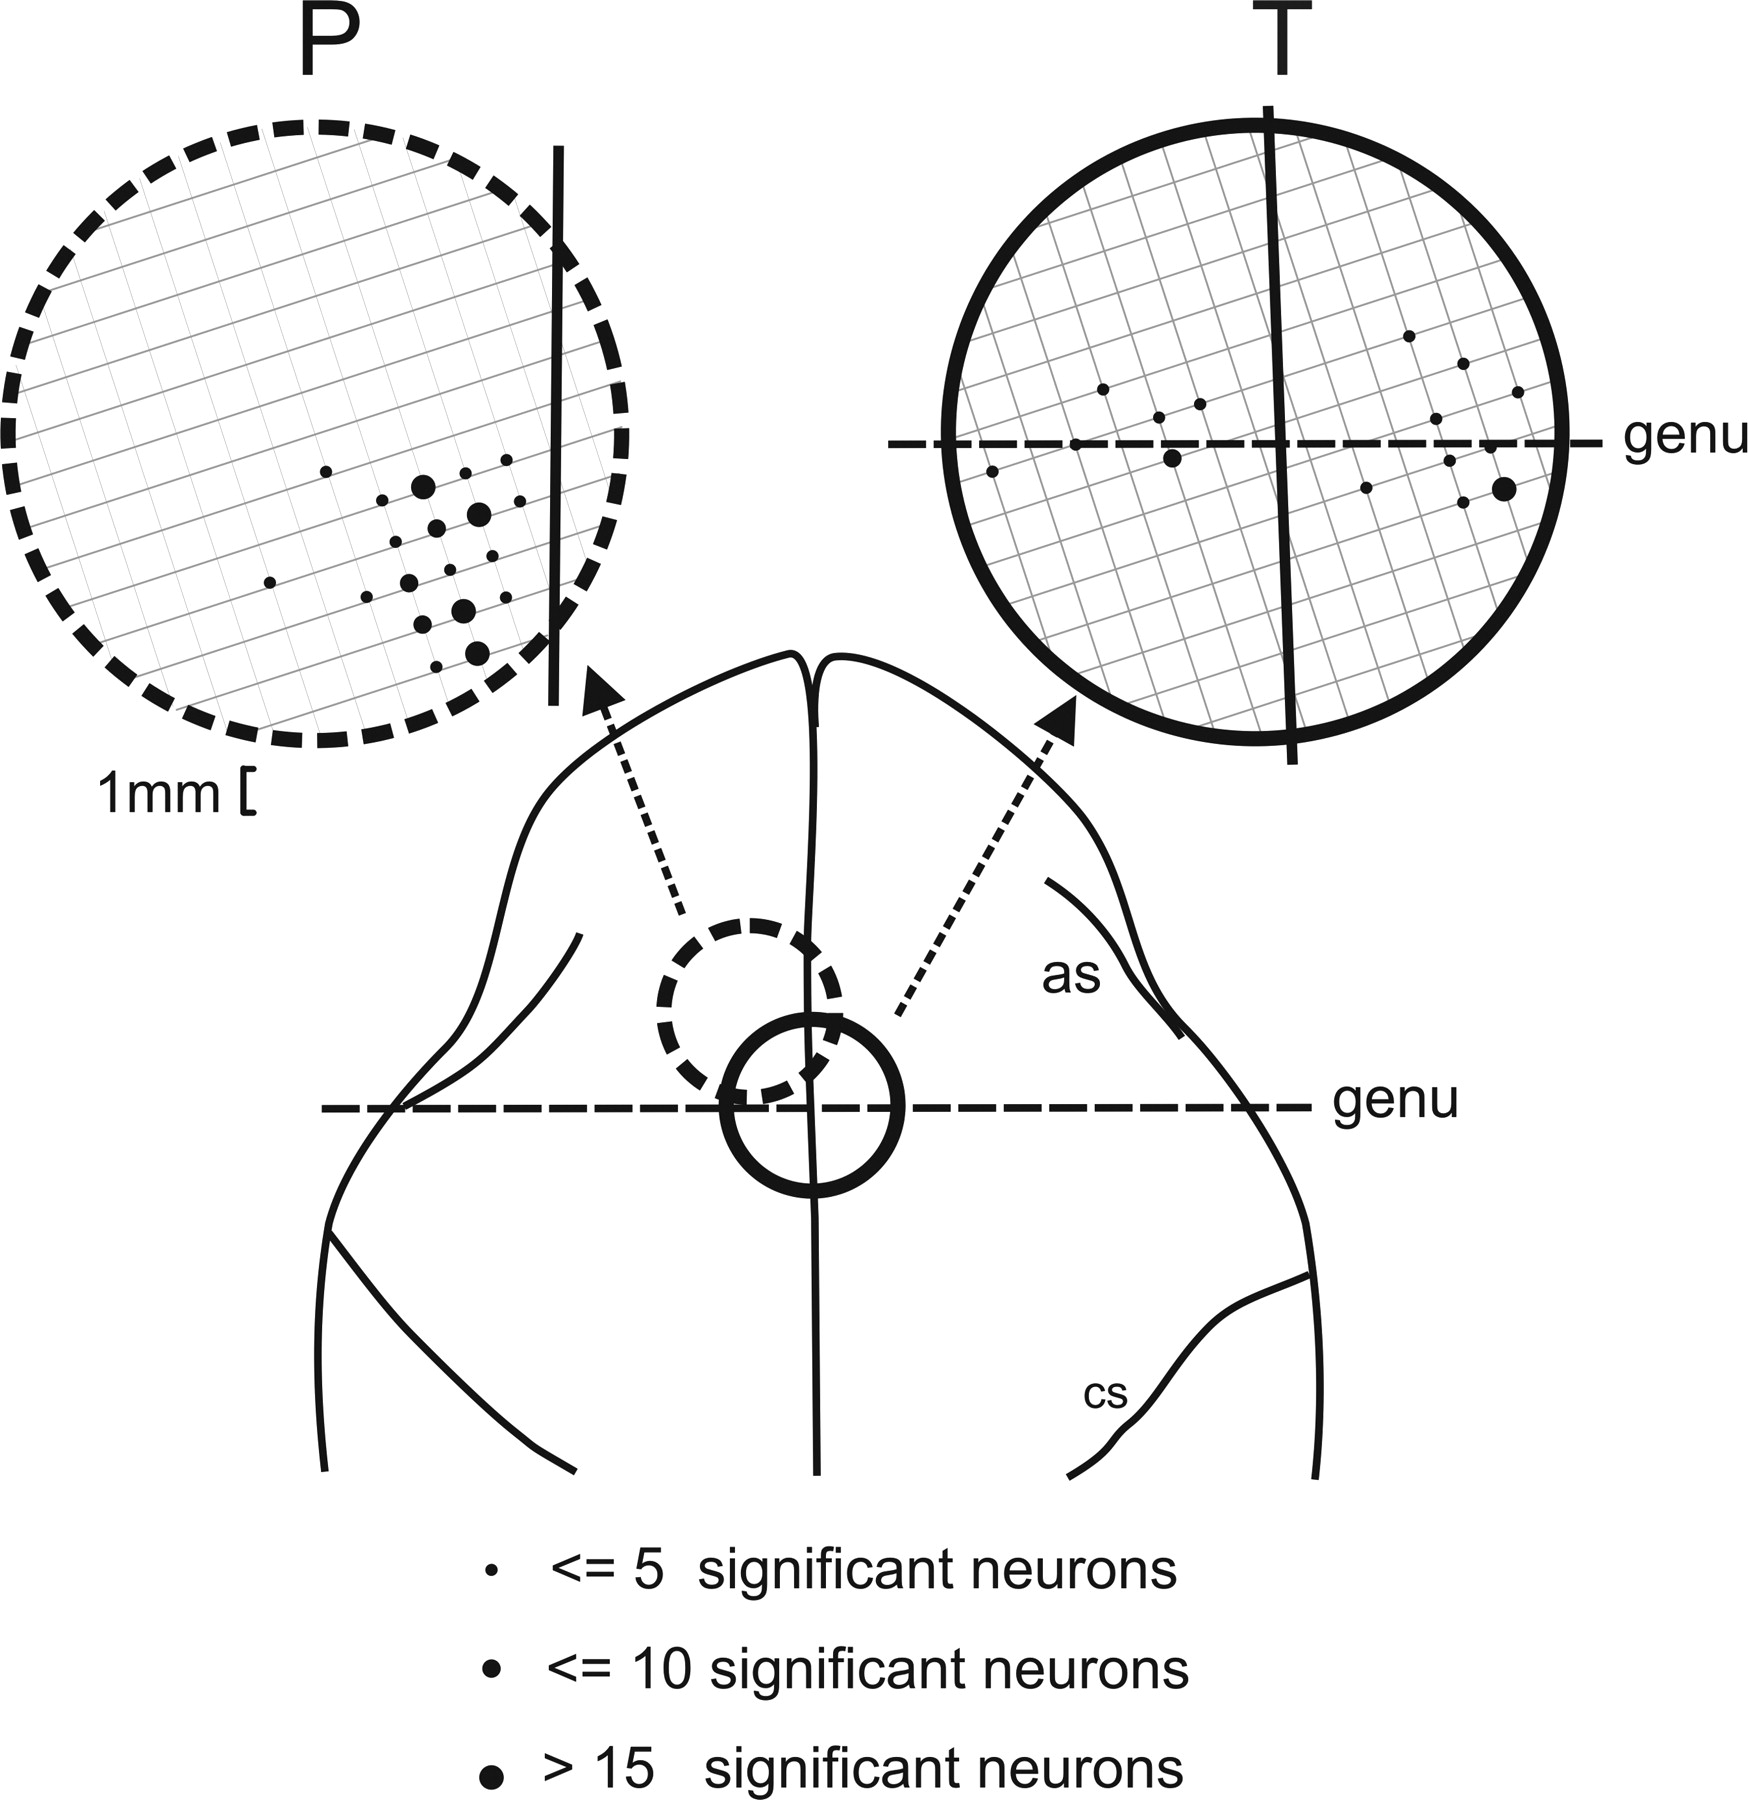
Location of recording sites. Location of recording sites projected onto a dorsal view of the macaque brain. Large circles represent recording chambers. Grids within recording chambers represent the coordinate system of Crist et al. (1988). as, Arcuate sulcus; cs, central sulcus; genu, genu of the arcuate sulcus. Black dots indicate where neurons were recorded. The size of the dots is proportional to the number of significantly modulated neurons that were recorded at a particular site.


Tables
P (n = 23.651) No-delay neutral cue No-delay directional cue Delay neutral cue Delay directional cue % Anticipation 3% 16% 40% 76% % Error 44% 0% 47% 0% Anticipatory latency (ms) −27 −24 −294.5 −348 Anticipatory velocity (°/s) 2.9 3.5 4.5 4.4 Visually guided pursuit latency (ms) 105 99 96 88 Directional selectivity onset (ms) (n = 122) 121 −58 128 −415 -
Median values of measured variables. Negative latency values indicate that movement initiation or directional selectivity occurred before target motion onset.
-
T (n = 5772) No-delay neutral cue No-delay directional cue Delay neutral cue Delay directional cue % Anticipation 10% 38% 65% 77% % Error 35% 0.64% 52% 0.7% Anticipatory latency (ms) −34 −38 −532 −593 Anticipatory velocity (°/s) 3.8 7 4.3 5.7 Visually guided pursuit latency (ms) 97 93 95 82 Directional selectivity onset (ms; n = 45) 200 −119 196 −736 -
Median values of measured variables. Negative latency values indicate that movement initiation or directional selectivity occurred before target motion onset.
-
Supplemental Data
Files in this Data Supplement:
- supplemental material - Supplemental Figure 1
- supplemental material - Supplemental Figure 2


