

Article Figures & Data
Figures
- Figure 1.
Increased cell death in Ung−/− neurons to methotrexate and homocysteine: reversal by folic acid supplementation. Neocortical (CTX) and hippocampal (HIP) neurons were exposed to the dihydrofolate-reductase inhibitor methotrexate (MTX) or vehicle. A , Increase in LDH activity relative to vehicle-treated sister cultures. Two-way ANOVA (72 h) for genotype: F (1,150) = 9.8, p < 0.001 in CTX and F (1,70) = 292.3, p < 0.001 in HIP; treatment: F (1,150) = 27.3, p < 0.001 in CTX and F (1,70) = 69.1, p < 0.001 in HIP; genotype × treatment interaction: F (1,150) = 5.2, p < 0.001 in CTX and F (1,70) = 28.2, p < 0.001 in HIP. B , MTT was measured as a metabolic activity marker and presented as loss of MTT metabolism relative to vehicle-treated sister cultures. ANOVA for genotype: F (1,70) = 0.6, p = 0.5 in CTX and F (1,70) = 305.5, p < 0.001 in HIP; treatment: F (1,70) = 11.3, p < 0.001 in CTX and F (1,70) = 101.4, p < 0.001 in HIP; interaction: F (1,70) = 4.0, p = 0.006 in CTX and F (1,70) = 42.2, p < 0.001 in HIP. C , D , Viable versus damaged neurons were identified by phase-contrast microscopy and propidium iodide counterstaining. Viable neurons are presented as a percentage of all neurons/high-power field. ANOVA for genotype: F (1,40) = 33.1, p < 0.001 in CTX and F (1,40) = 232, p < 0.001 in HIP; treatment: F (1,40) = 35.7, p < 0.001 in CTX and F (1,40) = 56.9, p < 0.001 in HIP. Interaction: F (1,40) = 9.8, p < 0.001 in CTX and F (1,40) = 27, p < 0.001 in HIP. E–G , CTX and HIP neurons were exposed to either HC plus vehicle or HC plus FA. Basal FA concentration in Neurobasal medium is 4 mg/L (∼10 μm). E , Increase in LDH activity relative to vehicle-treated sister cultures. Two-way ANOVA (72 h) for factor genotype: F (1,28) = 8.2, p = 0.008 in CTX and F (1,28) = 29.3, p < 0.001 in HIP; treatment: F (1,28) = 3.3, p = 0.017 in CTX and F (1,28) = 13.4, p < 0.001 in HIP; genotype × treatment interaction: F (1,28) = 0.711, p = 0.7 in CTX and F (1,28) = 3.1, p = 0.026 in HIP. F , G , Viable versus damaged neurons were identified by phase-contrast microscopy and propidium iodide counterstaining. Viable neurons are presented as a percentage of all neurons/high-power field. ANOVA for genotype: F (1,32) = 0.7, p = 0.40 in CTX and F (1,32) = 39, p < 0.001 in HIP; treatment: F (1,32) = 1.5, p = 0.25 in CTX and F (1,32) = 38.1, p < 0.001 in HIP. Interaction: F (1,32) = 0.5, p = 0.7 in CTX and F (1,32) = 10.4, p < 0.001 in HIP. Scale bars: D , G , 50 μm. A–F , # p < 0.05 for neocortical and *p < 0.05 for hippocampal neurons, Ung−/− versus Ung+/+ within the same MTX, HC, or HC plus FA treatment condition. E , F , + p < 0.05 versus corresponding HC without FA. Baseline LDH release and MTT metabolism are given in supplemental Tables 2A (for A , B ) and 2B (for E ) (available at www.jneurosci.org as supplemental material). All experiments were performed at least in triplicate.
- Figure 2.
Increased susceptibility of Ung−/− mice to neurodegeneration after chronic folate depletion in vivo. A , Representative images of 10-μm-thick H&E-stained sections illustrating reduced neuronal density in CA3 of Ung−/− animals as a consequence of chronic folate deficiency (bottom right). B , Density of CA3 pyramidal neurons; ANOVA for genotype: F (1,16) = 22.8, p < 0.0005; treatment: F (1,16) = 11.3, p < 0.005; interaction: F (1,16) = 3.8, p = 0.068; 1-β = 0.44. C – E , Similar neuronal densities in other brain regions. C , Hippocampal subfield CA1. D , Deep cortical layers of frontoparietal cortex. E , Basolateral complex of amygdala. ec, External capsule; int, internal capsule; amc, amygdalar capsule. *p < 0.05, ND versus FD; # p < 0.05, Ung+/+ versus Ung−/−.
- Figure 3.
Biochemical consequences of folate deficiency and Ung genotype. A , Uracil misincorporation in DNA; ANOVA for genotype: F (1,29) = 5.6, p = 0.02. B , BDNF protein levels in hippocampus; ANOVA for interaction: F (1,31) = 16.6, p < 0.0005. C , GSH levels in whole cerebral hemispheres; ANOVA for interaction: F (1,20) = 5.6, p = 0.03. D , GSH levels in cerebellum; ANOVA for interaction: F (1,20) = 20.4, p = 0.0002. *p < 0.05, ND versus FD; # p < 0.05, Ung+/+ versus Ung−/−; + p < 0.05 for interaction; two-way ANOVA and Tukey post hoc; n = 5–9 animals per group.
- Figure 4.
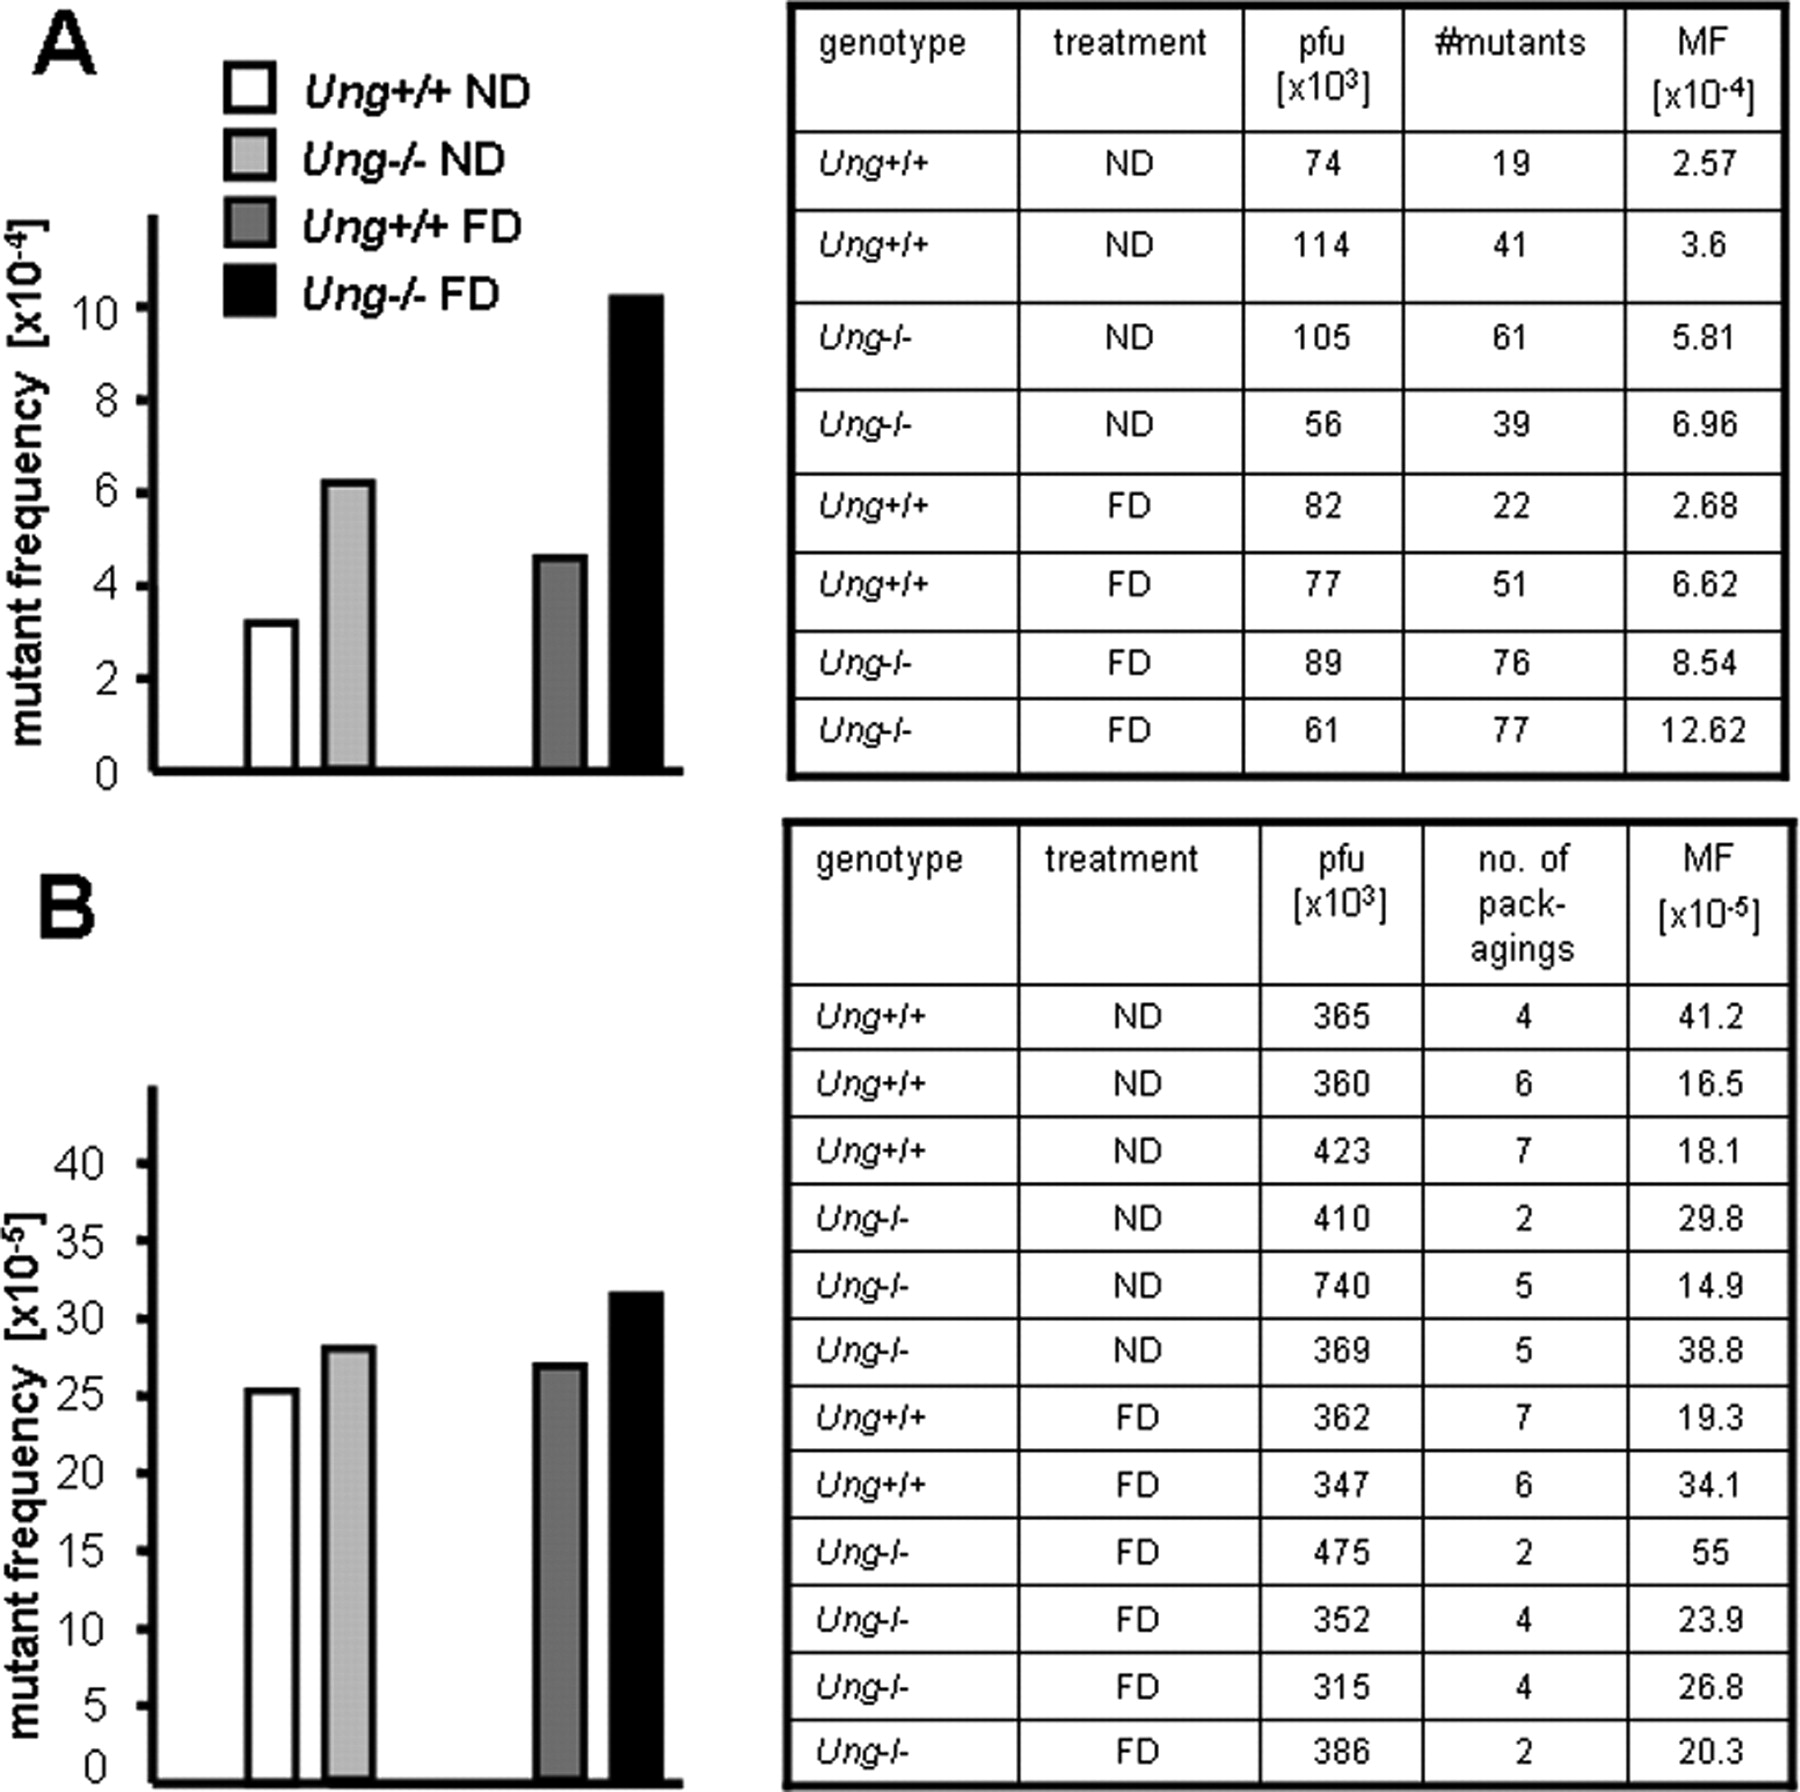
Folate deficiency confers increased mutant frequencies in MEFs but not in brains of Ung−/− mice. A , Mouse embryonic fibroblasts were cultured in folate-deficient medium for 6 d. Average mutant frequencies at the λ cII gene (left) and individual measurements (table) are shown. B , Ung−/−(BigBlue) and Ung+/+(BigBlue) mice were fed a normal or a folate-deficient diet. Average mutant frequencies in brain tissue were assessed after 3 months. Individual measurements are given in the table. pfu, Plaque-forming unit; MF, mutant frequency.
- Figure 5.
Folate deficiency effects on neurotransmitter metabolism. A , Tissue content of 5-HIAA and of 5-HT. B , NA levels in amygdala and hippocampus. Tissue contents are reported per milligram of wet weight. *p < 0.05, ND versus FD; # p < 0.05, Ung+/+ versus Ung−/−. n = 8–10 animals per group.
- Figure 6.
Hippocampal neurogenesis. A , Early steps of neuronal development in the adult dentate gyrus were assessed after 3 months of treatment (control or folate-deficient diet). Cell proliferation was quantified after a 6 d course of once daily intraperitoneal BrdU before the animals were killed. Doublecortin-expressing cells reflect neuronal lineage determination, whereas calretinin represents a marker of early postmitotic granule cells in the hippocampal dentate gyrus. n = 5 animals per group. B , To characterize the effects of folate deficiency on the fate of newly generated cells, animals received a 7 d course of once daily intraperitoneal BrdU 8 weeks after initiation of treatment (control or folate-deficient diet) and 4 weeks before the animals were killed. Neuronal marker NeuN (green in C ) and astrocytic marker S100β (blue in D ) were used for phenotypic analysis of BrdU-positive (red in C and D ) cells. n = 8–10 animals per group. C , A three-dimensional reconstruction of a z-series through a NeuN+ cell along the y–z axis (right narrow panel) and x–z axis (bottom narrow panel), which confirms that BrdU and NeuN are present in the same cell. Scale bar, 15 μm. D , A newly generated S100β+ astrocyte. Scale bar, 5 μm. *p < 0.05, ND versus FD; # p < 0.05, Ung+/+ versus Ung−/−.
- Figure 7.
Behavioral analysis. Behavioral analyses were performed after 3 months on the experimental diet (control or folate-deficient diet). A , B , Latencies ( A ) and path lengths ( B ) of Ung+/+ and Ung−/− animals on folate-deficient or control diet during the acquisition phase of the Morris water maze. There were significant effects of diet and trial number on escape latency and path length (repeated-measures ANOVA; see Results). C , Target preference during probe trial. D , E , Latency to float ( D ) and time floating ( E ) in the behavioral despair test (Porsolt). F , Latency until first entry into the open arms of an elevated plus maze. # p < 0.05, Ung+/+ versus Ung−/−. n = 6–14 animals per group. For statistical analysis, see Results.


Additional Files
Supplemental Data
Files in this Data Supplement:
- supplemental material - Supplemental Tables


