

Article Figures & Data
Figures
- Figure 1.
Dynamics of behavioral performance in the detection task is clustered, autocorrelated, and scale-free. A, A representative series of responses with “runs” of consecutive detected (hits; blue) and undetected (misses; red) stimuli. B, Run probability as a function of run length (top) shows that runs of ∼15–100 s are more abundant in real data (black line) than in random data (gray line). The run-length probability follows power-law scaling for runs longer than three trials. The p value (bottom; paired Wilcoxon signed-rank test) is for the difference between real and random data. Gray lines indicate the uncorrected (p = 0.05) and Bonferroni-corrected (n = 6) significance levels. C, Subjects' responses (grand average, black line, top) have stronger autocorrelations than randomized data (gray line). The difference between measured and random data is significant up to the time lag of ∼170 s (bottom; gray line, p = 0.05, paired Wilcoxon signed-rank test). D, DFA reveals that behavioral data display robust scale-free dynamics. The scaling exponent averaged across all sessions is α = 0.71 ± 0.11 (mean ± SD; thin gray lines). For the grand-average data, αμ = 0.65 (black line). For uncorrelated noise, αref = 0.5 (thick gray line).
- Figure 2.
Infraslow EEG is correlated with task performance. A, Hits (blue) and misses (red) overlaid on FbEEG data (0–200 Hz; gray) and bandpass-filtered ISF (0.01–0.1 Hz; black) from Cz. B, The ISF real part, amplitude (top), and phase (bottom) are shown for part of the data in A. C, Individual power spectra (gray) and the mean power spectrum (black) from Cz in double-logarithmic coordinates.
- Figure 3.
Modulation of the detection probability as a function of phase (A), amplitude (B), and real part (C) of ISFs from Fpz. Top, The change in hit probability relative to mean (black line) with ±SEM (gray lines) across subjects. We estimated the statistical significance of hit probability changes for each bin with cumulative binomial distribution values (right, thin horizontal lines). Statistical significance across subjects was estimated with the paired Wilcoxon signed-rank test (bottom). Horizontal lines indicate uncorrected (p = 0.05) and Bonferroni-corrected (n = 10) significance levels. The bins are consecutive 10 percentiles of phase (A), amplitude (B), and real part (C) of ISFs. The axes range from −π to π (A), from zero to the maximum amplitude (B), and from the minimum to the maximum of 0.01–0.1 Hz EEG (C).
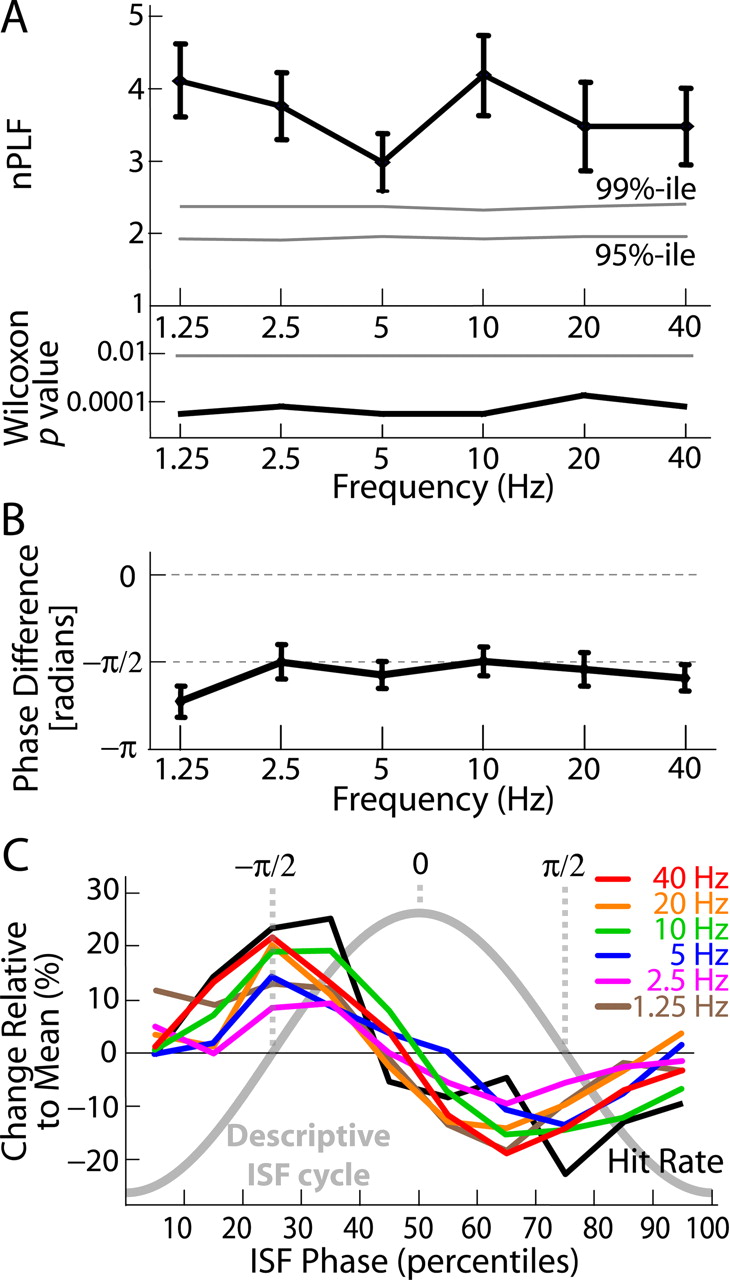
- Figure 4.
EEG oscillations (1–40 Hz) are nested in ISF. A, The amplitude envelopes of six frequency bands from 1.25 to 40 Hz are synchronized with the ISF (top). The normalized phase-locking factors (nPLF ± SEM; black) are well above the distribution of surrogate data (mean = 1; gray lines indicate the 95th and 99th percentiles of surrogates). The statistical significance of nPLFs was estimated with the paired Wilcoxon signed-rank test (bottom). The horizontal line indicates Bonferroni-corrected p = 0.05 (n = 6). B, The phase difference (mean ± SEM) between the amplitude envelope of the faster oscillations and the ISF is consistently at approximately −π/2. C, The correlation of 1–40 Hz oscillation amplitudes (colored lines) with the ISF phase is similar to that of the behavioral data (black line) (compare with Fig. 3A). The ISF phase ranges from −π to π in bins of 10 percentiles. The thick gray line denotes a descriptive ISF cycle.


Additional Files
Supplemental Data
Files in this Data Supplement:
- supplemental material - Supplemental Legend
- supplemental material - Supplemental Figure


