

Article Figures & Data
Figures
- Figure 1.
Pairing odors with LC stimulation suppresses odor responses in the MOB. A, Odor response suppression. Left, Odor-evoked firing rate above spontaneous discharge is plotted for a series of 220 presentations of cumin. During the shaded periods, each of 20 presentations was paired with a 5 s, 5 Hz, 40 μA train of biphasic electrical pulses applied to LC. Each pairing period resulted in a significant lasting suppression of the response to the odor. Right, Peristimulus time histograms show the mean response in each denoted epoch. B, Micrograph of an LC-stimulation site. One intact LC (right) is visible, outlined in white in this Nissl-stained coronal section. A marking lesion denoting the stimulation site in A is evident in the opposite LC (left, arrow). D, Dorsal; M, medial. C, Histogram of effects of LC stimulation. Here and in similar graphs, the poststimulation response (normalized to baseline) is plotted for each of 18 electrical LC-stimulation cases with a single odor.
- Figure 2.
Pairing an odor with chemical LC stimulation suppresses odor responses in the MOB. A, LC response to carbachol injection. Top, The trace shows the timing of two 20 ms, 10 psi puffs of 100 μm carbachol applied to LC. Bottom, The spike rate histogram and raw trace reflect the response of a nearby LC neuron. B, Odor response suppression. Odor-evoked firing rate above spontaneous discharge is plotted for a series of 140 presentations of clove. During the shaded period, each of 20 presentations was paired with a 20 ms, 10 psi puff of 100 μm carbachol applied to LC. Pairing resulted in a significant lasting suppression of the response to the odor. Peristimulus time histograms below show the mean prepairing and postpairing response. C, Histogram of effects of LC stimulation. Effects of all chemical LC stimulations with a single odor are shown, compared with similar experiments using electrical stimulation.
- Figure 3.
Pairing an odor with LC stimulation after local injection of NA antagonists fails to suppress odor responses in the MOB. A, Odor response is not suppressed. Top, Odor-evoked firing rate above spontaneous discharge is plotted for a series of 140 presentations of cardamom. At the arrow, two 400 ms, 3 psi puffs of 1 mm phentolamine and 1 mm propranolol were made local to the recorded cell. During the shaded period, each of 20 presentations was paired with a 5 s, 5 Hz, 40 μA train of biphasic electrical pulses applied to LC. The odor response was unaffected by pairing. Bottom, Peristimulus time histograms show the mean prepairing and postpairing response. B, Mean population effects of LC stimulation with NA antagonists. Normalized baseline odor responses (black; 1 for all sites by definition) are compared with mean post-LC stimulation responses (white) for control electrical stimulation, stimulation with saline injections, and stimulation with NA antagonist injections. Bars show mean and SEM (Wilcoxon signed rank test, **p < 0.01, *p < 0.05). D, Histogram of effects of LC stimulation. Effects of all LC stimulations with antagonist treatment are shown and compared with control electrical stimulation.
- Figure 4.
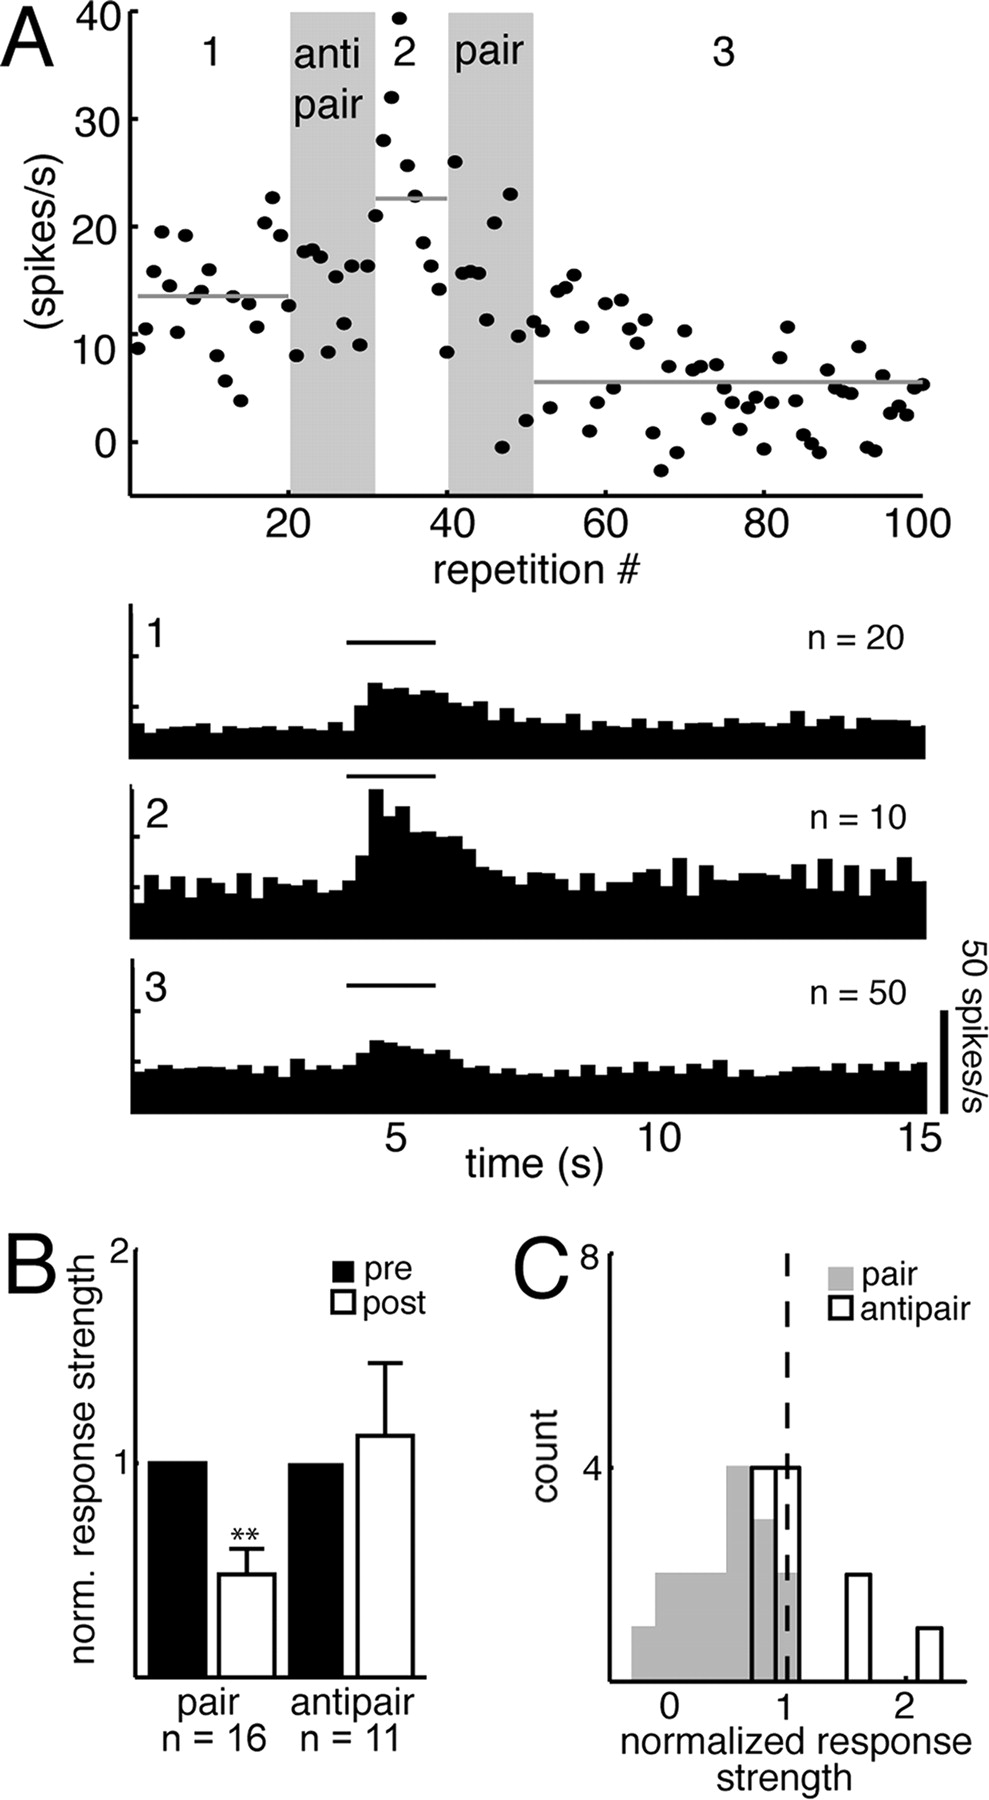
LC-mediated odor response suppression is stimulus-specific. A, Stimulus-specific odor response suppression. Top, Odor-evoked firing rate above spontaneous discharge in response to the preferred odor (lemon) of this cell is plotted for a series of 100 presentations. Lemon was interleaved with presentation of three nonpreferred odors. During the shaded periods, each of 10 presentations of either a nonpreferred odor (antipair) or the preferred odor (pair) was paired with a 5 s, 5 Hz, 50 μA train of biphasic electrical pulses applied to LC. Only the pair condition significantly suppressed the response. Bottom, Peristimulus time histograms show the mean response in each denoted epoch. B, Mean population effects of LC stimulation. Normalized baseline odor responses (black; 1 by definition) are compared with mean post-LC stimulation responses (white) for pair and antipair stimulation. Bars show mean and SEM (poststimulation responses significantly lower than 1, Wilcoxon signed rank test, **p < 0.001). C, Histogram of effects of LC stimulation. Effects of all LC stimulations are shown for electrical stimulation in the pair (black) and antipair (gray) conditions.
- Figure 5.
Pairing urine with LC stimulation suppresses responses to urine. A, Urine response suppression. Left, Odor-evoked firing rate above spontaneous discharge is plotted for a series of 60 presentations of urine. During the shaded period, each of 20 presentations was paired with a 5 s, 5 Hz, 40 μA train of biphasic electrical pulses applied to LC. Pairing resulted in a significant lasting suppression of the response to urine. Right, Peristimulus time histograms show the mean response in each denoted epoch. C, Histogram of effects of LC stimulation. Effects of all electrical LC stimulations with urine are shown, compared with all electrical stimulations with food stimuli.
- Figure 6.
Mice show behavioral habituation to LC-stimulation-paired urine. A, Behavioral habituation testing paradigm. Mice were exposed to two urine samples under anesthesia, and one was paired to LC electrical stimulation. The mice were placed 24 h later in a Y-maze containing both urine samples, and investigation time was measured for both stimuli. B–E, Behavioral data. B, C, Mean absolute investigation time is compared between stimuli for control and stimulated (stim.) mice, quantified as direct sniffing (B) or dwelling (C). Bars show mean and SEM (paired t test, *p < 0.05, **p < 0.001). D, E, A normalized measure of bias is shown for control and stimulated mice, calculated from direct sniffing (D) or dwelling (E). Lines show median values (bias significantly different from 1, Wilcoxon signed rank test, *p < 0.05). The design was balanced for the urine stimuli used, and subjects showed no systematic preference for any of the three strains contributing urine (supplemental Fig. 5, available at www.jneurosci.org as supplemental material).


Additional Files
Supplemental Data
Files in this Data Supplement:
- supplemental material - Supplemental Figure 1
- supplemental material - Supplemental Figure 2
- supplemental material - Supplemental Figure 3
- supplemental material - Supplemental Figure 4
- supplemental material - Supplemental Figure 5


