

Article Figures & Data
Figures
- Figure 1.
Microtubules in phr mutant axons. A , B , Forebrain explants from wild-type and phr embryos, α-tubulin immunofluorescence. Areas of insets ( A′ , B′ ) are shown with dashed lines. Microtubules in mutants exhibit small single or double loops (arrows) as well as large tangles (arrowheads). Kymograph analysis shows more rapid translocation of EB3-EGFP-positive microtubule plus-ends in mutants ( D ) compared with wild type ( C ) (Mann–Whitney U test, p < 0.01), as indicated by the slope of the puncta. E , Plot of all measured puncta showing quartile divisions of plus-end growth rate (slope), heavy bars show mean values. F , Frames from a time-lapse recording of wild-type axons with a moderate level of EB3 label. Microtubules grow and shrink (arrowheads indicate tips), without coil formation. This behavior is reflected in the kymograph ( H ) made from another wild-type axon. G , Mutant axons. The microtubule coils proximally (arrowhead) while the tip remains relatively stationary. I , Kymograph of a different mutant axon, again showing reduced shrinkage. A coil formed at the point indicated by the upper arrow. The microtubule retracted at the point indicated by the lower arrow. See supplemental material (available at www.jneurosci.org). In kymographs, d indicates distance and t indicates time. Scale bar, 20 μm.
- Figure 2.
Phosphorylation of p38 and JNK in phr mutants. A , B , Cultured wild-type and mutant forebrain axons labeled with anti-α-tubulin, DTAF (total protein), and anti-phospho-p38. C , Higher magnification of a mutant axon, showing an example of regions of analysis used for measuring the phospho-p38:DTAF ratio in normal (dashed line) versus defective (dotted line) microtubule areas. D , The proportion of phospho-p38:DTAF does not very between mutant and wild-type axons, and is the same in looped/disorganized regions as in adjacent areas of the axon. Bars indicate SEM. E , Mutant neurons after treatment with 50 μm SB203580. Microtubules, labeled with anti-α-tubulin, form loops in the axon. F , G , Wild-type and mutant forebrain neurons labeled with anti-α-tubulin (magenta) and anti-phospho-JNK (yellow). Arrows indicate growth axon tips with visible increase in phospho-JNK immunofluorescence. H , Ratio of phospho-JNK to DTAF in wild-type and mutant growth cones The plot shows quartile divisions of values and heavy bars indicate mean values. I , phr mutant axons, labeled for α-tubulin, following treatment with 20 μm SP600125. Loops are indicated by arrowheads. J , K , Assessment of SP600125 efficacy by analysis of phosphorylation of cJUN, a target of JNK. Levels of phospho-cJUN are high in control explants (0.1% DMSO; J ), and lower in explants treated with 20 μm SP600125 ( K ). Images are pseudocolored, with white representing the highest intensity, as indicated by the wedge.
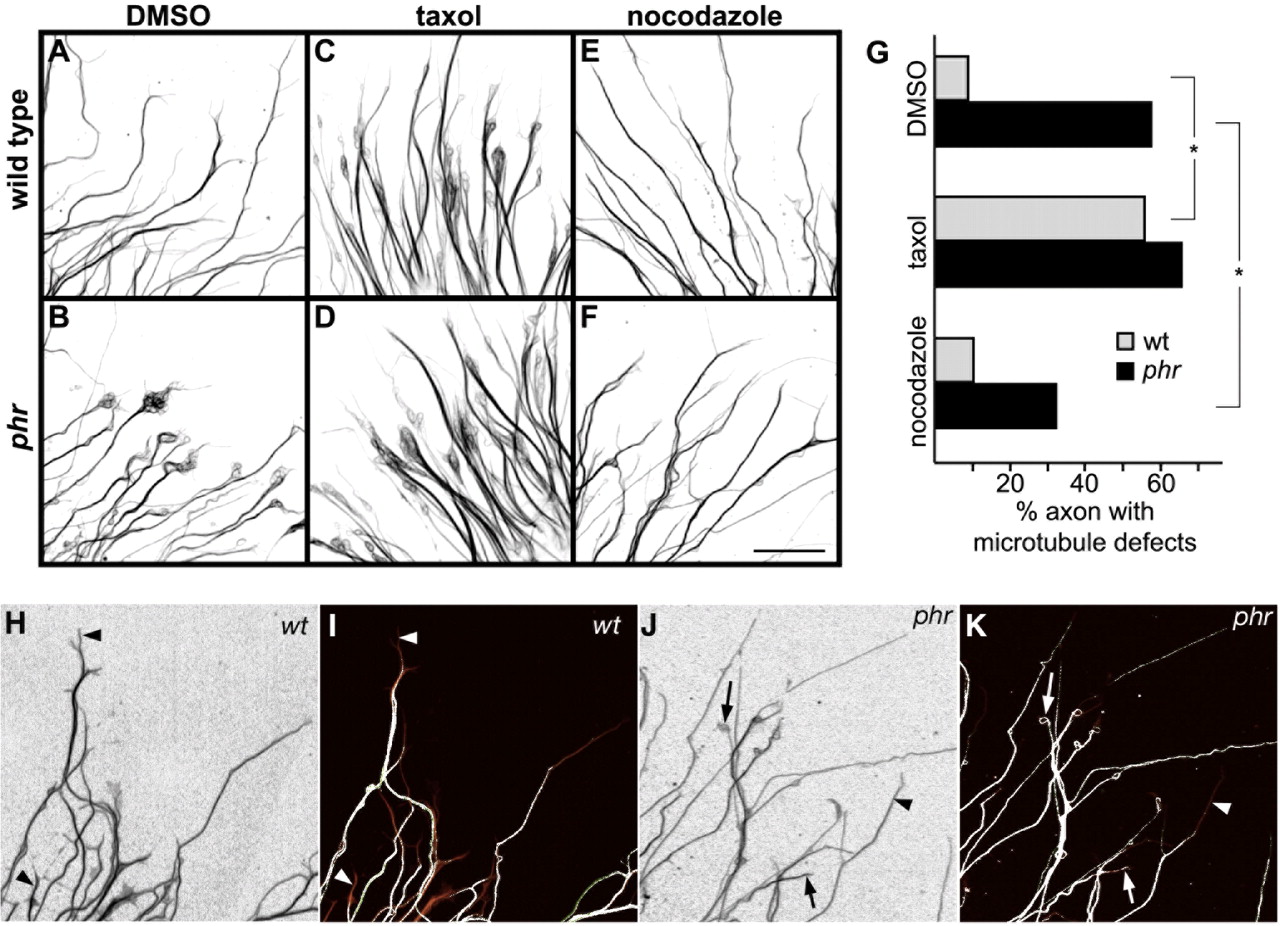
- Figure 3.
Phenocopy and suppression of microtubule defects. A , B , Control cultures treated with DMSO (n wt = 276, nphr = 150). C , D , Overnight treatment with 20 nm taxol phenocopies the microtubule looping seen in phr (n wt = 156, nphr = 106). E , F , Nocodazole treatment leads to a reduction in microtubule defects (n wt = 71, nphr = 78). G , Proportion of axons showing one or more microtubule defects (single or multiple loops) (*χ2 test, p < 0.001). H–K , Double label for total ( H , J ) and detyrosinated tubulin. Regions containing detyrosinated tubulin are indicated in white in panels I and K. Arrowheads indicate axon tips containing low levels of detyrosinated tubulin, whereas arrows indicate axon tips with high levels of detyrosinated tubulin.
- Figure 4.
Nocodazole rescues the habenular commissure defect in phr mutants. A , Habenular commissure (arrow) of a 3 dpf wild-type embryo labeled for acetylated tubulin. B , The commissure is absent in phr mutants. C , Rescue of habenular commissure formation in an embryo injected with nocodazole at 2 dpf. Scale bar, 20 μm.


Additional Files
Supplemental Data
Files in this Data Supplement:
- supplemental material - Supplemental Material
- supplemental material - Supplemental Movie 1
- supplemental material - Supplemental Movie 2


