

Abstract
In neurons of the cerebellar nuclei, long-term potentiation of EPSCs is induced by high-frequency synaptic excitation by mossy fibers followed by synaptic inhibition by Purkinje cells. Induction requires activation of synaptic receptors as well as voltage-gated Ca channels. To examine how Purkinje-mediated inhibition of nuclear neurons affects Ca levels during plasticity-inducing stimuli, we have combined electrophysiology, Ca imaging, and pharmacology of cerebellar nuclear neurons in mouse cerebellar slices. We find that spontaneous firing generates tonic Ca signals in both somata and dendrites, which drop during 500 ms, 100 Hz trains of Purkinje IPSPs or hyperpolarizing steps. Although the presence of low-voltage-activated (T-type) Ca channels in nuclear neurons has fostered the inference that disinhibition activates these channels, synaptic inhibition with a physiological chloride equilibrium potential (ECl) (−75 mV) fails to hyperpolarize neurons sufficiently for T-type channels to recover substantially. Consequently, after IPSPs, Ca signals return to baseline, although firing is accelerated by ∼20 Hz for ∼300 ms. Only after hyperpolarizations beyond ECl does Ca rise gradually beyond baseline, as firing further exceeds spontaneous rates. Cd2+ (100 μm), which nearly eliminates L-type, N-type, P/Q-type, and R-type Ca currents while sparing approximately one-half the T-type current, prevents Ca changes during and after hyperpolarizations to ECl. Thus, high-frequency IPSPs in cerebellar nuclear neurons evoke little postinhibitory current through T-type channels. Instead, inhibition regulates Ca levels simply by preventing action potentials, which usually permit Ca influx through high-voltage-activated channels. The decreases and restoration of Ca levels associated with Purkinje-mediated inhibition are likely to contribute to synaptic plasticity.
Introduction
Neurons of the cerebellar nuclei fire action potentials spontaneously at tens of hertz in vivo and in vitro (Thach, 1968; Jahnsen, 1986a; McDevitt et al., 1987; LeDoux et al., 1998; Aizenman and Linden, 1999; Raman et al., 2000). Intrinsic firing can be silenced or slowed by inhibition from Purkinje neurons and accelerated by synaptic excitation from mossy fibers and inferior olivary fibers. EPSCs in nuclear cells can be strengthened by combinations of excitation and inhibition: trains of high-frequency EPSPs potentiate EPSCs if they are followed either by postsynaptic hyperpolarization or by trains of IPSPs (Pugh and Raman, 2006, 2008). This long-term potentiation (LTP) is prevented by either NMDA receptor antagonists or voltage–clamp protocols that prevent activation of voltage-gated Ca currents, suggesting that induction occurs in two phases. First, local Ca influx through NMDA receptors primes activated synapses to be potentiated. Second, a more widespread Ca influx through voltage-gated Ca channels triggers potentiation only at primed synapses (Pugh and Raman, 2006, 2008). These observations raise the question of how inhibition and postinhibitory depolarizations regulate voltage-gated Ca influx in cerebellar nuclear neurons.
One possibility is that disinhibition activates low-voltage-activated (LVA) T-type Ca channels (CaV3.x; Carbone and Lux, 1984; Bean, 1985; Fox et al., 1987; Perez-Reyes et al., 1998). These channels are highly expressed by cerebellar nuclear neurons and contribute to “rebound” depolarizations evoked after strong hyperpolarizations (Llinás and Mühlethaler, 1988; Aizenman and Linden, 1999; Gauck et al., 2001; Molineux et al., 2006; Alviña et al., 2009). Moreover, induction protocols that combine synaptic excitation with voltage steps that activate T-type but not other Ca currents successfully generate LTP, indicating that T-type channels can provide a voltage-gated Ca influx that is sufficient for plasticity (Pugh and Raman, 2006). The extent to which T-type currents are evoked after physiological synaptic inhibition, however, depends on their voltage dependence of recovery from inactivation. Hyperpolarization by GABAA receptors activated by Purkinje cells is limited by the chloride equilibrium potential (ECl), near −75 mV in nuclear cells (Jahnsen, 1986b; Aizenman and Linden, 1999). T-type currents often require more negative voltages for recovery, however (McRory et al., 2001; Perez-Reyes, 2003), raising the possibility that synaptic inhibition recruits them only minimally. Consistent with this idea, recent work suggests that Purkinje-mediated inhibition is insufficient to trigger bursts of rebound action potentials (Alviña et al., 2008).
To identify the types of Ca currents evoked after synaptic inhibition in cerebellar nuclear cells, we compared voltages reached during trains of Purkinje-mediated IPSPs to voltages required for recovery of T-type currents. Next, we measured somatic and dendritic Ca signals during spontaneous firing, IPSP trains, and step hyperpolarizations, in the absence and presence of Ca channel antagonists. The results indicate that spontaneous firing produces a cell-wide tonic Ca load. IPSPs decrease Ca levels but fail to produce a postinhibitory overshoot of Ca through T-type channels. Instead, Ca signals during regular spiking and after synaptic inhibition are dominated by current flow through N, P/Q, and R-type channels.
Materials and Methods
Preparation of dissociated cerebellar nuclear cells.
All animal procedures were approved by the Northwestern University Institutional Animal Care and Use Committee and were performed in accordance with institutional guidelines. Cerebellar nuclear neurons were acutely dissociated from 13- to 15-d-old C57BL/6 mice (Charles River Laboratories) as described by Raman et al. (2000) and Afshari et al. (2004). Mice were deeply anesthetized with halothane and decapitated. Cerebella were removed and placed in cooled oxygenated Tyrode's solution, containing the following (in mm): 150 NaCl, 4 KCl, 2 CaCl2, 2 MgCl2, 10 HEPES, and 10 glucose (pH 7.4 with NaOH). Parasagittal slices were made with a tissue chopper (McIlwain) and transferred to a vial containing 2 ml of MEM (Invitrogen) with 10 mm HEPES, 0.5 mm EDTA, 1 mm cysteine, 5 mm sodium acetate, 40 U/ml papain, and 1 U/ml chondroitinase ABC. Slices were incubated in oxygenated dissociation solution for 20 min at 31°C and then washed in MEM-HEPES with 1 mg/ml trypsin inhibitor and 1 mg/ml BSA. Cerebellar nuclei were dissected out of the slices with fine tungsten needles. Tissue chunks were placed in warmed Tyrode's and then transferred to a recording chamber in which they were triturated with polished Pasteur pipettes. Cells settled in the chamber for 1 h before recordings were made.
Preparation of cerebellar slices.
Slices were made from 13- to 15-d-old C57BL/6 mice (Charles River Laboratories) as described by Pugh and Raman (2006). Mice were anesthetized with halothane or isoflurane and transcardially perfused with cold (4°C) artificial CSF (ACSF) containing the following (in mm): 123.5 NaCl, 3.5 KCl, 1.5 CaCl2, 1 MgCl2, 26 NaHCO3, 1.25 NaH2PO4, and 10 glucose. A concentration of Ca < 2 mm and K > 3 mm (to give an EK of −93 mV) was selected in an effort to mimic physiological ionic conditions (Hansen, 1985). Mice were decapitated, and the cerebella were removed and placed in ice-cold ACSF. Parasagittal cerebellar slices were cut on a vibratome slicer (VT 100S; Leica) and incubated at 35°C in oxygenated (95% O2/5% CO2) ACSF solution for 1 h and then maintained at room temperature.
Electrophysiological recording.
Patch pipettes with resistances of 3–5 MΩ were pulled from borosilicate glass on a Sutter P97 puller (Sutter). Voltage–clamp recordings were made with an Axopatch 200B amplifier and current–clamp recordings with an Axoclamp 2B amplifier, and data were acquired with pClamp acquisition software (Molecular Devices). For whole-cell voltage–clamp recording from acutely dissociated cells, pipettes were wrapped with Parafilm to reduce capacitance and filled with a solution containing the following (in mm): 120 TEA-CH3O3S, 10 NaCl, 10 EGTA, 2 MgCl2, 25 sucrose, 14 Tris-creatine phosphate, 4 MgATP, 0.3 Tris-GTP, pH 7.4, with TEA-OH. For application of drugs, cells were positioned in front of a series of gravity-driven flow pipes, containing the following (in mm): 140 NaCl, 10 TEA-Cl, 2 CaCl2, 10 glucose, and 900 nm TTX. For isolation of different Ca currents, one or more of the following Ca blockers were included in specific pipes: 10 μm mibefradil, 10 μm nimodipine, 10 μm ω-conotoxin MVIIC, or 300 μm CdCl2.
For slice recording, slices were superfused with warm (33–35°C) oxygenated ACSF solution with 5 μm DNQX (6,7-dinitroquinoxaline- 2,3-dione) to block AMPA receptors and 10 μm CPP [(RS)-3-(2-carboxypiperazin-4-yl)-propyl-1-phosphonic acid] to block NMDA receptors. For recordings of voltage-clamped Ca currents, GABAA receptors were blocked with 10 μm SR95531 and K currents with 1 mm tetraethylammonium (TEA). Recordings were made from cells with somatic diameters of 15–20 μm. For voltage–clamp recordings of rebound current, the intracellular solution contained the following (in mm): 110 TEA-CH3O3S, 4 NaCl, 10 EGTA, 2 MgCl2, 14 Tris-creatine phosphate, 4 MgATP, 0.3 Tris-GTP, 10 HEPES, and 0.6 QX-314 [N-(2,6-dimethylphenylcarbamoylmethyl) triethylammonium bromide] (pH 7.4 with TEA-OH). QX-314 blocked both Na and Ih current. To test Cd2+ sensitivity in voltage–clamp mode, the intracellular solution was the same, except EGTA was replaced with the Ca indicator Fluo-4 (100 μm) for imaging, and MgATP was omitted.
For current–clamp recordings and Ca imaging, pipettes were filled with an intracellular solution containing the following (in mm): 120 potassium gluconate, 4 sodium gluconate, 4 NaCl, 2 MgCl2, 14 Tris-creatine phosphate, 4 MgATP, 0.3 Tris-GTP, 10 HEPES, 20 sucrose, and 0.1 Fluo-4 (pH 7.4 with KOH). A subset of experiments was performed with 200 μm Fluo-5F as the Ca indicator. IPSCs were recorded with the same solution but with Ca indicator replaced by 1 mm EGTA and 0.6 mm QX-314 included. After a whole-cell recording was established, the spontaneous firing rate was recorded, and the average membrane potential was noted (range, −48 to −57 mV). If cells depolarized or hyperpolarized during the recording, a holding current was applied to maintain the mean membrane potential near its initial value to provide a consistent baseline from which firing rates and changes in Ca signals could be measured. IPSPs and IPSCs were elicited by stimulation of the white matter surrounding the cerebellar nuclei with 45–100 μs voltage pulses delivered through a concentric bipolar electrode (FHC).
For pharmacological studies, slices were perfused with ACSF containing Ca channel blockers 10 μm nimodipine, 10 μm mibefradil, or 10 μm NNC 55-0396. Recordings were made ≥10 min after perfusion was initiated. For experiments with ω-conotoxin MVIIC and SNX-482, the flow of ACSF was interrupted after collection of control data, and the blocker of interest was added to the recording chamber for a final concentration of 10 μm or 500 nm, respectively. Recordings were made after the drug equilibrated in the chamber for 7–8 min. After perfusion was interrupted, the bath temperature gradually decreased toward room temperature. Pilot experiments, in which the flow was stopped and temperature decreased but no drug was added, indicated that Ca levels were not detectably affected by these manipulations. Cd2+ (100 μm) was applied with both methods.
For perforated-patch recordings, the pipette solution contained the following (in mm): 120 potassium gluconate, 4 sodium gluconate, 4 NaCl, 2 MgCl2, 10 HEPES, and 20 sucrose (pH 7.4 with KOH). Gramicidin in DMSO (10–15 mg/ml) was added to the pipette solution just before recording to give a final concentration of 10–20 μg/ml. In some recordings, 1 or 2 mm TEACl was added to the pipette solution so that unintentional rupture of the perforated patch would be detectable by the broadening of action potentials. In the rest of the recordings, the NaCl was replaced with equimolar sodium gluconate to set ECl near −90 mV so that unintentional rupture would make IPSP reversal strongly negative.
Ca imaging.
Ca-dependent fluorescence changes were recorded with TILLvisION Software (TILL Photonics). Indicators were excited with a Polychrome IV light source (TILL Photonics), with the field of excitation constrained to a 10 × 15 μm square positioned over either the soma or the dendrite. Emitted light was filtered with a 510 nm dichroic mirror and 520 nm low-pass filter and detected with the photodiode. Voltage signals from the photodiode were acquired with pClamp. Background fluorescence was subtracted from each record, and the fluorescence signal recorded at −80 mV (in the absence of spiking) was subtracted from the fluorescence signal during each protocol. These values were then normalized to the fluorescence signal recorded at −80 mV to yield ΔF/F. The Ca levels during IPSPs or hyperpolarizations were taken as the mean Ca signal during the last 20 ms of the steps. Ca levels reported after hyperpolarizations are the mean Ca signals between 280 and 300 ms after the offset of the train or steps.
For imaging with AM dyes, ACSF containing 5 μm Fluo-4 AM and 0.01% Pluronic F-127 was locally applied to selected cerebellar nuclear cells though a puffer pipette with a 35–45 μm tip. Positive pressure was stopped during each recording and was reapplied between recordings as necessary.
Data analysis and chemicals.
Data were analyzed with IGOR-Pro (Wavemetrics) and are presented as mean ± SE. Statistical significance was assessed with two-tailed t tests. Junction potentials are subtracted from all data. Stimulus artifacts are digitally reduced in all figures. DNQX, CPP, SR95531, and NNC 55-0396 were from Tocris Cookson; Fluo-4, Fluo-5F, Fluo-4AM, and Pluronic F127 were from Invitrogen; SNX-482 was from Peptides International; and TTX was from Alomone. All other drugs were from Sigma-Aldrich.
Results
Induction of LTP in cerebellar nuclear neurons requires synaptic excitation from mossy fibers coupled with synaptic inhibition from Purkinje cells (Pugh and Raman, 2006, 2008). Since induction requires changes in intracellular Ca, we wished to assess the sources of Ca current and resulting Ca signals that are triggered by hyperpolarizations of a few hundred milliseconds, i.e., durations similar to those that induce LTP, measured under recording conditions and at ages that permit plasticity to occur. Because nuclear cells are known to express T-type Ca channels, which recover from inactivation at hyperpolarized voltages and activate with relatively small depolarizations, we were particularly interested in testing whether they might be recruited by patterns of inhibition that can generate plasticity. Therefore, to assess the extent and rate of recruitment of T-type Ca currents by hyperpolarization, we measured the voltage dependence and time course of recovery of LVA, rapidly inactivating Ca currents in cerebellar nuclear neurons. Recordings were made from voltage-clamped cells in cerebellar slices at 35°C with pharmacological blockade of K, Na, and HCN channels, as well as AMPA, NMDA, and GABAA receptors. From a holding potential of −60 mV, cells were stepped to voltages between −110 and −50 mV for a fixed duration (ranging from 100 to 500 ms) and then depolarized to −50 mV to elicit T-type current. As shown in Figure 1A, steps to the most hyperpolarized conditioning potentials recruited a large T-type current (−1.2 ± 0.15 nA at −50 mV after 500 ms at −110 mV; N = 9). Because T-type current amplitude depended strongly on both the voltage and the duration of hyperpolarization, we also measured the time course of recovery of the current at −70, −90, and −110 mV (Fig. 1B). Boltzmann fits to the data of Figure 1A indicated that half-maximal recovery of T-type currents required 500 ms step hyperpolarizations to −89 mV; briefer steps required deeper hyperpolarizations to elicit currents of a comparable amplitude. Steps to voltages near −70 mV, however, recruited little T-type current, even with the longest recovery intervals tested (−112 ± 13 pA or 9.3 ± 1.1% of maximum; N = 9).
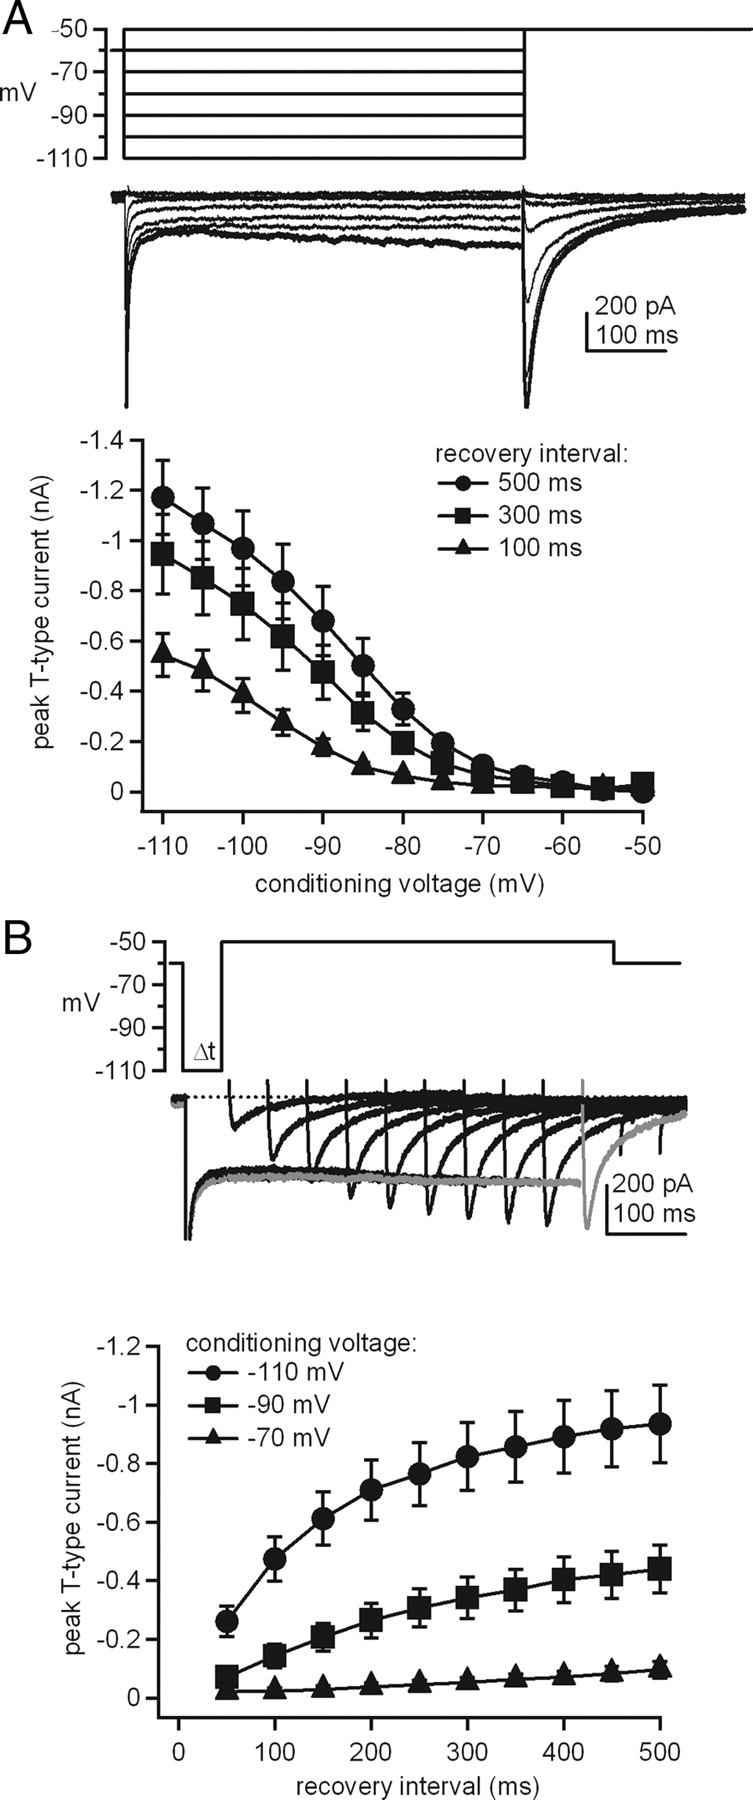
T-type (rebound) Ca currents in cerebellar nuclear neurons. A, Top, Voltage protocol and Ca currents evoked at −50 mV from different conditioning voltages. Bottom, T-type current amplitudes versus hyperpolarizing voltage for different durations of the conditioning step (N = 9). B, Top, Voltage protocol and T-type Ca currents evoked at −50 mV, overlaid for various recovery intervals (50–500 ms). Same cell as A. Gray trace indicates the sweep with the longest recovery interval. Bottom, T-type current amplitude versus recovery interval for different recovery voltages (N = 9).
Because ECl in cerebellar nuclear cells is between −73 and −75 mV (Jahnsen, 1986b; Aizenman and Linden, 1999), these observations raised the possibility that Purkinje-mediated IPSPs might not hyperpolarize cells sufficiently for T-type Ca currents to be activated upon disinhibition. We verified that ECl in our preparation matched published values (from guinea pig and rat) by measuring the reversal of IPSPs with gramicidin perforated-patch recordings. Under these conditions, IPSPs indeed reversed at −74.5 ± 1.5 mV (N = 10). We therefore made whole-cell recordings with solutions that set ECl at −75 mV and confirmed that IPSCs and IPSPs evoked by a single stimulation of Purkinje afferents reversed near the predicted value (−74.7 ± 0.8 mV for IPSCs; N = 15; −74.8 ± 1.2 mV for IPSPs; N = 13) (Fig. 2A,C). Single stimuli activated an inhibitory conductance of 61.1 ± 10.3 nS (whole cell; N = 6). Under similar recording conditions, spontaneous presynaptic action potentials activate a conductance of 2.25–5.25 nS (Telgkamp and Raman, 2002), from which we estimated that the evoked IPSPs in the present study probably resulted from simultaneous activation of 10–25 Purkinje afferents.

Purkinje IPSCs and IPSPs in cerebellar nuclear neurons with physiological ECl. A, Current–voltage curve for the peaks of the IPSCs shown in the inset. Inset, IPSCs evoked at different potentials, as labeled, by stimulation of Purkinje axons. B, Spontaneous firing interrupted by a train of Purkinje-mediated IPSPs evoked at 100 Hz for 500 ms in a perforated-patch recording (“gramicidin”; top) and a whole-cell recording (bottom). C, Reversal potential of synaptic responses (“Erev”; N = 10; N = 13) and the most negative voltages reached during IPSPs evoked at 100 Hz (“IPSPs”; N = 10; N = 18) for perforated-patch and whole-cell recordings.
Next, using similar stimulus intensities, we measured how negative the postsynaptic membrane potential became during high-frequency stimulation of Purkinje-mediated IPSPs evoked in spontaneously firing nuclear neurons. With no injected current, a 500 ms, 100 Hz train of Purkinje IPSPs hyperpolarized nuclear cells only to −70 ± 1 mV (gramicidin; N = 10) or −67 ± 1 mV (whole cell; N = 18) (Fig. 2B,C). At these potentials, which are less negative than ECl, little T-type current is expected to recover (from Fig. 1A). These results are consistent with previous studies indicating that GABAB receptors, which couple to postsynaptic K currents, are not readily activated by high-frequency stimulation of Purkinje afferents, at least in slice preparations (Morishita and Sastry, 1995; Mouginot and Gähwiler, 1995; Telgkamp et al., 2004). Thus, trains of Purkinje IPSPs alone, at rates and intensities that induce LTP when preceded by synaptic excitation (Pugh and Raman, 2008), do not hyperpolarize nuclear neurons sufficiently for a large proportion of T-type Ca channels to activate after disinhibition, at least as measured somatically.
A potentially complicating factor, however, is that most inhibitory inputs are somatic (Chan-Palay, 1977), whereas LVA Ca channels are dendritic (Muri and Knöpfel, 1994; Gauck et al., 2001; Pugh and Raman, 2008). If dendrites are hyperpolarized to a greater extent than somata, then T-type channels might be engaged by disinhibition despite the relatively mild hyperpolarization of the soma. To explore this possibility, we performed imaging experiments to measure Ca influx in both somata and dendrites during spiking and nonspiking periods in nuclear cells. Fluo-4 (100 μm; Kd = 345 nm; Invitrogen) was included in the whole-cell recording pipette and fluorescence changes (ΔF/F, referred to as Ca signals) were recorded with a photodiode. In each cell, recordings were made first in the soma and then in a dendrite approximately two somatic diameters (40–50 μm) away from the soma.
As shown in Figure 3A (left), increases in the Ca signal associated with individual spontaneous action potentials were detected in the soma, indicative of temporal resolution of Ca increases on the timescale of spiking. A one-to-one correspondence was sometimes but not always evident in raw dendritic records. Spike-triggered averaging, however, revealed that action–potential-associated Ca increases were present and detectable in the dendrite, indicating that action potentials successfully invaded the proximal dendrite (Fig. 3A, right). The beginning of the rising phase of the averaged Ca signal occurred at the end of the fast repolarization of the spike, consistent with the idea that the Ca signal corresponded to a Ca tail current. Between action potentials, however, the Ca signal did not return to the reference level measured when cells were held silent at −80 mV with injected current. As a result, spontaneous firing (with no holding current) generated an average dendritic Ca signal of 32.1 ± 5.0% (N = 13) over the silent baseline level. The tonic Ca level associated with spontaneous firing likely overestimates the physiological value, since it reflects both the amount of Ca influx and the properties of the dye (discussed below). Nevertheless, measurement of the tonic Ca signal provides a convenient experimental estimate of the average Ca load during firing. Changes in Ca signals induced by application and relief of hyperpolarization are therefore given as ΔF/F values subtracted from or added to this tonic baseline (dotted line on all figures).

Action potentials and Ca signals in cerebellar nuclear neurons during IPSP trains or hyperpolarizing steps. A, Spontaneous action potentials (top left traces) and the corresponding Fluo-4-dependent Ca signals (bottom left traces) recorded from a cerebellar nuclear cell soma (top) and its dendrite (bottom). Right, Mean records of spontaneous action potentials and corresponding Ca signals from the records at left, averaged after aligning to the maximum dV/dt of each spike. B, Action potentials (top traces) and somatic Ca signals (bottom traces) in a single cerebellar nuclear cell, with a 500 ms, 100 Hz IPSP train or a 500 ms hyperpolarization to −80, −100, or −120 mV, as labeled. C, Mean Ca signals recorded from dendrites of cerebellar nuclear cells with trains of Purkinje IPSPs or hyperpolarizations to −80, −100, or −120 mV (N = 13). Standard errors in these and all other plots of mean Ca signals are indicated at four points during the records. D, Action potentials and dendritic Ca signals in a single cerebellar nuclear cell, as in B.
Next, we interrupted spontaneous firing either with a 500 ms, 100 Hz train of IPSPs or with 500 ms current injections to hyperpolarize the cell to −80, −100, or −120 mV. This duration was selected based on the data of Figure 1 to maximize the possible recovery of T-type currents. Representative voltage traces with either somatic (Fig. 3B) or dendritic (Fig. 3D) Fluo-4-dependent signals illustrate that Ca signals decreased during the IPSP train or the step hyperpolarization and increased as firing resumed. Similar behavior is seen in spontaneously firing Purkinje targets in the vestibular nuclei (Nelson et al., 2003). As summarized in Figure 3C, during 500 ms hyperpolarizing steps to −80, −100, and −120 mV, dendritic Ca signals decreased by 22.1 ± 3.4, 23.5 ± 3.8, and 22.7 ± 3.4% (N = 13), respectively. The similarity of these values suggests that the Ca decrease did not depend on the depth of the hyperpolarization but simply resulted from the loss of voltage-gated Ca influx associated with the interruption of firing. The IPSP trains silenced five cells and reduced but did not fully inhibit action–potential firing in eight cells and decreased the average dendritic Ca to a slightly lesser extent than did hyperpolarizing steps (by 16.9 ± 2.7%; N = 13). In all cases, the decrease in the Ca signal when firing was interrupted followed the same trajectory as the decrease that occurred after individual spontaneous action potentials (Fig. 3B).
After the offset of current injection, dendritic Ca levels increased as firing resumed, such that Ca signals measured 280–300 ms later exceeded the baseline level associated with spontaneous firing by 11.0 ± 3.1, 16.8 ± 5.9, and 20.2 ± 5.8% for steps to −80, −100, and −120 mV, respectively (N = 13). In contrast, after the IPSP train, dendritic Ca was restored only gradually to the levels preceding inhibition; 280–300 ms after the end of the train, the Ca signal had just reached the spontaneous level (0.3 ± 1.7% above baseline) (Fig. 3C). Thus, the relief of hyperpolarizations beyond ECl induces high-frequency firing but raises dendritic Ca levels above the tonically firing baseline level only slowly. Moreover, in the same cells, the termination of IPSPs does not produce a similar overshoot of dendritic Ca.
To assess the extent to which our measurements might have been influenced by the properties of the Ca indicator, we made recordings with the lower-affinity dye Fluo-5F (200 μm; Kd = 2.3 μm; Invitrogen). With this indicator, somatic Ca transients were again evident, and the mean tonic dendritic Ca signal during spontaneous firing was 18.7 ± 5.0% (N = 10) (Fig. 4A), just more than one-half the level observed with Fluo-4. During hyperpolarizations to −80, −100, and −120 mV, the Ca level dropped by 14.5 ± 3.7, 14.3 ± 3.6, or 14.7 ± 4.5% (N = 10). After relief of hyperpolarization, the corresponding increases over the spontaneous level were 4.0 ± 1.2, 10.7 ± 1.8, and 14.0 ± 2.2% (Fig. 4B). Thus, the changes in dendritic Ca levels were qualitatively similar to those measured with Fluo-4 but smaller. Although the physiological profile of Ca influx in the absence of indicator is almost certainly more local and phasic during spiking than we can resolve, these data support the idea that nuclear cells sustain a significant Ca load during spontaneous firing. The different estimates of Ca levels are predictable from differences in affinity of the two indicators and suggest that the postinhibitory Ca increases measured with Fluo-4 are likely to overestimate rather than underestimate the rebound Ca levels. With this caution in mind, subsequent experiments were done with Fluo-4, which provided a better signal-to-noise ratio in the dendrites.

Action potentials and Ca signals recorded with different indicators or different stimulus durations. A, Spontaneous action potentials (top traces) and the corresponding Fluo-5F-dependent Ca signals (bottom traces) recorded from a cerebellar nuclear cell soma (top) and its dendrite (bottom). B, Action potentials interrupted by a 500 ms hyperpolarization to −80, −100, or −120 mV recorded from the same cell as in A (top traces) and mean dendritic Ca signals (bottom traces) (N = 10). C, Action potentials and the corresponding mean Fluo-4-dependent dendritic signals evoked by a 200 Hz train of three IPSPs (top), a 100 Hz, 150 ms IPSP train (middle), or 150 ms hyperpolarizing current injections to voltages as labeled (bottom) (N = 8 all conditions).
Together, these imaging data supported the idea that 500 ms trains of IPSPs does not produce a large postinhibitory Ca signal. We noted, however, that the Ca signal continued to drop while firing was interrupted and reasoned that shorter periods of inhibition might indeed drive postinhibitory Ca levels above baseline. We therefore tested the effect of two other durations of inhibition. First, we mimicked synchronized complex spikes, by evoking a 200 Hz train of three IPSPs (Khaliq and Raman, 2005; Monsivais et al., 2005), at stimulus intensities 50–85% greater than those used in other experiments. This pattern of stimulation interrupted firing during the IPSPs, but the Ca signal barely changed (Fig. 4C); relative to baseline, it decreased by only −3.1 ± 0.8% and increased by 0.4 ± 0.6% 300 ms after inhibition (N = 8). Second, we applied 150 ms trains of IPSPs or hyperpolarizing steps, since this duration of hyperpolarization is effective at inducing plasticity (Pugh and Raman, 2008). This pattern of stimulation, however, produced results similar to those obtained with longer steps. While firing was interrupted, Ca levels dropped approximately equivalently during IPSPs (by −11.6 ± 3%) and hyperpolarizing steps (by −9.2 ± 1.2, −9.0 ± 1.8, and −9.2 ± 1.3% for −80, −100, and −120 mV; N = 8). Despite this small decrease, Ca levels measured 300 ms after synaptic inhibition did not exceed spontaneous values, remaining −0.1 ± 0.7% below baseline (Fig. 4C). In contrast, after hyperpolarizing steps, Ca levels surpassed baseline by 6.4 ± 2.3% (−80 mV), 12.2 ± 3.8% (−100 mV), and 13.4 ± 3.5% (−120 mV) (Fig. 4C).
Because LTP can be obtained with whole-cell recording, these data indicate that LTP induction is unlikely to require a postinhibitory rebound Ca signal. A separate question, however, is whether action–potential firing itself is sufficiently modified by whole-cell recording to reduce the postinhibitory Ca signal that would normally be induced by inhibition in more intact neurons. On the one hand, this possibility seems unlikely, since both spontaneous firing and rebound bursts that are evident with microelectrode recording (Jahnsen, 1986a; Llinás and Mühlethaler 1988; Aizenman and Linden, 1999) also persist with whole-cell recording (Raman et al., 2000; Czubayko et al., 2001; Telgkamp and Raman, 2002; Molineux et al., 2006). On the other hand, in nuclear neurons from juvenile rats, whole-cell dialysis has been reported to decrease the propensity for bursting in response to Ca channel blockade (Alviña and Khodakhah, 2008; but see also Results below). We therefore tested whether the Ca signals induced by inhibition were significantly affected by whole-cell dialysis by repeating the imaging experiments with the membrane permeant dye Fluo-4AM. Because cerebellar nuclear neurons incorporated the dye inefficiently when slices were incubated in the Fluo-4AM, individual neurons were loaded by direct puffing of Fluo-4AM onto the cell body. This method led to successful dye uptake into the somata (but not dendrites) in four cells; in one cell, we obtained a concurrent perforated-patch recording. Ca signals were then measured during 500 ms, 100 Hz trains of synaptic inhibition. Because a silent baseline could not be obtained in the absence of electrophysiological recording, the ΔF/F was calculated relative to the lowest Ca signal measured at the end of the inhibitory train. As shown in Figure 5A, the Ca signal dropped during inhibition and returned to baseline much like in the whole-cell experiments, such that the postinhibitory Ca signal was 94 ± 9% of the preinhibitory signal (N = 4). Although these recordings were restricted to somatic imaging, superimposing the mean somatic and dendritic Ca signals from whole-cell records illustrated that the relative Ca changes were indistinguishable in the soma and dendrite, suggesting that the different compartments regulate Ca in a similar manner, although they may do so by different mechanisms (Fig. 5B). Thus, although the results with Fluo-4AM are themselves complicated by the uncertainty of dye concentration in the soma and the absence of dendritic recordings, they provide further support for the notion that activation of Purkinje cells does not generally induce a large postinhibitory overshoot of Ca in cerebellar nuclear neurons.

Comparison of spiking and Ca changes with and without dialysis. A, Action potentials recorded in perforated-patch mode in one cell and mean Fluo-4AM-dependent somatic Ca signals evoked by a 100 Hz, 500 ms trains of IPSPs (N = 4). Note that the Ca change is calculated relative to the signal at the end of the inhibitory train, whereas in other plots, it is calculated relative to equilibrium nonspiking values. B, Comparison of mean Fluo-4-dependent Ca signals in somata and dendrites of cerebellar nuclear cells before, during, and after IPSP trains or hyperpolarizations to −80, −100, or −120 mV (N = 13). C, Mean firing rate measured over 300 ms after 500 ms IPSP trains versus the spontaneous firing rate before inhibition for whole-cell (•) and perforated-patch recordings (○). Gray triangles indicate mean ± SEM for each configuration. Dotted line is the unity line, and solid line is a linear fit to the pooled data, which gave a slope of 1.0 and y-intercept of 20 Hz (R2 = 0.82). D, The maximal change in Ca signal relative to the tonic level associated with spontaneous firing versus the change in firing rate relative to the spontaneous rate (N = 13). Gray circles indicate the one cell in which the change in Ca level after hyperpolarizations beyond −80 mV gave responses that were off-scale. Solid line is a linear fit to the pooled data set. See text for values.
Despite the lack of a large Ca signal, firing rates tended to be elevated above spontaneous rates for a few hundred milliseconds after periods of synaptic inhibition. To quantify this change, we plotted the mean firing rate measured for 300 ms after the 500 ms train of IPSPs against the spontaneous firing rate for cells recorded in both the whole-cell (N = 13) and perforated-patch (N = 16) mode (Fig. 5C). The data fell on the same straight line, and a linear fit to the pooled data set estimated a slope of 1.0 and y-intercept of 20 spikes/s (R2 = 0.82). Thus, 500 ms of synaptic inhibition increases spontaneous firing rates by ∼20 spikes/s for 300 ms, regardless of the initial spike rate. Moreover, this change is independent of whole-cell dialysis. Shorter periods of inhibition produced smaller changes in firing rate, consistent with the idea that postinhibitory increases in firing result from recovery or activation of voltage-gated ion channels. After the 150 ms train of IPSPs, firing rates increased by 12 ± 3 spikes/s (N = 8), whereas the brief burst of three IPSPs at 200 Hz had virtually no effect on firing rate, which changed by only −1 ± 2 spikes/s over 300 ms (N = 8).
Next, to test whether the amplitude of the dendritic Ca signal was related to the spike frequency after the hyperpolarization, we compared the changes in Ca signals and firing rates before and after the interruption of spontaneous spiking in cells studied with whole-cell recording. First, the mean firing rate in the 150 ms window immediately before hyperpolarization was subtracted from the mean firing rate in the 300 ms window immediately after the hyperpolarization to obtain the change in firing rate. Although spiking decelerated over the 300 ms posthyperpolarization period, the firing rate averaged over this period was always greater than the spontaneous rate: As indicated above, after Purkinje IPSPs, the firing rate increased by 19.7 ± 2.8 Hz, whereas after steps to −80, −100, or −120 mV, it increased by 37.0 ± 4.5, 54.8 ± 6.0, or 66.6 ± 5.6 Hz (N = 13). Next, for each cell, the change in ΔF/F, i.e., the difference between the mean Ca signal (averaged for 150 ms before the hyperpolarization) and the maximal Ca signal (averaged from 280 to 300 ms after the hyperpolarization) was plotted against the difference in firing rate (Fig. 5D). In 12 of 13 cells, the maximal increase in Ca signals after synaptic inhibition or hyperpolarization varied directly with the increase in firing frequency after the step (R2 = 0.63; p = 0.004). In the remaining cell, the changes in Ca signals were considerably greater after the two deepest hyperpolarizations, reaching 76% after −100 mV and 82% after −120 mV; after each step, the firing frequency changed by 75 Hz. In this cell, relief of hyperpolarizations to −100 mV reached an instantaneous firing frequency of 423 Hz, measured from the first interspike interval in the burst. Nevertheless, after IPSPs, the Ca change even in this cell was similar to that in other cells, in which instantaneous firing frequencies after steps to −100 mV ranged from 109 to 497 Hz (Fig. 5D, gray symbols). These data suggest that strong bursting sometimes, but not always, augments dendritic Ca signals. Normally, however, Ca influx associated with simple spiking makes the dominant contribution to the total dendritic Ca signal upon the relief of synaptic inhibition.
To examine the classes of Ca channels that might contribute to this Ca signal, we performed experiments on acutely isolated cells, which facilitate voltage clamp and permit pharmacological application of well-defined concentrations of drugs. These experiments were done at elevated temperatures (35°C) to facilitate comparison to the data from slices, as well as to maximize the possibility of resolving T-type currents (McDonough and Bean, 1998). Ca currents were evoked by step depolarizations from −90 mV. We classified a cell as having T-type current if it showed rapid inactivation of Ca current on the timescale of ms at −50 mV. Unlike measurements in slices, such a T-type current was evident in the total Ca current in only 7 of 57 cells (Fig. 6A, top). Because mibefradil is known to block T-type currents (McDonough and Bean, 1998), we tested whether this blocker (10 μm) might allow pharmacological isolation of an inactivating LVA current, even in cells without an obvious T-type component in the total Ca current. In 40 cells to which mibefradil was applied (either in the presence or absence of blockers of L-, N-, and P/Q-type currents; discussed below), 15 cells (37.5%) had a mibefradil-sensitive current that inactivated rapidly at −50 mV, consistent with block of T-type current (Fig. 6A, bottom left). Steps to −30 mV, however, revealed that the total mibefradil-sensitive current inactivated by only 56 ± 4%, with the inactivating component having an amplitude of −60 ± 10 pA. Moreover, in 25 of 40 cells (62.5%), the mibefradil-sensitive current had no detectable phase of inactivation (Fig. 6A, bottom right). In the absence of other blockers, the Ca current remaining after mibefradil application was fully blocked by 300 μm Cd2+ (N = 8) (Fig. 6B). Previous studies demonstrate that both high-voltage-activated (HVA) and LVA channels are resilient to the isolation procedure (Coulter et al., 1989; Regan, 1991; Mintz et al., 1992; McDonough et al., 1996; McDonough and Bean, 1998; Raman and Bean, 1999), so it is unlikely that T-type currents were selectively lost in this preparation. Instead, because dendritic length is reduced in isolated cells, the relatively low density of T-type currents is consistent with the preferential expression of T-type channels beyond the most proximal dendrites. The data also demonstrate that mibefradil is not a selective T-type Ca channel blocker in cerebellar nuclear cells, consistent with its reported efficacy at blocking currents through expressed R-type (α1E) channels (Bezprozvanny and Tsien, 1995).

Ca currents in acutely dissociated cerebellar nuclear neurons. A, Voltage protocol (top left) with the total and mibefradil-sensitive Ca current in two example neurons. Left, A neuron that has inactivating T-type-like Ca current, in which mibefradil blocked the inactivating current as well as part of the noninactivating current. Right, A neuron with no inactivating component, in which mibefradil blocked a noninactivating current. B, Mean current–voltage relations of Ca currents for total (N = 12), mibefradil-sensitive (N = 10), and Cd2+-sensitive (mibefradil-insensitive; N = 8) components. C, Left, Voltage protocol and Ca current evoked in blockers of different Ca channels. Each pair of overlaid traces is from a single cell before (black) and after (gray) application of 10 μm nimodipine (nim), ω-conotoxin MVIIC (ω-ctx-MVIIC), or mibefradil (mib). Right, Mean percentages of the total Ca current that are sensitive to each blocker.
Next, to provide a general pharmacological segregation of somatic Ca currents, with the goal of evaluating drugs for use in the slice, we sequentially and cumulatively applied Ca channel antagonists, including 10 μm nimodipine, 10 μm ω-conotoxin MVIIC, and 10 μm mibefradil, to block L-type, N- and P/Q- type, and T- and R-type channels, respectively. Representative Ca currents before and after drug application are shown in Figure 6C. Notably, after L-, N-, and P/Q- type Ca channels were blocked by nimodipine and ω-conotoxin MVIIC, mibefradil again blocked a large fraction of noninactivating Ca current, which we therefore loosely classed as a mibefradil-sensitive R-type current. After application of all three blockers, a substantial fraction of current remained (N = 8). The mean percentages of L-type, N- and P/Q-type, mibefradil-sensitive R- type (and T-type, if present), and blocker-resistant R-type currents were 20.2, 24.5, 23.0, and 32.3%, respectively (N = 8; all conditions) (Fig. 6C). Together, these data indicate that the somata of cerebellar nuclear cells express a variety of HVA Ca channels but relatively few T-type Ca channels.
Because Cd2+ is an effective blocker of HVA channels but blocks T-type channels only weakly (Fox et al., 1987; Molineux et al., 2008), we tested whether it could be used in slices to eliminate HVA current while preserving some fraction of T-type current. Cells were held at −60 mV, and T-type currents were evoked by a 500 ms hyperpolarization to −110 mV, followed by a step to −50 mV. HVA currents were evoked by a 500 ms step to −70 mV, followed by a step to −20 mV. After currents were recorded in control ACSF solution for 4–10 min, the extracellular solution was switched to one containing 100 μm Cd2+, and recordings were continued for 9 min. Although voltage-clamped Ca currents tended to run down even in control solutions, Cd2+ had a differential effect on the currents: the HVA current was rapidly and almost completely blocked, but even after 9 min in Cd2+, 50.6 ± 4.4% of the T-type current remained (N = 7) (Fig. 7A,B). Since there was no clear peak HVA current after Cd2+ application, we measured the HVA currents at the time of the peak current in control solutions, which suggested that 11.1 ± 4.5% of the current remained in Cd2+ (N = 6). This value is likely to be an overestimate, however, because the residual inward current was rapidly inactivating and was therefore likely to include the small fraction of Na current that was not blocked by QX-314, as well as the small amount of T-type current that recovered at −70 mV. Experimentally, therefore, 100 μm Cd2+ can be used in slices to block HVA Ca currents in nuclear cells by ∼90% or more while preserving approximately one-half the T-type current.

Blockade of Ca currents and Ca signals in cerebellar slices by Cd2+. A, Top, Voltage protocol (top panel) and T-type Ca currents (bottom panel) evoked by steps from −110 to −50 mV in voltage-clamped cerebellar nuclear cells in slices before (black) and after (gray) application of 100 μm Cd2+. Bottom, Time course of T-type current blockade by Cd2+ (N = 7). One hundred percent indicates the current amplitude just before Cd2+ was added to the bath. B, Same as A, except that HVA Ca currents were evoked by steps from −70 to −20 mV (N = 6). C, Voltage protocol (top) and corresponding Ca signals from a voltage-clamped cerebellar nuclear cell (middle), as well as the mean Ca signals recorded from seven cells (bottom) before (black) and after (gray) application of 100 μm Cd2+. D, Action potentials interrupted by a hyperpolarization to −80 mV from an example cell and mean dendritic Ca signals recorded with hyperpolarizations as labeled (N = 5) in absence (top panels) or presence (bottom panels) of 100 μm Cd2+.
We therefore used Cd2+ to test the relative role of HVA and T-type currents in generating dendritic Ca signals. First, we verified that activation of T-type channels generated dendritic Ca signals in the presence and absence of Cd2+. Cells were voltage-clamped at −60 mV, and T-type currents were evoked by a 500 ms hyperpolarization to −110 mV, followed by a step to −50 mV. As shown in Figure 7C, the Ca signal increased during the depolarizing step, confirming that T-type Ca signals were detectable in dendrites. When 100 μm Cd2+ was added to the bath, the posthyperpolarization Ca signal remained, consistent with the observation that a substantial proportion of T-type currents remained unblocked by Cd2+ (Fig. 7C). In contrast, under current clamp, addition of Cd2+ to the bath modified the posthyperpolarization spike rate and greatly changed the pattern of Ca signals associated with the interruption of spontaneous firing. Upon application of Cd2+, neurons decreased their firing rates and/or stopped firing (N = 5). To compensate for the slowed firing rate in Cd2+, tonic current injection was applied to restore firing. With hyperpolarizations to −80, −100, or −120 mV, the postinhibitory increase in firing rate was reduced to approximately one-half its control value, again consistent with a Cd2+-induced loss of depolarizing drive (control vs Cd2+: 53 ± 11 vs 21 ± 5, 75 ± 11 vs 38 ± 8, and 81 ± 11 vs 46 ± 7 spikes/s, respectively; N = 5). Notably, in Cd2+, the Ca signal did not decrease when spiking was interrupted and did not increase after the offset of steps to −80 mV (change in ΔF/F of 0.01 ± 1.2%). More extreme hyperpolarizations to −100 or −120 mV, however, indeed revealed a small Ca signal to be detected upon termination of the step, consistent with the persistence of T-type currents in Cd2+ (change in ΔF/F of 3.8 ± 2.8 and 5.2 ± 3.6%, respectively) (Fig. 7D). To test whether the method of application of Cd2+ influenced these results, we repeated the experiments by perfusing Cd2+ into the bath. This approach corroborated the results obtained by adding Cd2+ directly to the recording chamber: the T-type current remained at 64 ± 6% of control 10 min after perfusion of Cd2+ was initiated (N = 7). Nevertheless, the Ca decrease during hyperpolarization was abolished. No increase in the Ca signal was evident afterhyperpolarization to −80 mV (change in ΔF/F of 0.9 ± 0.4%), although the Ca signal increased slightly after stronger hyperpolarizations, to −100 or −120 mV (change in ΔF/F of 3.7 ± 1.0 and 4.6 ± 1.3%, respectively; N = 4; supplemental Fig. 1, available at www.jneurosci.org as supplemental material). Together, these data support the conclusion that most of the Ca signal that is generated by spontaneous activity results from Ca influx through HVA Ca channels. Moreover, these Cd2+-sensitive channels are likely to be responsible for nearly all the Ca signal recorded after synaptic inhibition.
As mentioned above, Alviña and Khodakhah (2008) reported that 100 μm Cd2+ applied to intact cerebellar nuclear neurons in juvenile rates induced bursting in 75% of cells while reducing firing rates or silencing the other 25%. In our recordings, regardless of the method of application of Cd2+, 100 μm Cd2+ did not induce bursting but tended to have the latter effect of slowing or stopping action potentials, even in perforated-patch mode or cell-attached mode (N = 7). These data suggest that Cd2+-induced bursting is sensitive to elements of recording conditions besides dialysis, such as the extracellular concentrations of Ca and K, which differ in the two studies.
Our experiments in isolated somata of cerebellar nuclear neurons indicated that individual cells varied in their relative expression of each type of HVA current but that each cell expressed at least four pharmacologically distinguishable components of Ca current, i.e., L-type, N- and/or P/Q-type, mibefradil-sensitive R-type, and mibefradil-insensitive R-type. To test whether any one of these channels played a preferential role in generating the Ca signals associated with spontaneous firing or the resumption of firing after hyperpolarizations, we repeated the concurrent measurements of action–potential firing and Ca imaging in different Ca channel antagonists. As before, current was injected to hyperpolarize cells to −80, −100, and −120 mV. IPSPs were not assessed in Ca channel antagonists because of possible blockade of presynaptic Ca current. We first measured the effects of the three drugs tested in isolated cells, namely nimodipine (10 μm), ω-conotoxin MVIIC (10 μm), and mibefradil (10 μm), to block L-type, N- and P/Q-type, and mibefradil-sensitive R- and T-type current, respectively. Because of the mixed effects of mibefradil, we also tested SNX-482 (500 nm) and NNC 55-0396 (10 μm; Li et al., 2005), which are expected to be relatively selective blockers of R-type and T-type channels, respectively. Only one drug was applied to each cell. Because firing rates changed upon application of the drugs, holding current was applied to maintain spontaneous firing close to rates before application of drugs (see Materials and Methods).
Example traces of action–potential firing and mean Ca signals across cells are shown in Figure 8A–E (left). Although the absolute Ca levels changed in the drug, traces are aligned to the baseline levels to illustrate similarities in the drop in Ca signals during hyperpolarization and differences in the increases in Ca signals after the end of the hyperpolarizing step. The change in Ca signal, Δ(ΔF/F), was plotted against the change in firing after the hyperpolarization (Fig. 8A–E, right). After firing was interrupted by the step to −80 mV, the change in spiking frequency relative to the prehyperpolarization rate was significantly reduced in both ω-conotoxin MVIIC and SNX-482 (p < 0.05, paired t test) but not in the other drugs (p > 0.25), suggesting that activation of N- and/or P/Q-type currents as well as R-type currents contribute to the restoration of firing. The change in Ca level was significantly reduced in ω-conotoxin MVIIC (p < 0.05), showed a trend toward a reduction in SNX-482, NNC 55-0396, and mibefradil (p < 0.09), and was unaffected by nimodipine (p > 0.25). The decrease in the Ca signal during hyperpolarization to −80 mV was slightly reduced in some of the drugs, consistent with a lower tonic Ca level in the presence of Ca channel blockers. We therefore measured the change in the Ca signal from the trough at the end of the hyperpolarizing step to the maximum after the step and compared these values in control and drugs. This analysis indicated that the increase in the Ca signal after relief of hyperpolarization was significantly decreased in ω-conotoxin MVIIC, SNX-482, and NNC 55-0396 (p ≤ 0.01) and nearly significantly decreased in mibefradil (p = 0.05), but was unaffected by nimodipine (p > 0.25). These data support the idea that N-type, P/Q-type, and R-type channels, but not L-type channels, contribute to the Ca increase after hyperpolarizations to voltages near ECl. In no case, however, did we observe a significant reduction in the Ca change without a concurrent decrease in the firing rate. This result suggests that the Ca channels that were blocked by each toxin normally accelerate firing after periods of hyperpolarization in addition to generating the intracellular Ca signal.

Effect of Ca channel blockers on Ca signals after hyperpolarizations. A–E, Left, Response of a cerebellar nuclear cell to a 500 ms hyperpolarization to −80 mV before (top) and after (middle) application of a Ca channel blocker and corresponding mean dendritic Ca signals (bottom) in the absence (black) and presence (gray) of the blocker. Right, Changes in the Ca signal after the hyperpolarization relative to the tonic level associated with spontaneous firing versus changes in the firing rate. A, Nimodipine (10 μm) (N = 6). B, ω-Conotoxin MVIIC (10 μm) (N = 6). C, Mibefradil (10 μm) (N = 6). D, SNX-482 (500 nm) (N = 7). E, NNC 55-0396 (10 μm) (N = 7).
Discussion
Together, these data indicate that the primary effect of Purkinje cell-mediated synaptic inhibition on dendritic Ca in cerebellar nuclear cells is to make Ca levels fall below the tonic level associated with spontaneous firing. During synaptic inhibition, the membrane potential approaches the ECl of −75 mV. Because T-type channels recover very little in this voltage range, relief of inhibition does not evoke a T-type-dependent rebound increase in intracellular Ca. Instead, spiking resumes, exceeding the spontaneous rate for a few hundred milliseconds. The action potentials activate HVA channels, which gradually restore Ca to a level that varies with the firing rate.
These results address three questions that arise from the well-known ability of cerebellar nuclear neurons to generate rebound bursts of action potentials in vitro upon relief of strong hyperpolarizations (Llinás and Mühlethaler, 1988; Aizenman and Linden, 1999; Czubayko et al., 2001): do rebound bursts occur after synaptic inhibition as they do after current injections? Are the ionic mechanisms of posthyperpolarization bursts and postinhibitory acceleration of firing necessarily the same? Does disinhibition generate large intracellular Ca signals that regulate plasticity?
Ca signals and rebound bursting
Recent work has distinguished a subset of large nuclear cells as strong or “transient bursters,” which generate two to six high-frequency (∼150–200 Hz), posthyperpolarization action potentials superimposed on a depolarization (Molineux et al., 2006). These cells, which express CaV3.1 and T-type currents of 0.5–1 nA, differ from large “weak burster” neurons, which have CaV3.3 channels and smaller T-type currents (<200 pA; Molineux et al., 2006, 2008). In our study, posthyperpolarization firing rates and T-type current amplitudes (measured after steps to −90 mV) were comparable to those of transient bursters. In all cells, however, current–clamp, imaging, and pharmacological data indicated that trains of IPSPs increased postinhibitory firing rates without activating T-type currents, eliciting bursts, or generating an overshoot in dendritic Ca, even when strong hyperpolarizations evoked disproportionately large Ca transients. In this regard, cerebellar nuclear neurons are distinct from thalamic reticular neurons, in which dendritic Ca signals are clearly dominated by T-type Ca currents (Cueni et al., 2008).
In many respects, our results are consistent with recent work by Alviña et al. (2008), which demonstrated that transient bursts are not evident after synaptic inhibition in nuclear cells either in cerebellar slices (with extracellular or whole-cell recordings; ECl = −71 mV) or in anesthetized rats in vivo after Purkinje cell stimulation. Unlike in that study, however, in our recordings, neurons always resumed firing within tens of milliseconds after 500 ms IPSP trains were terminated and continued to fire ∼20 spikes/s above the spontaneous rate for at least 300 ms. During this period of accelerated firing, dendritic Ca signals grew from the reduced value associated with the suppression of firing to the tonic value associated with spontaneous firing. The rapid restoration of firing upon disinhibition is consistent with dynamic clamp studies (Gauck and Jaeger, 2000, 2003) and with the short (5 ms) decay time constant of Purkinje-mediated IPSCs (Telgkamp and Raman, 2002).
The increase in firing rate after inhibition suggests that currents other than T-type current change their availability even during moderate hyperpolarization. Consistent with this idea, we find that blocking HVA channels generates a smaller increase in firing rate after hyperpolarizations to −80 mV, suggesting that recovered HVA channels contribute an extra depolarizing drive upon synaptic disinhibition. Moreover, Na currents of nuclear cells inactivate during spike-like depolarizations but partially recover during hyperpolarizations to −70 mV (Aman and Raman, 2007). It is also possible that the drop in Ca influx during the suppression of firing decreases tonically activated SK current, whose blockade can facilitate bursting (Aizenman and Linden, 1999; Alviña and Khodakhah, 2008). Such changes in availability of intrinsic currents suggest a mechanism by which nuclear cells may apparently burst following inhibition, even if T-type currents are not recruited. In vivo, nuclear neurons receive thousands of spontaneous IPSPs per second from dozens of afferent Purkinje neurons (Chan-Palay, 1977; Palkovits et al., 1977). They are therefore probably more leaky than in slices, in which cutting of Purkinje axons reduces basal inhibition. Consequently, the ion channels recruited (or suppressed) during synchronized inhibition may be less effective in vivo at eliciting a prolonged period of accelerated firing upon disinhibition. Instead, the postinhibitory depolarization that they produce may simply generate a cluster of action potentials, which appear as a burst of activity. Such postinhibitory firing might restore Ca levels of nuclear cell dendrites via the activation of HVA currents and/or constitute an electrical signal to be detected downstream.
T-type and HVA Ca current
Recent work has linked T-type currents to rebound firing based on blockade of bursts by mibefradil and its derivative NNC 55-0396 (Alviña et al., 2009). Even after steps to only −80 mV, however, we find that both drugs reduce posthyperpolarization spike rates and the concomitant Ca influx. Recordings in isolated cells demonstrate that mibefradil targets multiple Ca channels in cerebellar nuclear cells: in addition to T-type currents, it blocks a large, noninactivating, nimodipine-insensitive and ω-conotoxin MVIIC-insensitive, R-type-like Ca current. Mibefradil-induced reductions in firing and Ca signals, therefore, cannot be attributed exclusively to blockade of T-type current. Although NNC 55-0396 is considered more selective because it spares L-type channels (Li et al., 2005), its effects were indistinguishable from those of mibefradil, raising a question about its specificity. Interestingly, Alviña et al. (2009) noted that mibefradil blocked a long-lasting persistent firing of nuclear cells; our data suggest that such firing may depend on the mibefradil-sensitive R-type current recorded in isolated somata. Consistent with a role for R-type current in mediating Ca entry, SNX-482 was especially effective at reducing both the Ca signal and the firing rate, particularly after steps to −80 mV. Blocking N-type and P/Q-type channels with ω-conotoxin MVIIC had qualitatively similar effects.
Although selective drugs against T-type channels are still lacking, Cd2+ at 50 μm does not block T-type currents associated with bursting in rat nuclear neurons (Molineux et al., 2008). Similarly, 100 μm Cd2+ spares one-half the T-type current in mouse neurons but abolishes changes in Ca signals during spontaneous firing and after hyperpolarizations to voltages near ECl, again supporting the notion that HVA channels dominate Ca entry after inhibition.
Even if T-type currents are not readily engaged by fast synaptic inhibition, it seems likely that they are activated under certain physiological conditions, given that nuclear neurons express them at high densities and target them to dendrites (Muri and Knöpfel, 1994; Gauck et al., 2001; Molineux et al., 2006). Because of the negative voltages and long times required for recovery of T-type currents, our data suggest that hyperpolarization by K currents may be necessary to recruit these channels; for example, K conductances may activate exclusively in the dendrites, perhaps by a stimulation of GABAB receptors or SK channels that is not mimicked in slices. Although ECl can shifts negatively with age, it is similar in nuclear neurons of 2-week-old mice and ∼2-month-old guinea pigs (Jahnsen, 1986b), suggesting that simple maturation does not significantly hyperpolarize ECl. Nevertheless, specific patterns of stimuli may shift ECl negatively (Woodin et al., 2003) or may modulate T-type channels so that they recover at less hyperpolarized potentials.
Relevance to synaptic plasticity
These results provide insight into the mechanisms underlying LTP of mossy-fiber EPSCs. Our previous work indicated that LTP induction consists of two steps: a synaptic NMDA-receptor-dependent signal that primes activated synapses for potentiation, followed by an intrinsic Ca-channel-dependent signal that triggers potentiation of primed synapses (Pugh and Raman, 2008). Regarding the triggering signal, EPSCs can be potentiated even in neurons voltage-clamped to negative potentials, as long as induction protocols include synaptic excitation, followed by a small voltage step that activates T-type currents; thus, LVA-mediated Ca influx is sufficient to trigger plasticity in the absence of background spiking (Pugh and Raman, 2006). Potentiation can also be induced with more physiological stimuli, however, e.g., in spontaneously firing cells by excitation followed by trains of IPSPs (Pugh and Raman, 2008). Here, we find that the latter, more realistic pattern of inhibition not only fails to activate much T-type current but does not generate a large postinhibitory overshoot of dendritic Ca, suggesting that the relevant triggering signal may be the decrement and restoration of intracellular Ca associated with action–potential interruption and resumption.
During spiking, however, Ca influx does not depend preferentially on any specific HVA channel: nuclear cells express multiple HVA currents, including L-type, N-type and/or P/Q-type, and possibly more than one class of R-type current; with the exception of L-type, all contribute approximately equivalently to the dendritic Ca influx during spiking. Thus, one possibility is that the basal influx of dendritic Ca, which is maintained by ongoing firing, supports tonically active Ca-dependent enzymes (or other factors) (Nelson et al., 2003). If these factors have different sensitivities to Ca, then the drop in Ca during inhibition may differentially modulate their activities. The restoration of Ca upon disinhibition may then shift the balance among these elements in a manner that favors triggering of plasticity.
Footnotes
-
This work was supported by National Institutes of Health Grant NS39395 (I. M. R.). We are grateful to Jason Pugh, Abigail Person, Teresa Aman, Jason Bant, and Mark Benton for helpful discussions and Dr. Chinfei Chen for comments on an early version of this manuscript.
- Correspondence should be addressed to Dr. Indira M. Raman, Department of Neurobiology and Physiology, 2205 Tech Drive, Northwestern University, Evanston, IL 60208. i-raman{at}northwestern.edu


