

Article Figures & Data
Figures
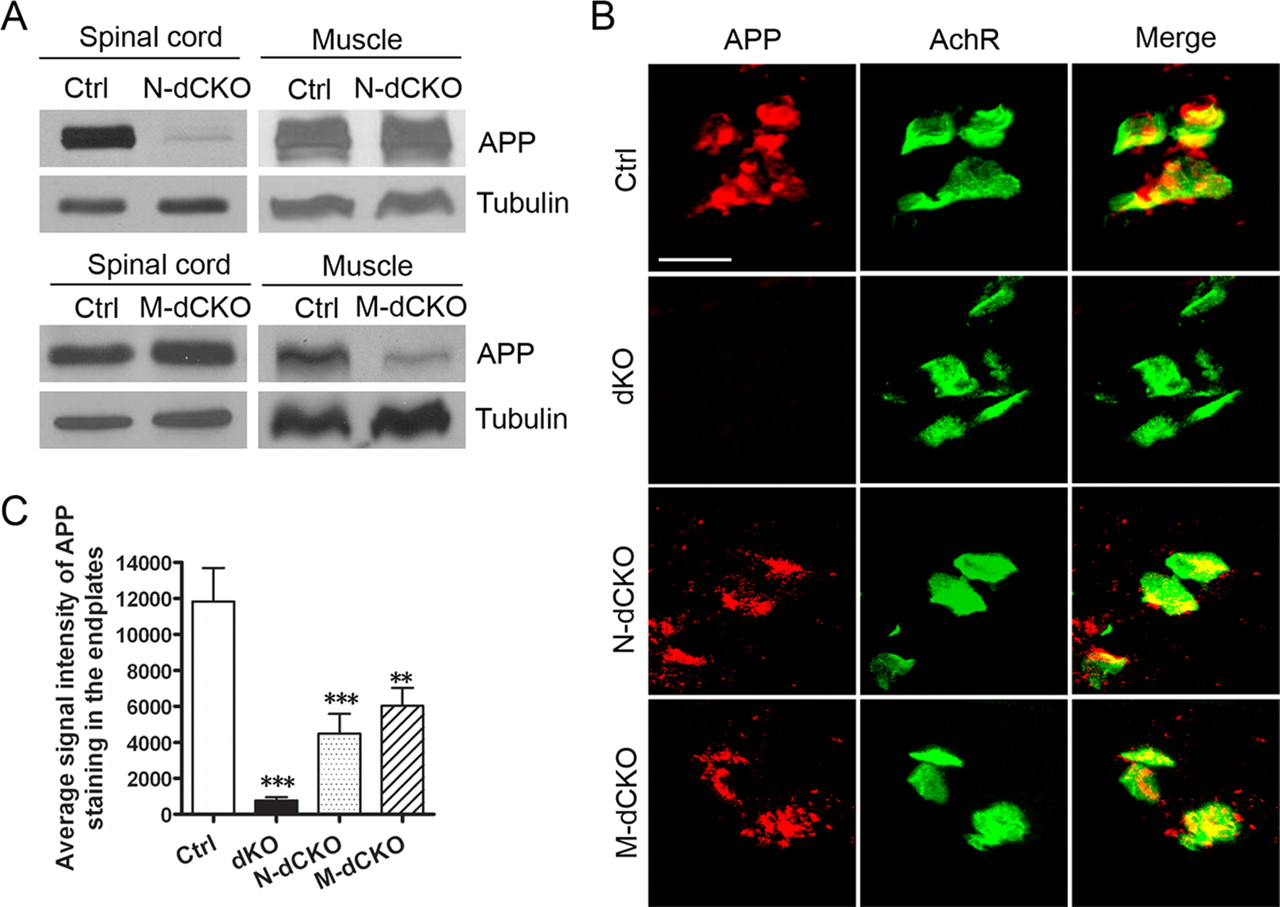
- Figure 1.
Biochemical and immunohistochemical characterization of APP expression and localization. A , Western blot analysis of APP protein levels from P0 spinal cord or muscle samples of APLP2-null control (Ctrl), neuronal or muscle conditional APP knock-out on APLP2-null background (N-dCKO and M-dCKO, respectively) using the APPc antibody. Tubulin was used as a loading control. B , Immunofluorescence staining of P0 stenomastoid muscle sections of control (Ctrl), APP/APLP2 double knock-out (dKO), N-dCKO, or M-dCKO animals using the anti-APP antibody Y188. α-BTX staining was used to mark the postsynaptic AchRs. Merge, Overlay of APP and AchR images. Scale bar, 20 μm. C , Quantification of APP signal intensity (mean ± SEM) (2 animals/genotype; 6 sections/animal) in AchR-positive endplates. **p < 0.01, ***p < 0.001 compared with control (one-way ANOVA).
- Figure 2.
Neuromuscular synapse defects in APP/APLP2 motor neuron (N-dCKO) and muscle (M-dCKO) knock-out mice. A , Whole-mount immunostaining of control, dKO, N-dCKO, or M-dCKO P0 diaphragm muscles with antibodies against Syn or NF. α-BTX staining was used to mark the AchRs. Both the germline and conditional mutants showed diffused presynaptic and postsynaptic distribution and nerve terminal sprouting. B , Quantification of the average band width of AchR-positive endplates. C , Quantification of the number of AchR-positive endplates outside the central 200 μm band zone. D , Measurement of the number of endplate per unit area. B–D are expressed as mean ± SEM (6 animals/genotype). E , Higher magnification images of synapse structures with representative endplates poorly covered by Syn marked by arrowheads and extrasynaptic Syn staining by arrows. F , Quantification of the percentage of AchR-positive endplates covered by Syn (average ± SEM of 20 endplates/genotype). The asterisks above each bar are in comparison with the control. The asterisks on top of the brackets are in comparison with the dKO mice. *p < 0.05; **p < 0.01; ***p < 0.001; NS, nonsignificant (p > 0.05) (one-way ANOVA). Scale bars: A , 100 μm; E , 20 μm.
- Figure 3.
Aberrant CHT localization in presynaptic terminals of APP mutant NMJ. A , Whole-mount diaphragm muscles from P0 control (Ctrl), dKO, N-dCKO, or M-dCKO animals were stained with anti-CHT antibody or α-BTX (AchR). The images were captured by confocal microscopy and displayed either as individual staining or merged (last row). Representative endplates with poor CHT coverage were marked by arrowheads and extrasynaptic CHT staining by arrows. Scale bar, 20 μm. B , Quantification of the percentage of AchR-positive endplates covered by CHT (average ± SEM of 20 endplates/genotype). The asterisks above each bar are in comparison with the control. The asterisks on top of the brackets are in comparison with the dKO mice. *p < 0.05; **p < 0.01; NS, nonsignificant (p > 0.05) (one-way ANOVA). C , RT-PCR analysis of APP, APLP1, and APLP2 expression in P0 brain, spinal cord, and muscle samples. RT, With reverse transcriptase; NR, the same sample and reaction in the absence of reverse transcriptase. GAPDH was used as amplification control.
- Figure 4.
Miniature synaptic responses in NMJ of Ctrl, N-dCKO, and M-dCKO mice. A , Representative traces of mEPPs. Calibration: 1 mV, 0.5 s. B , Pooled data indicate significant reductions in the frequency of mEPPs in N-dCKO (N = 14) and M-dCKO (N = 31) NMJs compared with controls (N = 31). C , mEPP amplitude showed no significant differences among three groups tested. Data are presented as mean ± SEM. *p < 0.05; **p < 0.01 (one-way ANOVA).
- Figure 5.
Expression analysis of APP and characterization of APP/APLP2 conditional mutant during embryonic development. A , Double labeling of E16.5 diaphragm muscles with the anti-APP antibody Y188 (APP) and α-BTX (AchR). Merge, Overlay of APP and AchR images. Scale bar, 20 μm. B , Staining of E16.5 whole-mount diaphragm muscles of control, dKO, N-dCKO, and M-dCKO embryos with anti-synaptophysin antibody (Syn), α-BTX (AchR), or anti-neurofilament antibody (NF). Scale bar, 100 μm. C , Quantification of the average endplate band width. D , Quantification of the number of endplate per unit area. All are expressed as mean ± SEM (N = 5 animals/genotype). The asterisks above each bar are in comparison with the control. The asterisks on top of the brackets are in comparison with the dKO mice. *p < 0.05; **p < 0.01; ***p < 0.001; NS, nonsignificant (p > 0.05) (one-way ANOVA). E , A transsynaptic APP interaction model and explanation for the quantitative differences between dKO, N-dCKO, and M-dCKO mutants based on the model. Filled bar, APP; open bar, APLP1.
- Figure 6.
Mixed-culture analysis of APP synaptogenic activity. A , Representative images of HEK293 cells transfected with GFP (GFP), neuroligin/GFP (NL), or APP/GFP (APP) (each at 10:1 construct/GFP molar ratio), cocultured with wild-type hippocampal neurons, and stained with anti-synaptophysin (Syn) and anti-MAP2 (Map2) antibodies. Syn-positive, but Map2-negative puncta could be seen atop of NL and APP transfected HEK293 cells (marked in green), but not GFP vector control. The images are displayed either individually or merged (last column, GFP, green; Syn, red; Map2, blue). Scale bar, 20 μm. B , Quantification of the average area of HEK293 cells covered by synaptophysin immunoreactivity. Error bars indicate SEM. C , Quantification of average number of Syn-positive puncta per transfected HEK293 cell. **p < 0.01; ***p < 0.001 (t test). D , Double immunostaining of APP transfected HEK293/hippocampal cocultures with anti-APP and anti-SV2 antibodies. The images are displayed either individually or merged (SV2, red; APP, green). Selected SV2 and APP double-positive punctas are marked by arrowheads. Scale bar, 20 μm. E , Introduction of a Flag-tagged APP in neurons and coculture with APP-expressing HEK293 cells (APP/GFP). APP-expressing axon is marked by arrow. SV2, Immunostaining with the anti-SV2 antibody to identify the synaptic puncta atop HEK293 cells; Flag, immunostaining with the anti-Flag antibody to recognize neuronal expressed APP. SV2- and Flag-positive punctas are highlighted by arrowheads. Merge, Overlap of the three panels (293 cells, green; SV2, red; Flag, blue with overlap of the three in white). F , Schematic diagram of the APP constructs. Shaded rectangle at the N terminus of each construct represents the APP signal peptide; E1 and E2, the E1 (amino acids 22-189) and E2 (amino acids 289–500) domains of the APP extracellular sequences; shaded square, APP transmembrane domain; shaded oval, GPI anchor. G , Western blot analysis of APP expression in transfected HEK293 cells using the 22C11 and APPc antibodies, which recognize residues within the E1 domain and the C-terminal end of APP respectively. Tubulin was used as a loading control. H , Cell surface APP expression assayed by biotinylation experiment. I , J , Quantification of the average area of HEK293 cells covered by synaptophysin immunoreactivity ( I ) and the average number of Syn-positive puncta per transfected HEK293 cell ( J ) induced by APP and its derivatives. The asterisks above each bar are in comparison with the full-length APP. The asterisks on top of the brackets are comparison between the specific pair. *p < 0.05; **p < 0.01; ***p < 0.001 (t test).
- Figure 7.
Effect of neuronal APP on APP-induced synaptic puncta. The APP/APLP2-null neurons (dKO) and littermate APLP2-null controls (Ctrl) were cocultured with GFP, NL, or APP transfected HEK293 cells. dKO + APP, dKO neurons infected with APP-expressing lentivirus. The average area of transfect HEK293 cells covered by synaptophysin ( A ) and the average number of synaptic puncta per HEK293 cell ( B ) were quantified. APP-induced puncta is significantly reduced when cocultured with dKO neurons (Ctrl vs dKO, p < 0.001) (t test). This impairment is completely rescued by neuronal expression of APP (Ctrl vs dKO + APP, nonsignificant, p > 0.05). Error bars indicate SEM. C , Representative images of control (Ctrl), APP/APLP2 double knock-out (dKO), or dKO with lentiviral expression of GFP vector (dKO + GFP), human full-length APP (dKO + APP), intracellular domain deleted APP (dKO + APPΔC), extracellular sequence deleted APP (dKO + APPc99), or the APP/SynCAM chimera (dKO + SynCAM) cocultured with APP-transfected HEK293 cells. The cultures were stained with anti-synaptophysin (Syn; red) and anti-MAP2 (Map2; blue) antibodies. Both the transfected HEK293 cells and APP infected axons (arrows) are GFP-positive. Scale bar, 20 μm. D , Schematic diagram of the APP constructs. Black rectangle, SynCAM C-terminal sequences (amino acids 428-474). E , Western blot analysis of neuronal lysates from APLP2−/− control, dKO, and dKO neurons infected with APP and derivatives using the N-terminal and C-terminal antibodies 22C11 and APPc, respectively. Tubulin was used as a loading control. F , Quantification of the average area of HEK293 cells covered by synaptophysin immunoreactivity. G , Quantification of average number of Syn-positive puncta per transfected HEK293 cell. **p < 0.01 (t test) in comparison with the dKO + GFP control.
- Figure 8.
Visualization of APP-associated protein complexes by BiFC analysis. A , Western blotting of HEK293 cells transfected with DNA constructs encoding APP, Mint1, or Cask proteins fused to complementary fluorescent protein fragments (nYFP or cYFP). Total protein lysates were blotted with the APPc antibody ( a ), anti-Mint1 ( b ), and anti-Cask ( c ) antibodies. B , HEK293 cells were cotransfected with the BiFC constructs indicated above the images. BiFC complexes were imaged 24 h after transfection. Scale bars, 10 μm.


Additional Files
Supplemental Data
Files in this Data Supplement:
- supplemental material - Supplemental Material


