

Article Figures & Data
Figures
- Figure 1.
Peripheral LPS administration causes sustained NOS2 expression in the brain of C57BL/6 mice. A, LPS treatment schedule including the time points for the different analyses. OF, Open field; RAM, radial arm maze. B, Western blot detection of NOS2 in the hippocampus (HC) and frontal cortex (FC) over the experimental period of 8 weeks. C, Comparison of NOS2 expression in LPS and vehicle (PBS)-injected mice at 1 and 8 weeks from whole-brain lysates. Densitometrical quantification verified a significant and sustained LPS effect on NOS2. Each lane represents a single animal (mean ± SEM, n = 6, student's t test, *p < 0.05; **p < 0.01). D, DAB immunostaining against NOS2 in an LPS-treated mouse (top). Scale bar, 50 μm. Representative confocal immunostaining of NOS2 and CD11b revealing colocalization (bottom). Scale bar, 10 μm.
- Figure 2.
LPS-induced long-term memory impairment. Radial arm maze test: wild-type mice (wt) challenged with LPS (wt+LPS) needed more trials and committed more errors during the test compared to NOS2−/− (NOS2−/− +LPS). A, Total trials (mean ± SEM, n = 10–12, ANOVA, F = 5.73, Tukey post hoc analysis, *p < 0.05; ***p < 0.001 wt+LPS vs wt, NOS2−/−, NOS2−/− +LPS). B, Working memory errors (mean ± SEM, n = 10–12, ANOVA, F = 3.56, Tukey post hoc analysis, *p < 0.05 wt+LPS vs wt, NOS2−/−, NOS2−/− +LPS). C, Reference memory errors (mean ± SEM, n = 10–12, ANOVA, F = 10.80, Tukey post hoc analysis, ***p < 0.001 wt+LPS vs wt, NOS2−/−, NOS2−/− +LPS).
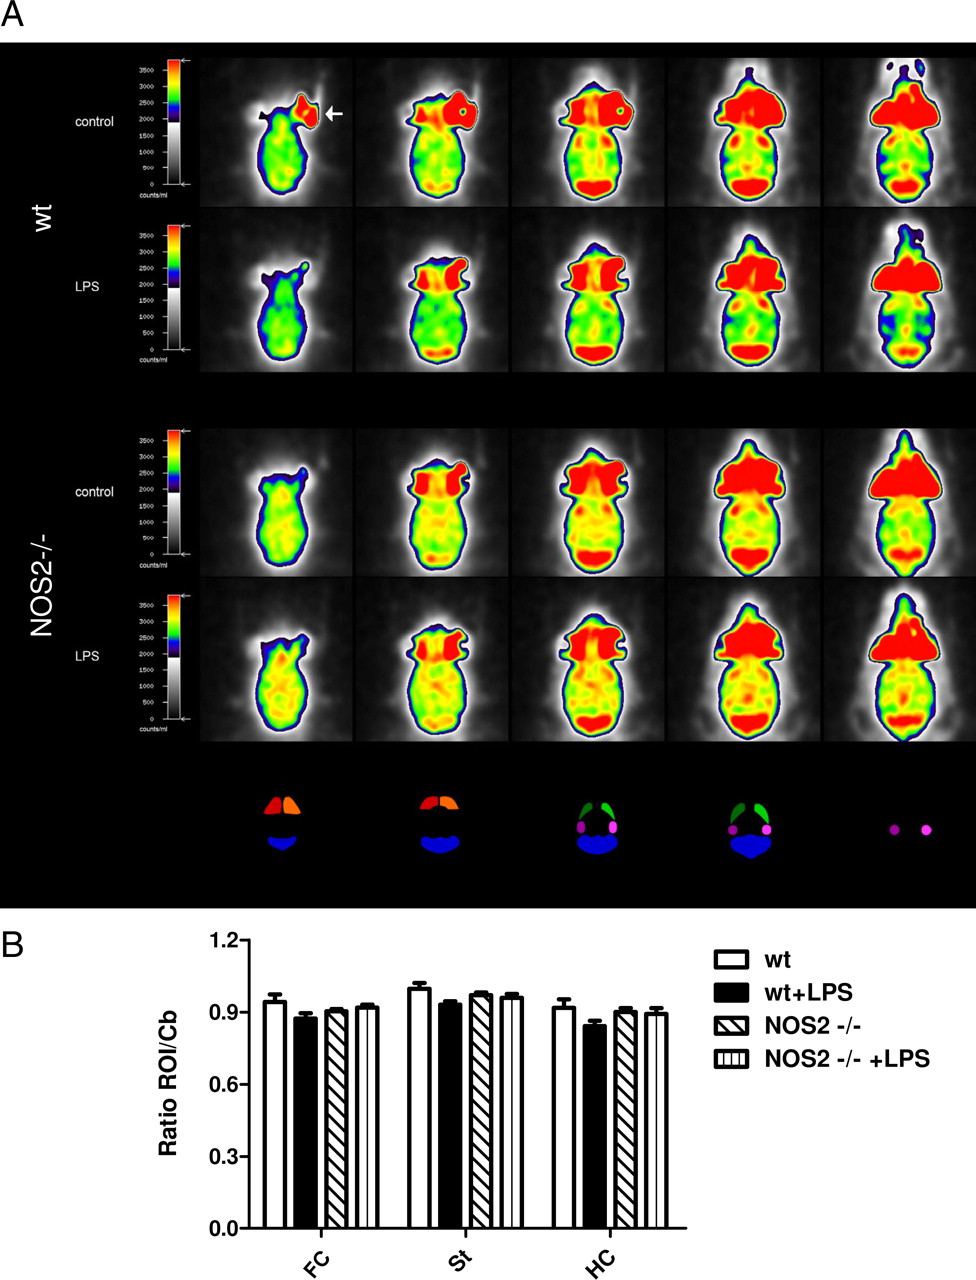
- Figure 3.
Analysis of cerebral glucose uptake 2 months after sepsis. A, Shown are five representative transversal 18F-FDG–PET brain slices of wild-type and NOS2−/− mice treated with vehicle or LPS. Corresponding region-of-interest (ROI) masks are displayed below. B, Quantification of 18F-FDG uptake (relative to the cerebellum) did not reveal any significant differences between groups in all brain areas examined including the frontal cortex (FC), the striatum (St), and hippocampus (HC). The arrow exemplarily indicates noncerebral uptake of 18F-FDG in retro-orbital Harderian glands routinely seen with all PET studies (mean ± SEM, n = 5).
- Figure 4.
LPS induced a sustained activation of microglia and inflammatory gene transcription 2 months after sepsis. A, CD11b immunohistochemistry demonstrates sustained and focal microglial activation in the frontal cortex in response to LPS administration (mean ± SEM, n = 10, ANOVA, F = 8.71, Tukey post hoc analysis, *p < 0.05). B, Quantification of NeuN and GFAP immunostaining 2 months after sepsis (mean ± SEM, n = 10, ANOVA, F = 2.98 for GFAP and F = 1.3 for NeuN). C, RT-PCR analysis of TNFα and Il-1β transcripts in wild-type (wt) and NOS2−/− mice in the frontal cortex (FC), hippocampus (HC), and the cerebellum (Cb) (mean ± SEM, n = 5, ANOVA, F = 16.13 for FC, F = 3.67 for HC and F = 6.62 for CB, Tukey post hoc analysis, *p < 0.01 wt or NOS2−/− vs wt+LPS, ##p < 0.01 NOS2−/− vs NOS2−/− + LPS). D, RT-PCR analysis of Il-1β transcripts in wt and NOS2−/− mice in the FC, HC, and the Cb (mean ± SEM, n = 5, ANOVA, F = 7.36 for FC, F = 1.72 for HC and F = 0.43 for CB, Tukey post hoc analysis, *p < 0.01 wt or NOS2−/− vs wt+LPS, ##p < 0.01 NOS2−/− vs NOS2−/− + LPS).
- Figure 5.
Alterations of synaptic key proteins in wild-type and NOS2−/− mice at 2 months after sepsis. A, Synaptosomal preparations from the whole-brain hemispheres if individual mice were separated by SDS gel electrophoresis and immunoblotted for the synaptic proteins synaptotagmin, synaptobrevin, munc-18, PSD-95, synaptophysin and CaMKII. B, Densitometrical analysis of the immunoblots from A (n = 4, mean ± SEM, ANOVA, F = 19.06 for synaptotagmin, F = 10.77 for synaptobrevin, F = 10.5 for munc18, F = 119.0 for PSD-95, F = 12.14 for synaptophysin, F = 18.68 for CaMKII, Tukey post hoc analysis *p < 0.05, **p < 0.01, ***p < 0.001).


Additional Files
Supplemental Data
Files in this Data Supplement:
- supplemental material - Supplemental Material


