

Article Figures & Data
Figures
- Figure 1.
Patients' antibodies reduce surface NMDA receptor clusters and protein in a titer-dependent fashion. a , Hippocampal neurons immunostained for surface and total NMDAR clusters and presynaptic Bassoon. Surface NMDARs are defined as the colocalization between nonpermeabilized patient CSF staining (extracellular NR1 epitope) and commercial NMDAR staining (intracellular epitope; left). Patient CSF treatment for 1 d reduces surface and total NMDAR cluster density without affecting Bassoon cluster density. Scale bar, 10 μm. b , Western blot analyses of surface biotinylated and total lysate NMDAR protein. Patient IgG treatment for 1 d reduces surface as well as total NMDAR protein; GABAAα1 and actin are loading controls. Control NR1 levels have been overexposed in this image to visualize patient treated NR1 bands. c , Surface (left) and total (right) NMDAR cluster density after treatment with CSF from several patients with different antibody titer, showing a titer-dependent decrease in NMDA cluster density (linear regression analysis; surface R 2 = 0.59, p < 0.001; total R 2 = 0.44, p < 0.008). All values are mean ± SEM (n = 18 cells, 3 independent experiments; 12 patient, 2 control samples) (supplemental Table 1, available at www.jneurosci.org as supplemental material). d , Surface (left) and total (right) NMDAR protein after treatment with IgG from several patients with different antibody titer (n = 3–5 Western blots; 10 patient, 2 control samples), showing a titer-dependent decrease in NMDA protein (linear regression analysis; surface R 2 = 0.53, p < 0.0001; lysate R 2 = 0.30, p < 0.002). e , Surface (left) and total (right) NMDAR cluster density after treatment with CSF from the same patient at two time points with different antibody titer; a higher antibody titer decreases surface and total NMDAR clusters to a greater extent. Asterisk indicates significant difference (n = 18 cells, 3 independent experiments; 2 samples from 2 patients; Student's t test, p < 0.02). f , Surface (left) and total (right) NMDAR protein after treatment with IgG from two patients at two time points with different antibody titer; a higher antibody titer decreased surface and total NMDAR protein to a greater extent than IgG isolated from the same patient when a lower antibody titer was present. Asterisk indicates significant difference (n = 3, Western blots; 2 samples from 2 patients; Student's t test p < 0.05).
- Figure 2.
Patients' antibodies reversibly reduce synaptic NMDA receptor clusters without affecting the number of synapses. a , Hippocampal neurons immunostained for total NMDAR clusters, a presynaptic glutamatergic terminal protein, VGlut, and a postsynaptic protein localized to glutamatergic synapses, PSD-95. Treatment with patient CSF for 3 d reduces the density of synaptic NMDAR clusters without affecting the number of excitatory synapses. After removal of patient CSF, the proportion of NMDAR clusters localized to synapses returns to baseline. Scale bar, 5 μm. b , Colocalization of presynaptic and postsynaptic proteins at excitatory synapses (n = 36 cells, 3 independent experiments; 2 patient, 1 control samples). c , NMDAR cluster density at excitatory synapses (synaptic NR1). The asterisk indicates significant difference (one-way ANOVA test followed by Bonferroni's multiple comparison test, p < 0.001). Error bars indicate SEM.
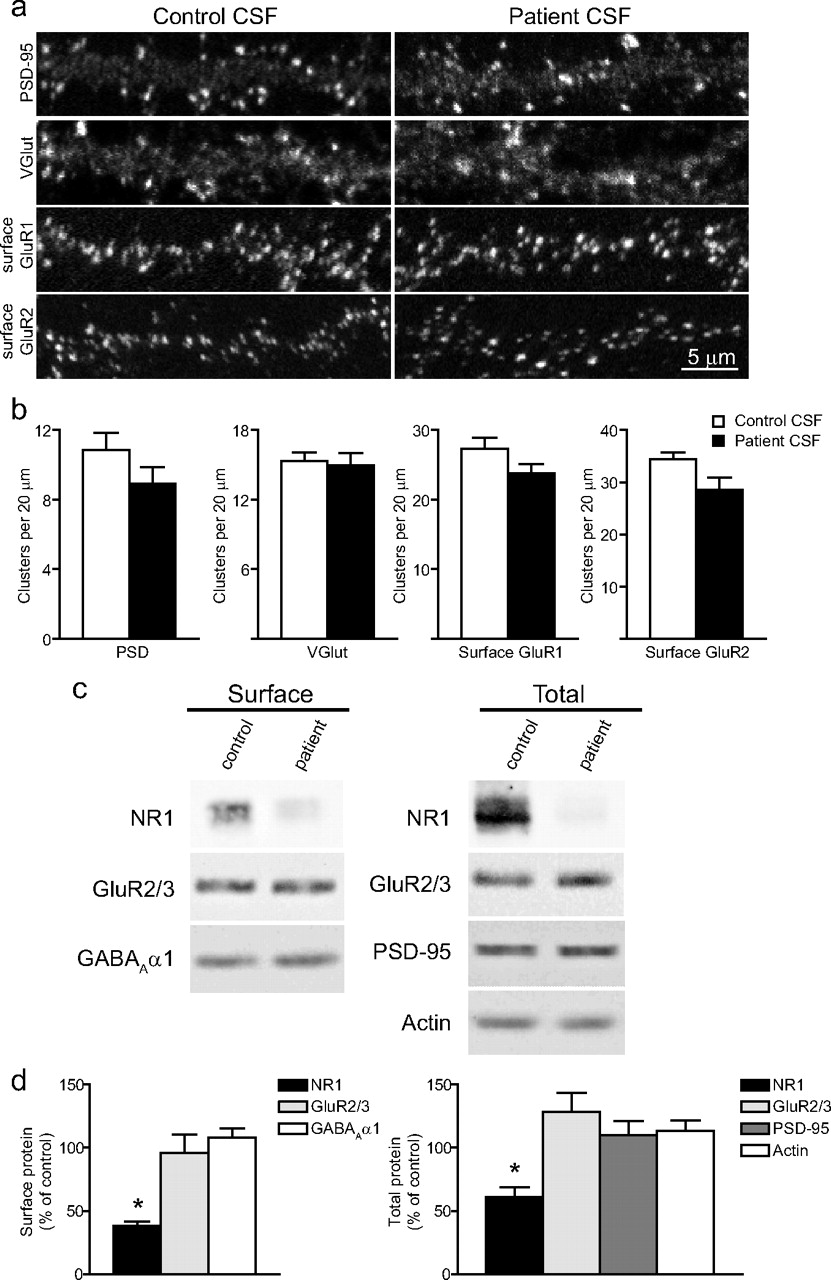
- Figure 3.
Patients' CSF and IgG treatment does not affect other synaptic components. a , Hippocampal neurons immunostained for an excitatory postsynaptic protein, PSD-95, excitatory presynaptic protein, VGlut, and surface clusters of AMPA receptor subunits GluR1 or GluR2. Scale bar, 5 μm. b , Quantification of excitatory synaptic protein density. Treatment with patient CSF did not affect the density of these excitatory synaptic proteins. All values are shown as mean ± SEM (n = 18 cells, 3 independent experiments; 1 patient, 1 control sample; Student's t test, p > 0.09). c , Western blots of excitatory postsynaptic proteins, AMPA receptor subunits GluR2/3, excitatory postsynaptic protein PSD-95 and GABAA receptors. Treatment with patient IgG did not affect surface or total neurotransmitter receptor or excitatory synapse protein levels. d , Quantification of surface (left) and total (right) protein after treatment with IgG from several patients with different antibody titer. Patient IgG resulted in a decrease in surface and total NMDAR NR1 protein but did not affect the levels of other synaptic proteins. All values are shown as mean ± SEM. The asterisk indicates significant difference (n = 3–5 Western blots; 10 patient, 2 control samples; one-way ANOVA test followed by Bonferroni's multiple-comparison test, p < 0.001).
- Figure 4.
Patient CSF treatment does not affect dendritic branching, spines, Bassoon cluster density, or cell survival. a , Hippocampal neurons transfected with the fluorescent protein, Tomato-td, imaged before and after 1 d of treatment with control or patient CSF, and traced with NeuronJ. Control (top) or patient (bottom) CSF treatment did not affect dendritic branching or complexity. Scale bar, 100 μm. b , Quantification of primary dendrite number. c , Quantification of primary dendrite length. All values are shown as mean ± SEM (n = 9 cells, 3 independent experiments; 1 patient, 1 control sample; Student's t test, p > 0.6). d , Sholl analysis of dendrite complexity before (white) and after (black) 1 d of control (left) or patient CSF (middle) treatment. Comparison of the difference before and after control and patient CSF treatment (right). e , Hippocampal neurons transfected with fluorescent protein, Tomato-td, and treated for 1 d with control or patient CSF. Control (top) or patient (bottom) CSF treatment did not affect dendritic protrusion density. Scale bar, 5 μm. f , Quantification of the density of dendritic protrusions (Student's t test, p > 0.3). g , Patient CSF treatment for 1 d does not affect Bassoon cluster density (linear regression analysis; R 2 = 0.005, p = 0.79). All values are mean ± SEM (n = 18 cells, 3 independent experiments; 12 patient, 2 control samples) (supplemental Table 1, available at www.jneurosci.org as supplemental material). h , Quantification of the density of dissociated hippocampal cells in vitro after 1 d treatment of control or patient CSF. i , Quantification of the percentage of TUNEL-positive neurons in vitro (apoptotic cells). These measures were not significantly different between control or patient CSF treatment [n = 30 fields (750 μm2), 4 independent experiments; 1 patient, 1 control sample; Student's t test, p > 0.6].
- Figure 5.
Patients' antibodies selectively decrease synaptic NMDA currents. a , mEPSCs recorded in physiological saline with TTX, picrotoxin, and 0 Mg2+ to isolate synaptic NMDAR-mediated currents (left top trace). APV, an NMDAR antagonist, blocks the slow decay of mEPSCs leaving only AMPA receptor-mediated currents, which account for the fast rise of mEPSCs (left top middle trace). CNQX, an AMPA receptor antagonist, blocks the fast rise of mEPSCs, allowing NMDAR-mediated currents to be isolated (left bottom middle trace). Both AMPA- and NMDAR-mediated synaptic currents are blocked by CNQX plus APV (left bottom trace). Note that, under the same recording conditions, treatment of hippocampal neurons with patient CSF for 1 d dramatically reduces synaptic NMDAR-mediated currents (right traces). b , Representative average mEPSCs from neurons treated for 1 d with control CSF (left) or patient CSF (middle). The difference between the 0 Mg2+ and the 0 Mg2+ plus APV traces, plotted at right, shows the NMDAR current. Neurons treated for 1 d with patient CSF have less NMDAR-mediated synaptic current than neurons treated with control CSF. c , Effect of patient antibodies on NMDA (left) and AMPA (right) receptor-mediated synaptic currents (n = 13 cells, 7 control CSF, 6 patient CSF, 4 independent experiments; 2 patient, 2 control samples). The asterisk indicates significant difference (Student's t test, p < 0.001). Error bars indicate SEM.
- Figure 6.
Patients' antibodies bind, cross-link, and internalize NMDA receptors. a , Hippocampal neurons immunostained for surface and total NMDAR clusters. Treatment with patient IgG decreases surface and total NMDAR cluster density (middle left). Treatment with patient Fab fragments does not affect surface or total NMDAR cluster density (middle right), whereas treatment with divalent patient Fab fragments (Fab fragments plus anti-Fab secondary antibodies) decreases surface and total NMDAR cluster density (right). Scale bar, 5 μm. b , Effects of patient IgG, Fab fragments, and divalent Fab fragments on surface and total NMDAR cluster density (n = 30 cells, 4 independent experiments; 2 patient, 2 control samples). The asterisk indicates significant difference (one-way ANOVA test followed by Bonferroni's multiple comparison test, p < 0.001). Error bars indicate SEM. c , Diagram that outlines the effect of each treatment on surface receptor clusters.
- Figure 7.
Patients' antibodies decrease NMDA receptor cluster density and protein in rodent and human hippocampus in vivo. a , Brain sections from rats infused with control CSF (top left) contain many NMDAR clusters in CA1, whereas brain sections from rats infused with patient CSF (top right) contain significantly reduced NMDAR clusters. Presynaptic synapsin immunostaining is similar between groups (bottom left, right). Scale bar, 2 μm. b , Effect of infusion of patient CSF with varying antibody titer on NMDAR cluster density in CA1. Each point represents the mean NMDAR cluster density from three to five images from an infused rat. Patient CSF with higher antibody titers reduce NMDAR cluster density to a greater extent than low-titer samples. Infusion with patients' CSF for 2 weeks results in a titer-dependent decrease in NMDA cluster density (linear regression analysis; R 2 = 0.32, p < 0.03). All values are mean ± SEM (n = 9 animals killed after 14 d of infusion; 5 patient, 4 control samples). c , Western blot analyses of NR1 protein in patients' CSF infused rat hippocampus (top), ipsilateral (I) and contralateral (C) to infusion; tubulin protein is a loading control (below). NR1 protein is reduced in ipsilateral patient CSF infused hippocampus compared with the contralateral, uninfused hippocampus. “F” indicates NR1 protein in the frontal cortex ipsilateral to the hippocampus infused with patients' CSF. d , Synapsin cluster density (Student's t test, p > 0.6). e , Excitatory synapse density (colocalization between synapsin and AMPAR clusters; Student's t test, p > 0.5). f , Hippocampal section from a control patient (left) and from a patient with anti-NMDAR encephalitis (right) immunostained with a commercial anti-NR1 antibody. g , The boxed areas in f are shown at higher magnification. Scale bars: top, 1 mm; bottom, 25 μm. h , Intensity of NR1 immunostaining is dramatically reduced in the hippocampi of anti-NMDAR encephalitis patients (n = 2) compared with hippocampi of control patients (n = 3). The distribution of both patient values for NR1 intensity is significantly different from the distribution of control values (paired Komolgorov–Smirnov test, p < 0.05).


Additional Files
Supplemental Data
Files in this Data Supplement:
- supplemental material - Supplemental Material


