

Article Figures & Data
Figures
- Figure 1.
A, Diagram of the experimental design for single-unit and eye movement recordings (Rec). The abducens nucleus (ABD) contains motoneurons (Mn), which innervate the lateral rectus muscle (LR), and internuclear neurons (Int), which has axons that contact the contralateral medial rectus muscle (MR) innervating motoneurons through the oculomotor nerve (IIIn) of the oculomotor nucleus (OCM). Abducens neurons receive burst input from excitatory (EBN) and inhibitory (IBN) reticular neurons, and tonic inputs from bilaterally (i, ipsilateral; c, contralateral) projecting prepositus hypoglossi (Ph) neurons. Bipolar stimulating (St.) electrodes were implanted on the VIth nerve (VIn; St. 1) and on the medial longitudinal fasciculus (MLF; St. 2). After control sessions, the lateral rectus muscle was removed and an intraorbitary device (IOD) was implanted in the VIth nerve. B, Diagram of the time course of treatments.
- Figure 2.
Changes on the expression of p75NTR and TrkA. A–C, Motoneurons illustrating p75NTR immunostaining in control (A), 15 d after axotomy (B), and 15 d treated with NGF after axotomy (C). Insets show ChAT immunoreactivity for the same motoneurons. D–F, Same as A–C, but for TrkA immunostaining. G, Changes in cytoplasmic mean gray value (MGV in counts per pixel, cpp) after p75NTR (gray bars) and TrkA (black bars) immunoreactivity. Asterisks and dots indicate differences with respect to the control and axotomy groups, respectively (ANOVA, Holm-Sidak method for pairwise multiple comparisons, p < 0.01). H, Axons in the rootlets of the abducens nerve (ABDn) demonstrating TrkA immunoreactivity. I, Immunoblotting showing the expression of NGF protein in the lateral rectus muscle (LRm). Size markers units are kDa. CON, Control; Ax, axotomy. Scale bars: F, 20 μm; H, 2 μm.
- Figure 3.
Effects of NGF and NGF receptor blockers on the discharge pattern of abducens motoneurons. A, Firing rate (FR) profile of a control abducens motoneuron recorded during spontaneous eye movements. The single-unit discharge of action potentials (AP) is shown in the middle trace. EP, Eye position; L, movement to the left; R, movement to the right. B, Same as A, but for a motoneuron recorded 20 d after axotomy without reinnervation. Note reduced firing during both saccades and spontaneous fixations. C, D, NGF treatment causes recovery of the burst-tonic firing pattern; however, the discharge variability increased during eye fixations. E, Motoneurons treated with K252a still showed part of the effects produced by NGF, indicating that part of the effects of NGF could also be mediated via the p75NTR. F, Motoneurons treated with K252a and the p75NTR blocker REX demonstrated an axotomy-like firing profile although they were firing continuously.
- Figure 4.
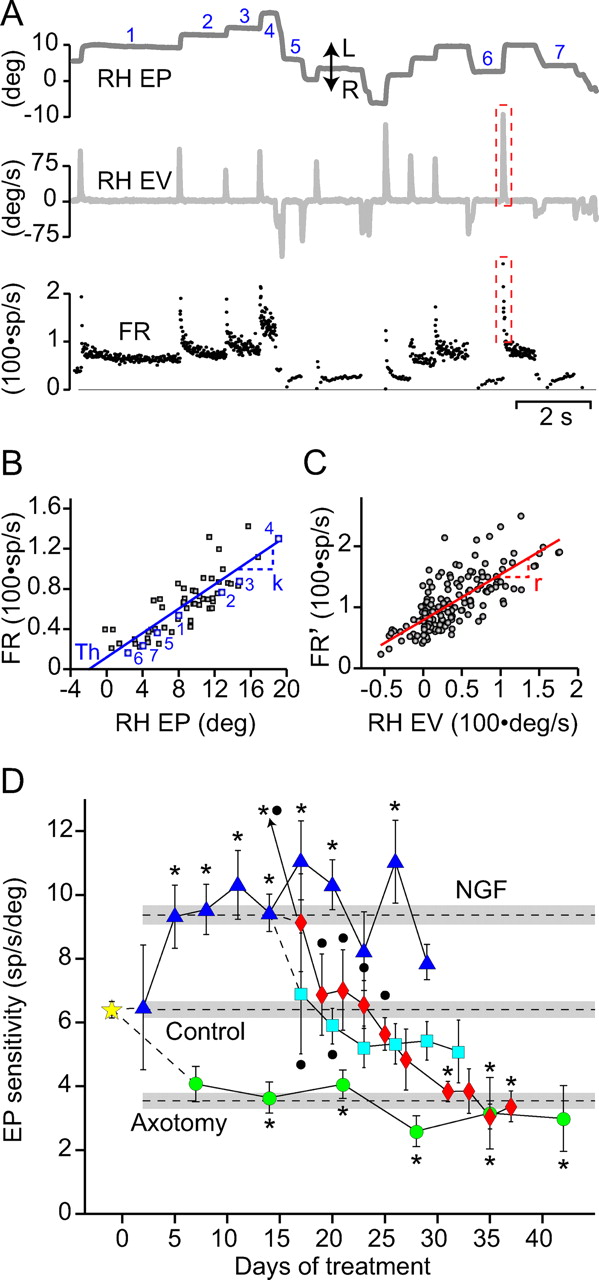
NGF produces recovery of the discharge characteristics of axotomized motoneurons. A, Control motoneurons burst for on-directed saccades and fire tonically during eye fixations. Panels show from top to bottom: right horizontal eye position (RH EP), velocity (RH EV), and the firing rate (FR). L, Movement to the left; R, movement to the right. B, Regression plot of the motoneuron shown in A obtained during spontaneous fixations. Some of the fixations are labeled with numbers both in A and B. The slope of the regression line is the eye position sensitivity of the motoneuron (k). In this case, k = 7.0 sp/s/deg (r = 0.89; p < 0.001). The intercept with the abscissa represents the eye position for neuronal recruitment. Th, Threshold. C, Partial regression plot during spontaneous saccades (like the boxed area in red in A) obtained after plotting firing rate, minus the position component, versus eye velocity. The slope of the regression line is the eye velocity sensitivity of the motoneuron (r). In this case, r = 0.75 sp/s/deg/s (r = 0.74; p < 0.001). D, Time course of changes in eye position sensitivity of motoneurons that received the different treatments. The yellow star indicates the control population mean. NGF-treated cells are indicated with blue triangles and axotomized ones with green circles. The dual NGF-receptor blocking treatments started 15 d after NGF treatment and consisted on NGF+K252a (cyan squares) and NGF+K252a+REX (red diamonds). The dashed lines and gray bands indicate the mean and SE of the control, axotomized, and NGF-treated populations. Asterisks and dots indicate differences with the control and axotomy group, respectively (ANOVA; Holm-Sidak; p < 0.05).
- Figure 5.
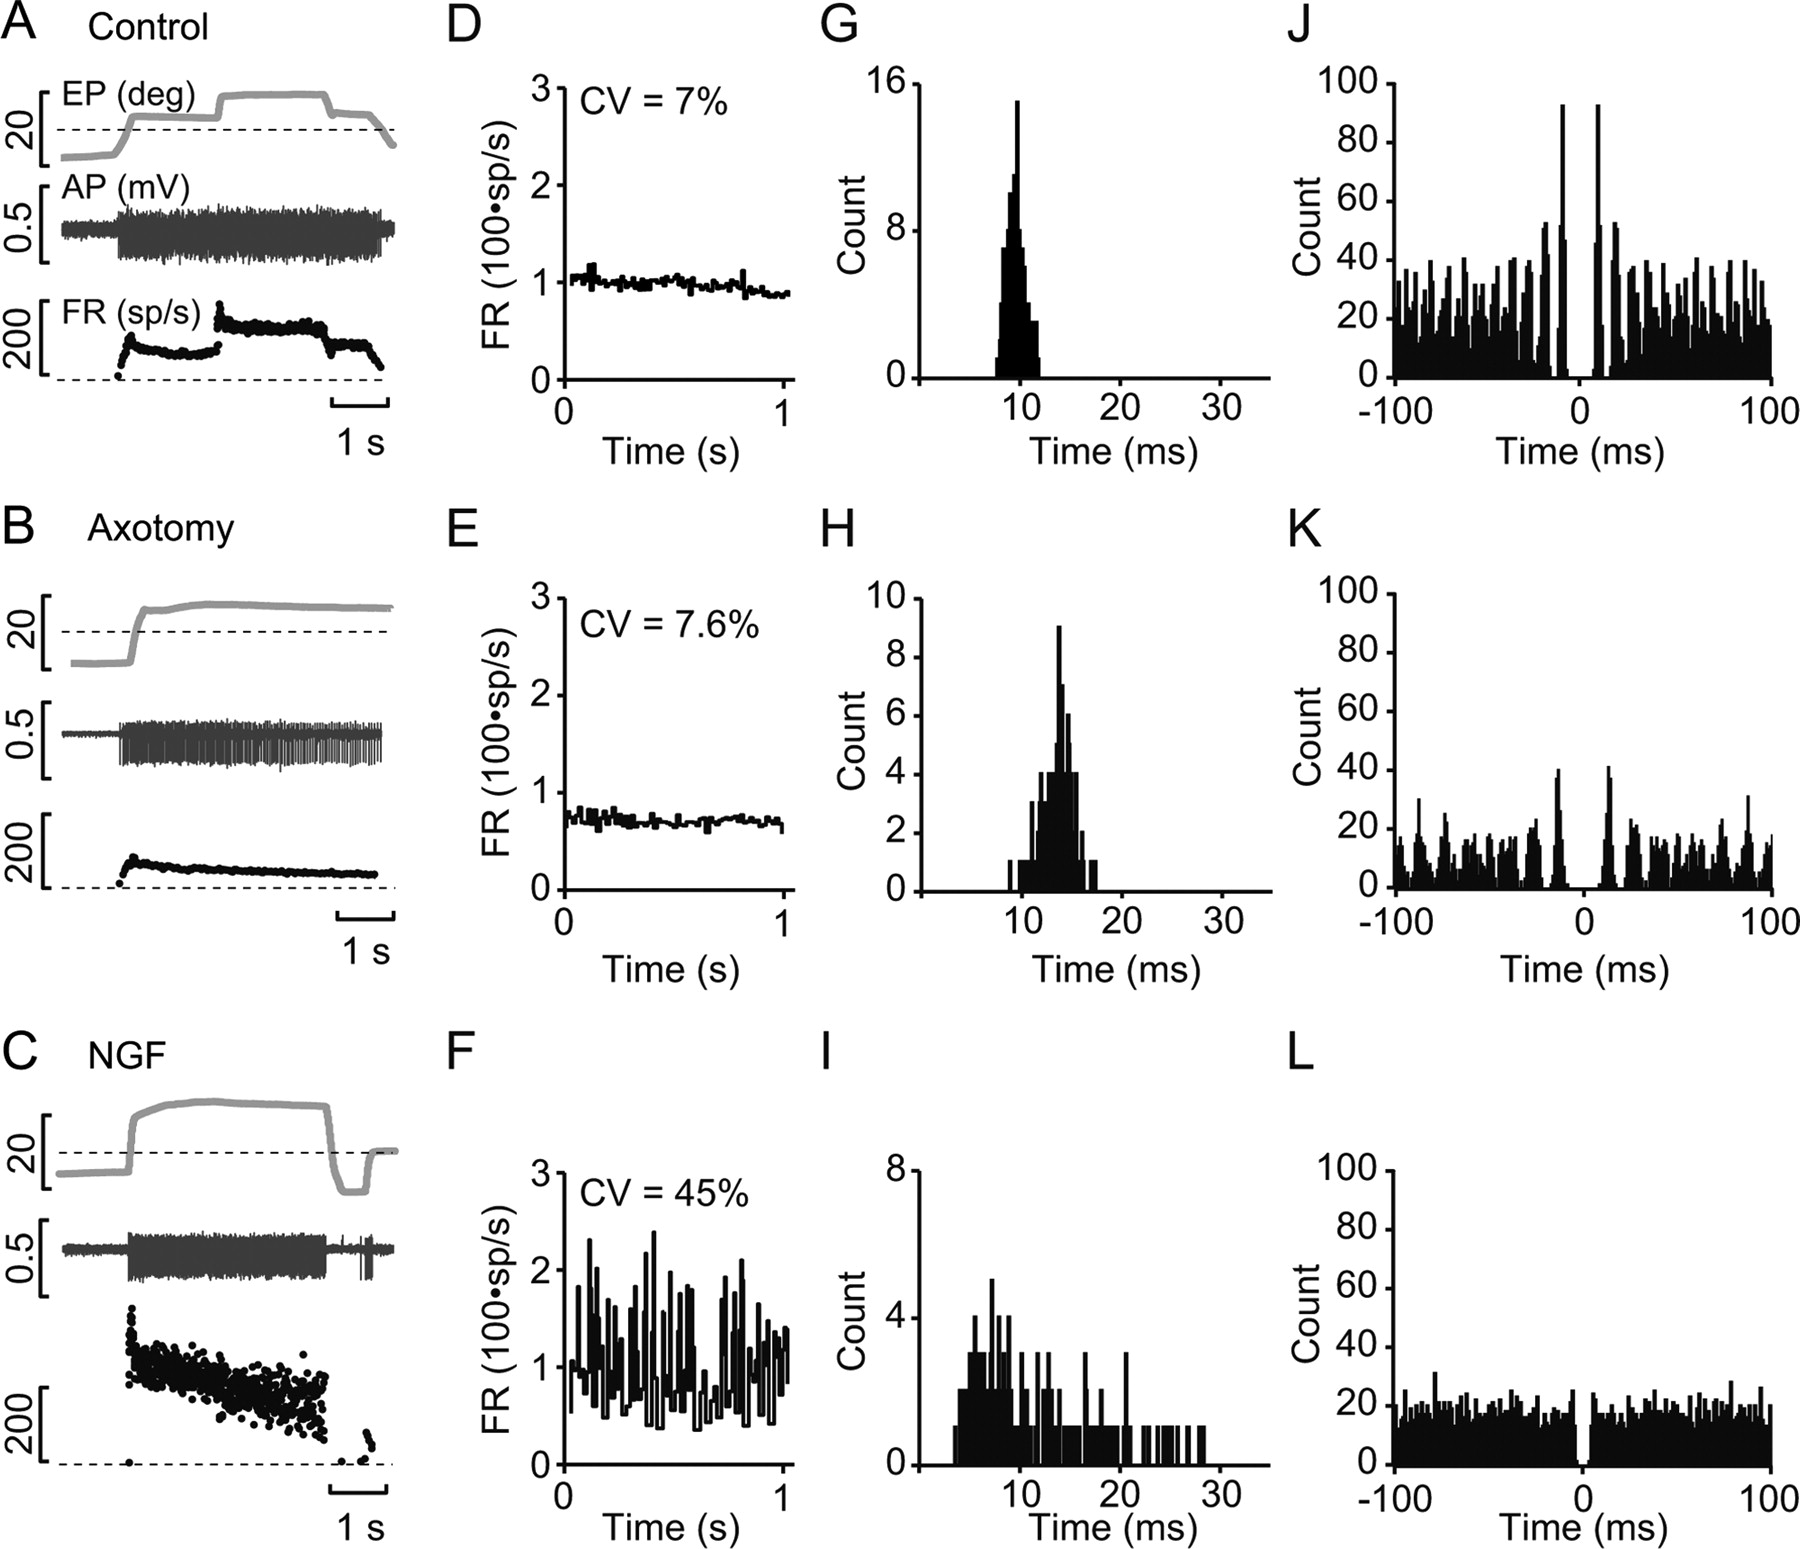
NGF effects on the discharge variability of axotomized motoneurons. A–C, Firing patterns of control (A), axotomized (B), and axotomized but NGF-treated (C) motoneurons. The firing rate (FR) in control and axotomized motoneurons showed a highly regular profile during spontaneous eye movements (EP). The single-unit discharge of action potentials (AP) is shown in the middle trace. D–F, Periods of 1 s of instantaneous firing rate in a control (D), axotomized (E), and NGF-treated (F) abducens motoneuron. Stationary periods were selected as having similar mean firing rate across groups. Note, however, the large increase of both the SD and the coefficient of variation (CV) in F. G–I, First-order ISI histograms from the corresponding cells shown in A–C, but constructed using a 2 s sample (bins of 0.1 ms). Distributions were normal except in I (Kolmogorov–Smirnov test; p > 0.05), which showed a high skew to the right. J, The control autocorrelogram (1 ms bin size) showed one clear peak, isolated from the base, and up to three clear peaks, fused in the base (same cell as in A, D, and G). K, The autocorrelogram of the axotomized motoneuron shown in B and E demonstrated a somewhat higher variability than the control motoneuron. L, The autocorrelogram of the NGF-treated motoneuron illustrated in C and F showed a complete absence of spike predictability.
- Figure 6.
Blockade of NGF receptors restores firing variability of axotomized motoneurons. A, Plot of the coefficient of variation (CV) versus the mean firing frequency of 2097 stationary periods obtained from 70 control motoneurons. Note that higher CV accompanies lower firing frequencies. B, Firing variability (CV) of all experimental groups showed an exponential decay as the discharge rate increased (color codes as shown in C). Fitted lines are double exponentials with R2 > 0.95 in all cases (p < 0.001). Values are represented as mean ± SEM of CV in percentage of different firing frequencies spaced every 5 Hz. All comparisons between groups were significantly different (ANOVA test, Tukey test for post hoc comparisons, p < 0.001). C, Comparison of CV in the interval 30–80 sp/s. Note that NGF treatment dramatically increased the firing variability, whereas blockade of TrkA receptors partially decreased variability, and blockade of both p75NTR and TrkA receptors restored firing variability to axotomy levels (ANOVA test, Holm–Sidak method, p < 0.05). Symbols indicate significant differences between control (*; Con.), axotomy (• Ax.), and NGF treatment (‡) experimental groups. #, NGF+K252a treatment.
- Figure 7.
NGF prevents synaptic stripping of motoneurons. A–D, Confocal images of motoneurons in control, axotomy, and NGF-treated groups illustrating the innervation (green; A, C) or the inhibitory boutons labeled with antibody against VGAT (green; B, D), or the ChAT-labeled motoneuronal cell bodies (red; A–D). All sections were obtained from animals 15 d after either axotomy or axotomy and treatment. Note the marked reduction of boutons after 15 d of axotomy. Scale bars: B, 20 μm; D, 80 μm.
- Figure 8.
NGF promotes maintenance of afferent innervation on motoneurons. The linear density of synaptophysin-IR (SYN) and VGAT-IR (VGAT) boutons over the somatic perimeter of motoneurons changes after axotomy and the different treatments. Bars represent mean ± SEM for 17–38 motoneuronal profiles in each group. Symbols indicate differences between control (*; Con.), axotomy (•; Ax.), and NGF (‡) groups. ANOVA, Holm–Sidak method for multiple pairwise comparisons (p < 0.05).
- Figure 9.
NGF maintains the inhibition to excitation balance. A, Changes in eye position (EP) sensitivity calculated as k-on or k-off, depending on the direction of the preceding saccade. Note that axotomy decayed both sensitivities, whereas NGF greatly improved them, maintaining the relative proportion of inhibition to excitation. Blocking TrkA receptors reduced sensitivities significantly. However, only k-off was further reduced upon the double block (ANOVA, Holm–Sidak method for multiple pairwise comparisons, p < 0.05). Symbols indicate differences with control (*; Con.), axotomy (•; Ax.), and NGF (‡) groups. B, Diagram illustrating the sensitivity (k; dashed lines) in control (gray), after NGF (blue), and after double NGF receptor blockade (red). Solid lines in the upper-right quadrant indicate the k-on values and solid lines in the lower-left quadrant depict the k-off sensitivities. The straight gray dashed line indicates the rate-to-position plot of the average control motoneurons. Note that double blockade of NGF receptors reduced the k-off (curved red arrow), indicating that motoneurons were markedly disinhibited. To the contrary, the k-off and k-on values were comparable in both control and NGF-treated cells, despite a trend toward higher inhibition in NGF-treated motoneurons.


Tables
- Table 1.
Effects of NGF and receptor blocking on motoneuronal sensitivities and recruitment threshold
Treatment N k (sp/s/deg) r (sp/s/deg/s) Th (deg) Control 70 6.40 ± 0.26 0.73 ± 0.04 −7.10 ± 0.86 Axotomy 53 3.54 ± 0.25* 0.47 ± 0.03* −6.62 ± 1.00 NGF 134 9.37 ± 0.30*† 0.93 ± 0.03*† −2.22 ± 0.31*† NGF+k252a 46 5.31 ± 0.34†‡ 0.65 ± 0.04†‡ −1.59 ± 1.51*† NGF+k252a+REX 39 4.34 ± 0.27*‡ 0.53 ± 0.04*‡ −5.28 ± 0.73 ↵Values are means ± SEM. Symbols indicate significant differences between control (*), axotomy (†), and NGF (‡) groups (one-way ANOVA, Holm–Sidak method for post hoc comparisons, p < 0.05). Th, Threshold.
Supplemental Data
Files in this Data Supplement:
- supplemental material - Supplemental Figures


