

Article Figures & Data
Figures
- Figure 1.
VGluT2 labeling is specific for TC boutons in layer 4 of mouse V1. A1–A3 , Confocal images of TC axons labeled with micro-ruby. The dashed lines mark the upper and lower bounds of layer 4. Note the correspondence of TC axonal elaborations with the pattern of VGluT2 staining. Dense labeling of both axons and puncta is evident in layers 2/3 and 4. B–E , Representative high-magnification confocal images of dual labeling with TC boutons ( B1–B3 , C1–C3 ) and IC boutons ( D1–D3 , E1–E3 ) in layer 4. Note the obvious colocalization (yellow) between TC boutons and VGluT2 puncta ( B3 , C3 ), but not IC boutons ( D3 , E3 ).
- Figure 2.
Colocalization analysis in layer 4. A , Examples of micro-ruby-filled TC axonal boutons (arrowheads) in maximum-intensity Z-projections of 15 optical sections (Z = plane number). The grayscale images show single optical sections for each channel and regions of interest with corresponding pixel areas (white denominator: total pixels within region; colored numbers: red, axon; green, VGluT2; yellow, overlap). The white numbers in the colocalized panels are the respective ρ-bouton values. B , Higher magnification views of single boutons from the above panels (indicated by red arrowheads in A ). The colored pixels have gray values above the threshold (see Materials and Methods). Note that there is a significant spatial correlation between red and green pixels for the TC bouton, but not the IC bouton. Although ρ is positive for both examples, colocalization is only significant for the TC bouton and is an example of how spurious overlap can be discerned with a relatively straightforward pixel-based analysis. C , Summary of colocalization analysis for each bouton population. The box plots show the distribution of correlation coefficients calculated for each bouton class. The horizontal lines mark the 25th, 50th (red), and 75th percentiles, and the ends of the whiskers mark the 2.5th and 97.5th percentiles (n = 47 TC, n = 50 IC; n = 3 animals per group). The two distributions were statistically different from each other (p < 10−13, K-S test). Correlation coefficients for individual boutons are plotted as gray symbols; data from each animal are represented by different shapes.
- Figure 3.
VGluT2 immuno-EM and experimental design summary. A , High-magnification micrograph showing VGluT2-labeled synaptic terminals (TC/green highlight, VGluT2-positive terminal; orange highlight, unlabeled terminal; S/pink highlight, dendritic spine head; D, dendritic shaft; arrows are pointing to PSDs). VGluT2 label was confined to presynaptic terminals, the majority of which made synaptic contact with dendritic spines. For labeled synaptic terminals (n = 634), 77.4 ± 2.6% contacted spines and 22.5 ± 2.6% contacted dendritic regions. For unlabeled synaptic terminals (n = 1341), 71.1 ± 4.1% contacted spines and 28.7 ± 4.1% targeted dendritic shafts. VGluT2-labeled synaptic terminals represented a distinct subclass in layer 4 (supplemental Fig. S3A, available at www.jneurosci.org as supplemental material). B , Diagram summary of the sampling methods used for quantifying the effects of monocular deprivation on TC synaptic input to layer 4. Step 1, Coronal sections through binocular V1 (circled area) were cut from occipital lobes. The schematic of the mouse primary visual pathway shows how information from the two eyes is transmitted to segregated regions within dorsal lateral geniculate nucleus and is then relayed to the binocular segment of V1 (green patch) via TC afferents. Yellow indicates the ipsilateral (nondeprived eye) pathway and blue indicates the contralateral (deprived eye) pathway. Step 2, Before embedding for EM, immunohistochemistry (IHC) for VGluT2 (darker band indicates higher density staining in layer 4) was performed on vibratome sections prepared from MC animals and yoked, littermate controls. Step 3, Layer 4 was then blocked and processed for EM. The portion of tissue that remained unlabeled because of limited antibody penetration is indicated in light yellow. Ultrathin sections cut near-parallel to the surface contain the labeled portion at the tissue–resin interface (indicated by the dashed line). Several nonoverlapping images (total area, >1000 μm2) were then acquired from ultrathin tissue close to the tissue–resin interface and analyzed blind to condition. C , Experimental timeline showing ages at which MC, eyeball injections (arrowheads), and perfusions were performed.
- Figure 4.
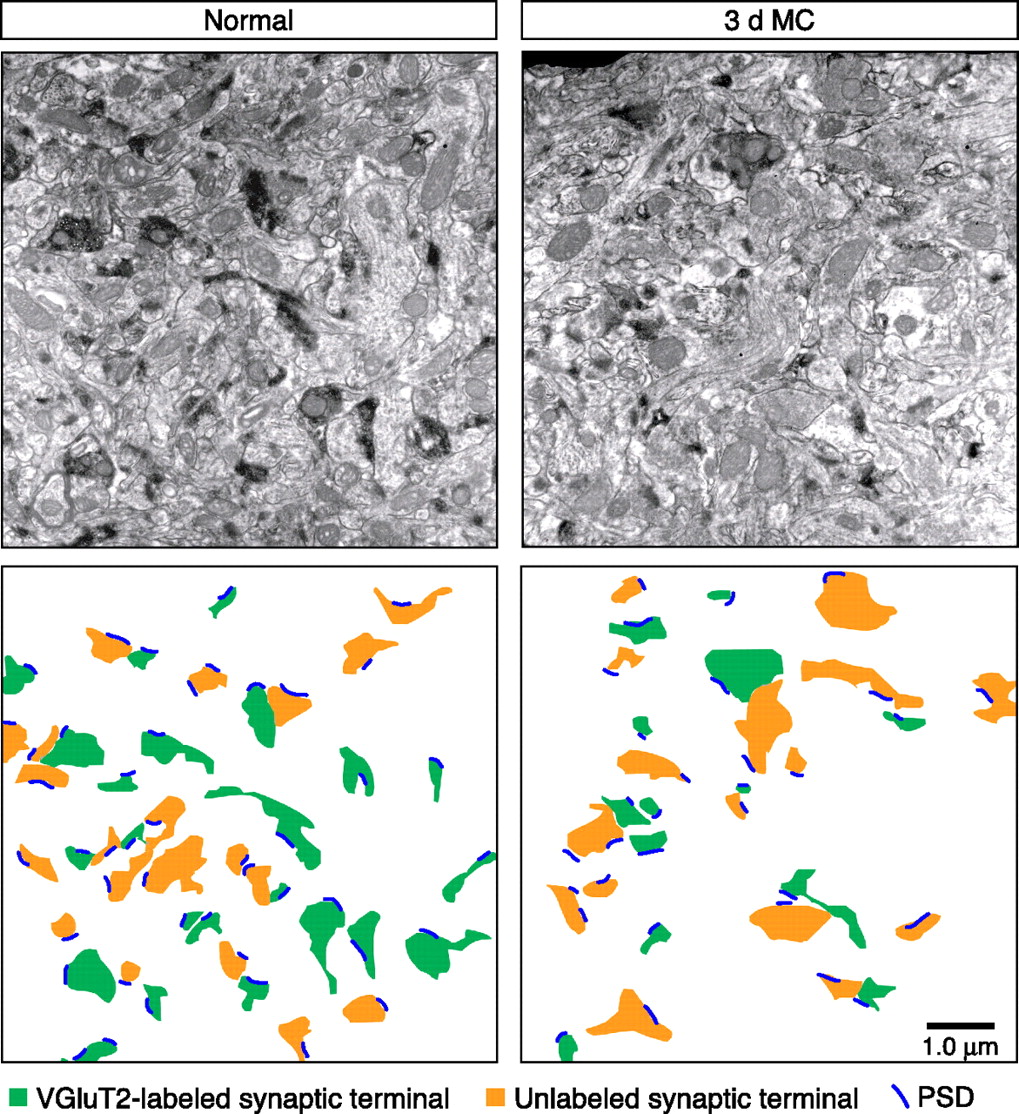
VGluT2-labeled synaptic terminal density after 3 d MC. Example low-magnification EM micrographs from a control (normal) and 3 d MC case. The diagram below each image highlights identified synaptic terminals and PSDs in each case. Note the reduction in both the number and size of VGluT2-labeled terminals in the 3 d MC case.
- Figure 5.
The effect of 3 d MC on the density and terminal morphology of VGluT2-labeled synapses. A , Summary of labeled (VGluT2+) synaptic density (mean ± SEM). The asterisk in A indicates statistically significant difference from control (p = 0.0002, unpaired t test) (C, control). B–D , Cumulative probability histograms of PSD lengths, VGluT2-positive terminal size, and terminal size of all layer 4 terminals (black, control; blue, MC). The distributions of PSD lengths ( B ) and synaptic terminal sizes ( C ) were significantly different between 3 d MC and control animals (p = 0.02, K-S test). The distributions of synaptic terminal sizes in layer 4 ( D ) were significantly different between 3 d MC (n = 355 terminals) and control (n = 345 terminals) groups, which was attributable to a loss of larger-sized terminals (p = 0.03, K-S test). The terminals in D were sampled in layer 4, >200 μm from the surface of vibratome sections cut from control (non-MC) and 3 d MC brains. E , Frequency distribution histogram of data shown in D .
- Figure 6.
The effect of 3 d MI on VGluT2-labeled synapses and the relationship between the direct pupillary reflex and VEPs. A , Summary of VGluT2+ synaptic density (mean ± SEM) (C, control; SAL, saline). B , C , Cumulative probability histograms of PSD lengths ( B ) and VGluT2-positive terminal size ( C ) (gray, saline; red, TTX). The distributions of PSD lengths and synaptic terminal sizes were not significantly different between 3 d MI and control animals (p > 0.05, K-S test). D , Experimental timeline and representative traces of the average field potentials evoked by a patterned visual stimulus viewed through the TTX-injected eye. Recordings were made in the binocular region of V1 contralateral to the injected eye. In this example, evoked cortical activity returned after 24 h and was fully restored by 36 h. For the MI experiments used in the EM analysis, a second TTX injection (gray arrow) would have been administered before the appearance of visually evoked activity in V1, maintaining full retinal blockade. E , Summary of direct and consensual pupillary reflexes with no TTX (black) and 2 or 20 h after TTX (red). The magnitude of pupillary constriction is represented by the percentage change in the pupil radius on direct light stimulation of a dark-adapted eye. Thus, 0% indicates a nonreflexive pupil (tonically dilated). Pupillary responses >20% would have been excluded from the MI experiments ( E , F , dashed line). Each open circle represents an individual animal, and the filled circles show group means ± SEM [ipsilateral (direct) pupil constriction values: uninjected, 63 ± 3%, n = 8; 2 h TTX, 0 ± 1%, n = 10; 20 h, 27 ± 5%, n = 14; contralateral (consensual) pupil constriction values: uninjected, 24 ± 6%, n = 8; 2 h TTX, −1 ± 2%, n = 10; 20 h, 6 ± 3%, n = 15]. F , Constriction of the TTX-injected eye evoked by direct stimulation plotted as a function of cortical VEPs (17–22 h after injection, normalized to pre-TTX baseline values). Note that the absence of a direct pupillary reflex in the TTX-injected eye, as described in Materials and Methods, is sufficient to confirm retinal blockade as assessed by the presence of a categorical VEP. Recorded field potentials were classified as containing “no VEP” if the scored amplitude was <2 SDs of the noise (field potentials recorded in response to gray screen). Responses were recorded ∼17–22 h after TTX.
- Figure 7.
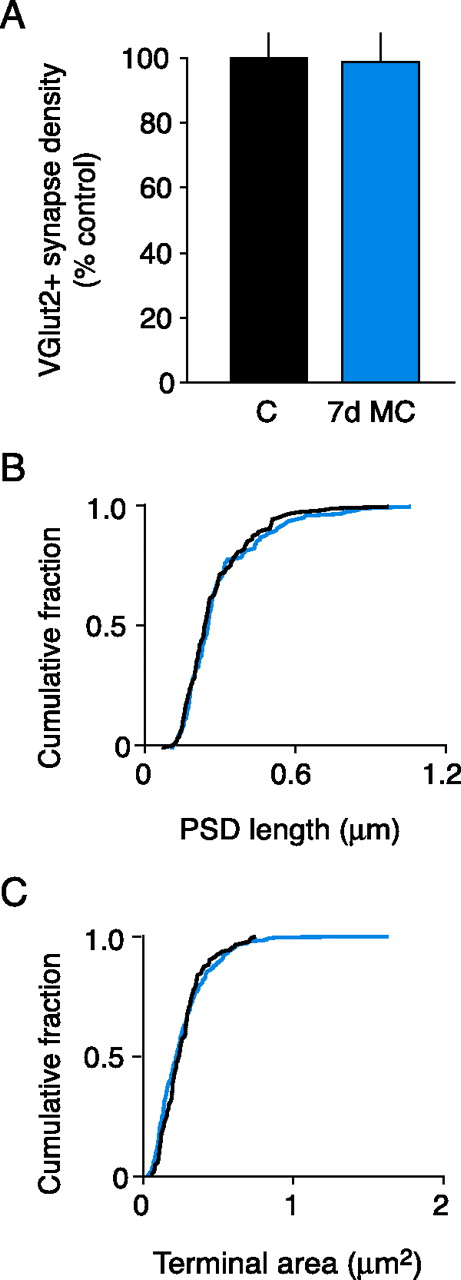
The effect of 7 d MC on VGluT2-labeled synapse density and morphology. A , Summary of VGluT2+ synaptic density (mean ± SEM). B , C , Cumulative probability histograms of PSD lengths ( B ) and VGluT2-positive terminal size ( C ) (black, control; blue, MC). The distributions of PSD lengths and synaptic terminal sizes were not significantly different between 7 d MC and control animals (p > 0.05, K-S test).
- Figure 8.
Proposed model for how the experience-dependent structural remodeling of TC synapses maps onto physiological OD plasticity in mouse V1. A , Schematic of the primary visual pathway in mouse. B , Previous studies used chronic VEP recordings to monitor contralateral-eye (blue) and ipsilateral-eye (yellow) responses in V1 contralateral to the deprived eye (DE), which is dominated by contralateral input. Changes in responsiveness to binocular stimulation ( B , dashed lines) are detected contralateral to the DE after 3 and 7 d of MC. Total TC synaptic drive in V1 is reduced by one-third after 3 d of MC and is caused by DE depression. After 7 d of MC, total TC synaptic drive is restored to pre-MC levels because of the subsequent potentiation of non-DE responses (yellow bars) [schematized VEP data adapted from Frenkel and Bear (2004)]. C , These changes are mirrored by the structural remodeling of net TC synaptic input detected in layer 4 (Figs. 5 A, 7 A). The diagram illustrates how MC-induced TC synaptic remodeling could occur in layer 4. Because the majority of neurons in mouse V1 are binocularly responsive and the relative magnitude of the input of each eye is reflected in the relative density of afferent input (Coleman et al., 2009), eye-specific input to a dendritic subregion of a binocular neuron is depicted by the relative number of TC synapses (ipsilateral TC input, yellow; contralateral TC input, blue). We propose that the depression of DE responses after 3 d of MC results from the weakening of layer 4 TC synapses, a subset of which is then targeted for elimination. Presynaptic terminals that provide driving input from DE axons (blue) have retracted by the time maximal depression has occurred. After 7 d of MC, two forms of presynaptic change that mirror physiological plasticity could account for deprivation-enabled potentiation: (1) The seemingly normal density of TC synapses could be explained by the addition of new synapses formed along TC axons serving the non-DE, and (2) the growth of existing non-DE synapses may also occur to restore the normal distribution of terminal size.


Additional Files
Supplemental Data
Files in this Data Supplement:
- supplemental material - Supplemental Figures


