

Article Figures & Data
Figures
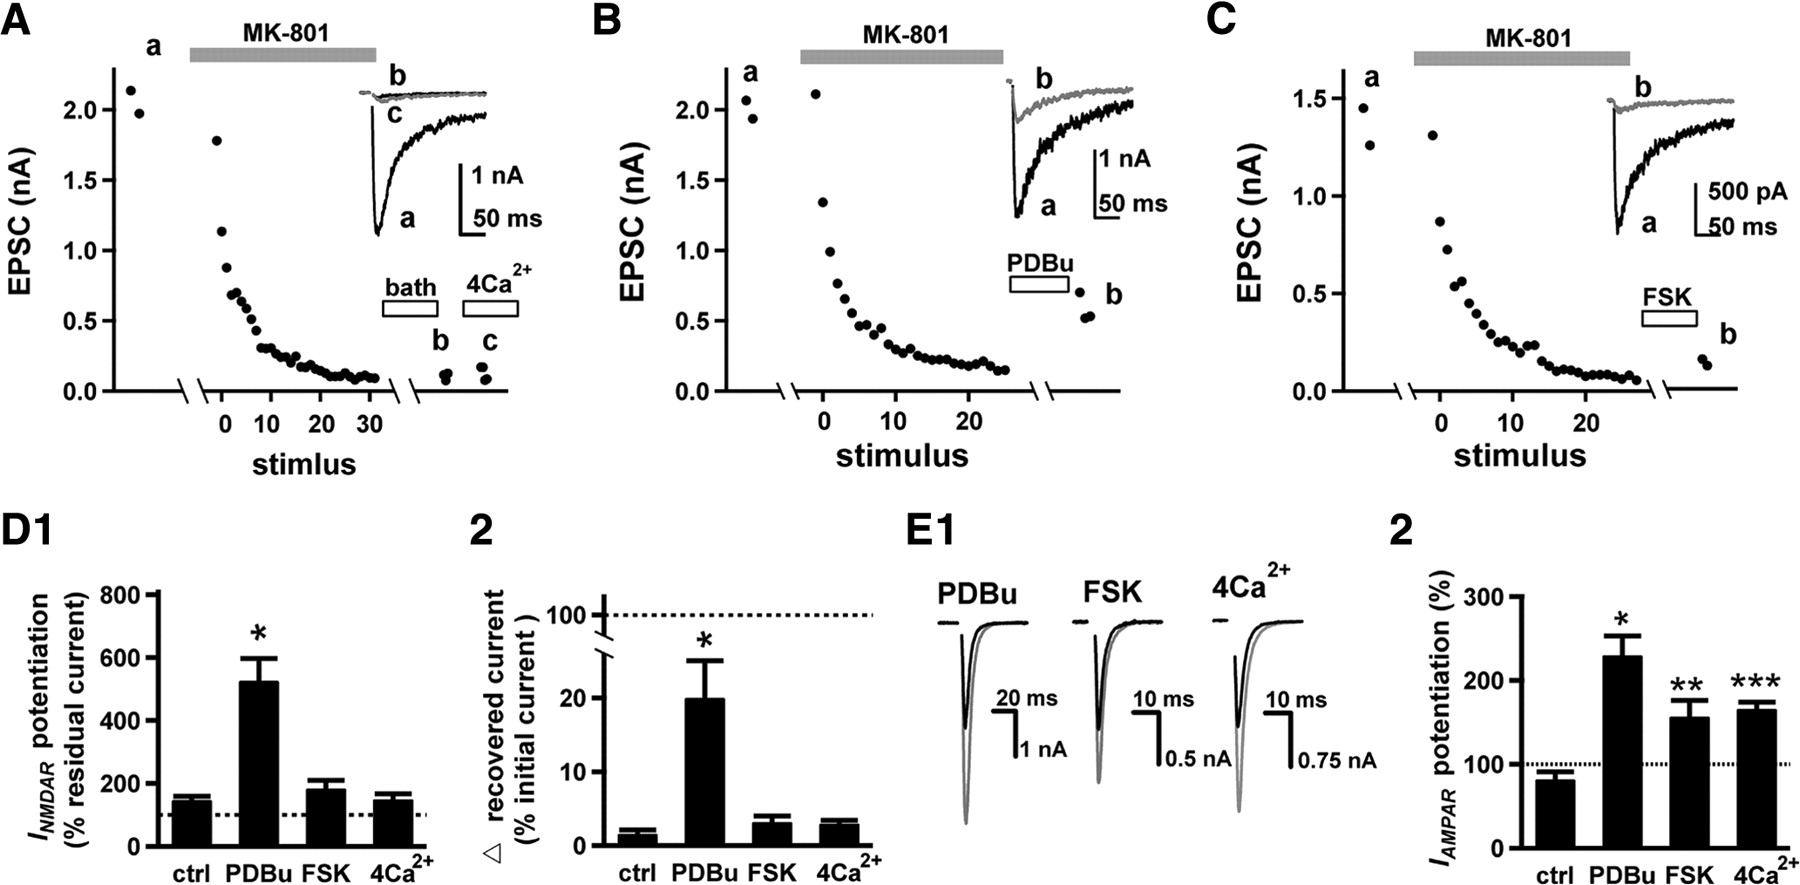
- Figure 1.
Modulators differentially potentiate NMDAR-mediated EPSCs after MK-801 block of synaptic NMDARs. A, Example of progressive MK-801 block during evoked stimulation and subsequent recovery of INMDAR. Synaptic receptor blockade was accomplished by delivering low-frequency presynaptic stimulation (0.1 Hz) in the presence of MK-801 (5 μm). The gray bar indicates the time period when MK-801 was applied; the open bars show application of regular extracellular saline solution (bath) or of elevated Ca2+ (4Ca2+). The recovered INMDAR in regular external bath or 4 mm Ca2+ was sampled 2–3 min after MK-801 wash off. The amplitude of INMDAR is plotted against the stimulus episode. Inset, Superimposed initial (a), the basal recovered INMDAR (b), and the recovered current in 4 mm Ca2+ (c) shown from the corresponding time point in the amplitude–stimulus plot. B, C, Similar to A, with PDBu (1 μm) (B) or FSK (50 μm) (C) applied during the 2 min interval after MK-801 wash off. D1, Summary of synaptic INMDAR potentiation by modulators after synaptic receptor blockade. The residual INMDAR after MK-801 block is set as 100% (PDBu: 526 ± 71%, n = 10, *p < 0.00007; FSK: 184 ± 25%, n = 7; 4 mm Ca2+: 150 ± 17%, n = 8; statistical comparison is with the control: 147 ± 12%, n = 8). D2, Comparison of the percentage INMDAR recovery (Δ recovered current = recovered current − residual current) after modulator treatment. The Δ recovered INMDAR is normalized to the initial INMDAR. The initial INMDAR is set to 100% (PDBu: 20 ± 5%, n = 10, *p < 0.005; FSK: 3.2 ± 0.8%, n = 7; 4 mm Ca2+: 3.0 ± 0.4%, n = 8; statistical comparison is with the control: 1.6 ± 0.5%, n = 8). E, Synaptic NMDAR blockade did not affect IAMPAR potentiation by modulators. E1, Sample traces of IAMPAR in 4 mm Ca2+, PDBu, and FSK (gray); traces are superimposed on their corresponding initial EPSC (black). The percentage potentiation of EPSCs by modulators is summarized in E2 (PDBu: 230 ± 23% of initial IAMPAR, n = 10, *p < 0.0002; FSK: 157 ± 19% of the initial IAMPAR, n = 7, **p < 0.02; 4 mm Ca2+: 163 ± 8% of the initial IAMPAR, n = 7, ***p < 0.002; all statistics are compared with the control: 83 ± 8%, n = 8). Error bars indicate SEM.
- Figure 2.
Modulators equally potentiate AMPAR- and NMDAR-mediated EPSCs. A, The effect of modulators on AMPAR and NMDAR EPSCs was examined by comparing AMPAR and NMDAR components of EPSCs before and after 2 min of modulator application. Examples of EPSC in PDBu (left panel; gray) or FSK (right panel; gray) are superimposed on the respective baseline EPSCs (black). B, Summary of potentiation of AMPAR (A) or NMDAR (N) components by PDBu (left) and FSK (right). The gray lines represent responses from individual cells. For PDBu, IAMPAR, 199 ± 16% of baseline; INMDAR, 199 ± 21% of baseline; n = 6; p = 0.99. For FSK, IAMPAR, 145 ± 9% of baseline; INMDAR, 147 ± 15% of baseline; n = 6; p = 0.88. Error bars indicate SEM.
- Figure 3.
Acute PDBu application does not increase surface NMDARs. A, After whole-cell blockade of NMDARs, PDBu caused minimal recovery of whole-cell INMDAR. Sample traces of time-dependent (A, top) or PDBu-dependent (A, bottom) effect on whole-cell INMDAR after blocking surface NMDARs. B, Similar to A. The comparison of time-dependent effect and the effect of PDBu on synaptic INMDAR after whole-cell NMDAR blockade. C, Quantification of residual whole-cell and synaptic INMDAR after control or PDBu treatment after surface receptor blockade. The peak currents are normalized to the initial current before MK-801 block (whole-cell current: 5.8 ± 2.5% in control, n = 6; 6.2 ± 2.2% in PDBu, n = 6; p = 0.58; synaptic current: 5.2 ± 1.2% in control, n = 6; 7 ± 2.5% in PDBu, n = 6; p = 0.59). Error bars indicate SEM.
- Figure 4.
PKC inhibition does not prevent INMDAR recovery by PDBu. A, PDBu effectively potentiated IAMPAR (A1) and robustly recovered INMDAR (B1) after MK-801 block. A1, Sample trace of IAMPAR potentiation after PDBu treatment from the same cell is superimposed on the initial current. B1, PDBu-recovered INMDAR is superimposed on the initial (before blocking) and the postblock residual current. A2, B2, Similar to A1 and B1, PKC inhibitor Gö6983 (2 μm) was present before and during the experiments. Average PDBu effect on IAMPAR potentiation in the absence (PDBu) or presence (PDBu/Gö) of PKC inhibitor: 192.3 ± 23.5% in PDBu, n = 9; 147.2 ± 19.1% in PDBu/Gö6983, n = 11; p = 0.15. Average effects of PDBu from the experiment in B are given as percentage of initial current before MK-801 block: 17.6 ± 4.7% in PDBu, n = 9; 15.4 ± 2.9% in PDBu/Gö6983, n = 11; p = 0.7.
- Figure 5.
Sucrose-evoked EPSCs are increased by PDBu. A, Hypertonic sucrose solution (0.75 m) was used to evoke release from autaptic neurons as a measure of the RRP size before and after PDBu administration for 2 min. Sucrose was applied during the entire trace shown. After PDBu challenge, RRP, measured as sucrose-evoked postsynaptic charge integral, was slightly but significantly increased [128 ± 9% to control (100%); n = 9; *p < 0.02]. The percentage increase was consistent with the degree of INMDAR recovery. The gray traces represent individual examples of normalized postsynaptic charge measured before and immediately after PDBu treatment. B, Similar to A, EPSC response to hypertonic sucrose challenge in mass cultures. PDBu increased the EPSC to 128 ± 8% of baseline (100%) (n = 9; *p < 0.03). Bath solution included 25 μm bicuculline and 25 μm d-APV. Error bars indicate SEM.
- Figure 6.
Synaptic Pr differs at active versus dormant synapses after PDBu potentiation. A, PDBu-activated quiescent synapses show lower overall synaptic Pr. A1, Examples of graded depression of INMDAR during MK-801 progressive block in control synapses (left), synapses that were potentiated by PDBu without previous MK-801 block (middle), and PDBu-recovered synapses (right). EPSCs from the indicated stimulus episodes in the presence of MK-801 are superimposed. A2, Peak INMDAR during MK-801 is normalized to the initial INMDAR and plotted against stimulus episode. The plot, averaged from eight to nine cells, is best fitted by a sum of two exponentials (gray lines) in all three conditions. The kinetics of progressive block (25 stimuli) has τfast = 2.0 ± 0.6 (23.8 ± 9.8%) and τslow = 7.6 ± 0.9 (67.3 ± 9.2%) in control (open; n = 8), τfast = 1.38 ± 0.04 (64 ± 3%) and τslow = 5.99 ± 0.59 (32 ± 3%) in PDBu-potentiated current (solid; n = 9), and τfast = 1.98 ± 0.35 (38 ± 6%) and τslow = 14.58 ± 3.8 (62.6 ± 2%) in PDBu-recovered current (gray; n = 8). B, PDBu more strongly potentiated INMDAR at synapse with low Pr. B1, Examples of PDBu-dependent potentiation from a neuron without receptor blockade (left), a neuron with synaptic INMDAR that was partially blocked (∼15% of initial current; middle), and a neuron with synaptic INMDAR that was fully blocked (right). The EPSCs after PDBu potentiation (gray) are superimposed on the EPSC before PDBu treatment (black). B2, Summary of PDBu-mediated potentiation in all three conditions. Level of INMDAR potentiation by PDBu is normalized to IAMPAR potentiation from the same cells (no block, n = 12; partial block, n = 10; full block, n = 11; p < 0.00003 by one-way ANOVA; *p < 0.003, compared with no block; **p < 0.05, compared with partial block by paired t test). Error bars indicate SEM.
- Figure 7.
The initial INMDAR and PDBu-recovered INMDAR have similar NR2B contribution. A, The initial (left) and the recovered INMDAR (right) exhibited similar sensitivity to ifenprodil (3 μm). The sample traces of the initial (left) and the recovered (right) INMDAR in the presence of ifenprodil are superimposed on the current in the absence of ifenprodil. Average ifenprodil sensitivity in the initial current and in PDBu-recovered current was 59.3 ± 4.1% at baseline, n = 9; 51.8 ± 4.9% in PDBu-recovered current, n = 9; p = 0.06. B, The initial and the recovered INMDAR have similar deactivation kinetics. The decay of the recovered INMDAR is indistinguishable from that of the initial current. Example of recovered INMDAR superimposed on the initial current (left). Right, The recovered INMDAR is scaled and superimposed on the peak of the initial current. The average weighted τ of the baseline NMDAR-mediated EPSCs and the recovered EPSCs from 6 cells (weighted τ = 132 ± 13 ms in baseline; 181 ± 24 ms in PDBu-recovered current; p = 0.07).
- Figure 8.
PDBu reduces the percentage of inactive excitatory synapses. A, Example images from control (left), PDBu (middle)-, and FSK (right)-treated synapses. Active synapses were labeled with FM1-43FX (green); glutamatergic terminals were identified by immunoreactivity to vGluT-1 antisera (red). Puncta that are positive for vGluT-1 antisera but devoid of FM1-43FX labeling are inactive excitatory synapses (arrows). B, Quantification of the percentage of inactive glutamatergic terminals in control (20.4 ± 2.8%), or PDBu (3.6 ± 1.1%)-, and FSK (15.2 ± 3%)-treated synapses (*p < 0.00005 compared with control; n = 5). Summary results represent 250 puncta in each condition sampled in 50 fields from five independent experiments. Fields were selected and analyzed by an observer naive to experimental condition. Error bars indicate SEM.
- Figure 9.
PDBu does not reactivate depolarization-inactivated synapses. A, Prolonged depolarization (35 mm [K+]o for 4 h) reduced synaptic current but did not affect PPR. Sample paired AMPAR-mediated EPSCs (50 ms interpulse interval) in control (A1) and in previously depolarized neurons (A2). EPSC measurements here and in other panels were all performed in physiological [K+]o (4 mm) (see Materials and Methods). The average amplitude of IAMPAR was 3.80 ± 0.94 nA in control (Na+; n = 9), and 1.07 ± 0.34 nA in depolarized neurons (K+; n = 10; p < 0.03). The paired-pulse ratio (EPSCsecond/EPSCfirst) in control was 0.69 ± 0.05 (n = 9) and in sibling depolarized neurons was 0.70 ± 0.06 (n = 10; p = 0.84). B, IAMPAR potentiation by PDBu was similar in control and in depolarized neurons. Examples of PDBu potentiated IAMPAR in control (B1) and in depolarized neurons (B2). Average PDBu potentiation in IAMPAR in control was 264.3 ± 70% relative to baseline (n = 9) and in depolarized cultures it was 266 ± 37.7% relative to baseline (n = 10; p = 0.98). C, Sample traces of PDBu-mediated recovered INMDAR in control (C1) and in depolarized neurons (C2). Recovered currents (gray) are superimposed on the initial currents (black). Average effect of PDBu on the recovered synaptic INMDAR in control was 21.6 ± 6.1% relative to the initial current (n = 9) and in depolarized neurons it was 31.3 ± 6.1% to the initial current (n = 10; p = 0.27).


Additional Files
Supplemental Data
Files in this Data Supplement:
- supplemental material - Supplemental Figures


